1.先安装docker环境
yum -y install  yum-utils device-mapper-persistent-data lvm2

#导入docker安装库
yum-config-manager \
    --add-repo \
    https://download.docker.com/linux/centos/docker-ce.repo
#按指定版本安装好docker
yum install docker-ce-20.10.5 docker-ce-cli-20.10.5 docker-ce-rootless-extras-20.10.5 -y

systemctl restart docker.service
2.安装zabbix
拉取相关镜像
docker pull mysql:8.0.28
docker pull zabbix/zabbix-server-mysql:alpine-6.0.6
docker pull zabbix/zabbix-web-nginx-mysql:alpine-6.0.6
docker pull zabbix/zabbix-agent2
docker pull zabbix/zabbix-snmptraps:alpine-6.0.6
建立一个docker网络
docker network create --subnet 172.17.0.0/16 --ip-range 172.17.200.0/24 zabbix-net

docker rm $(docker container ls -aq)

docker run --name zabbix-mysql -t -e MYSQL_DATABASE="zabbix" -e MYSQL_USER="zabbix" -e MYSQL_PASSWORD="zabbix" -e MYSQL_ROOT_PASSWORD="root123" -e TZ="Asia/Shanghai" -e ZBX_DBTLSCONNECT="required" --network=zabbix-net --ip=172.17.201.1 --restart=always --privileged=true -d mysql:8.0.28

docker run --name zabbix-server-mysql -v /usr/lib/zabbix/alertscripts:/usr/lib/zabbix/alertscripts -t -e DB_SERVER_HOST="zabbix-mysql" -e MYSQL_DATABASE="zabbix" -e MYSQL_USER="zabbix" -e MYSQL_PASSWORD="zabbix" -e MYSQL_ROOT_PASSWORD="root123" -e TZ="Asia/Shanghai" --network=zabbix-net --ip=172.17.201.3 -p 10051:10051 --restart=always --privileged=true -d zabbix/zabbix-server-mysql:alpine-6.0.6

docker run --name zabbix-web-nginx-mysql -t -e ZBX_SERVER_HOST="zabbix-server-mysql" -e DB_SERVER_HOST="zabbix-mysql" -e MYSQL_DATABASE="zabbix" -e MYSQL_USER="zabbix" -e MYSQL_PASSWORD="zabbix" -e MYSQL_ROOT_PASSWORD="root123" -e TZ="Asia/Shanghai" -e PHP_TZ="Asia/shanghai" --network=zabbix-net --ip=172.17.201.4 -p 8081:8080 --restart=always --privileged=true -d zabbix/zabbix-web-nginx-mysql:alpine-6.0.6

docker run --name zabbix-agent-2 -e ZBX_SERVER_HOST="zabbix-server-mysql" -e ZBX_HOSTNAME="Zabbix server" -e TZ="Asia/Shanghai" --network=zabbix-net --ip=172.17.201.5 -p 10050:10050 --restart=always --privileged=true -d zabbix/zabbix-agent2


docker run --name zabbix-snmptraps -e ZBX_SERVER_HOST="zabbix-server-mysql" -e ZBX_HOSTNAME="Zabbix server" -e TZ="Asia/Shanghai" --network=zabbix-net --ip=172.17.201.15 -p 161:161 --restart=always --privileged=true -d zabbix/zabbix-snmptraps:alpine-6.0.6
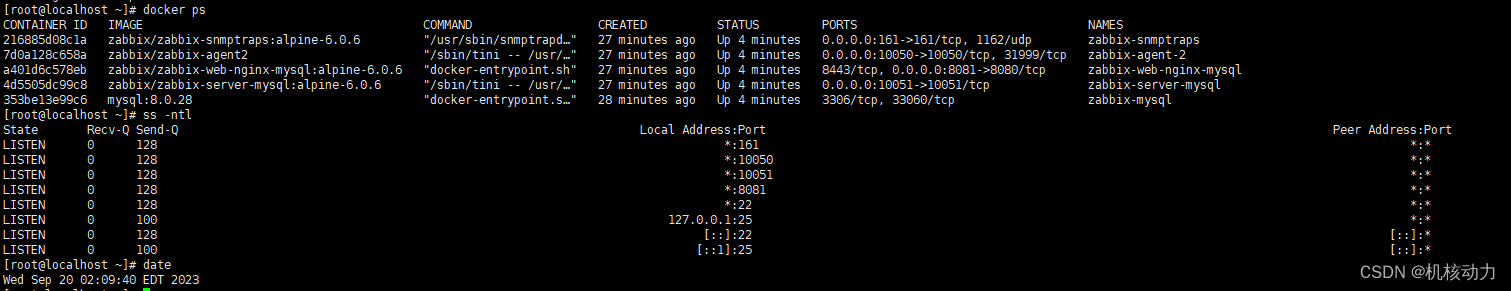
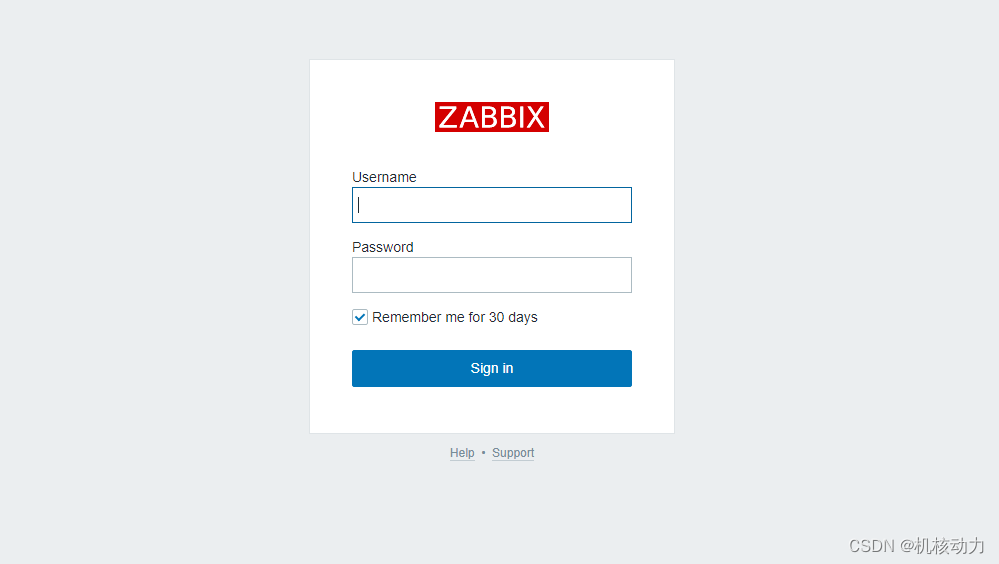
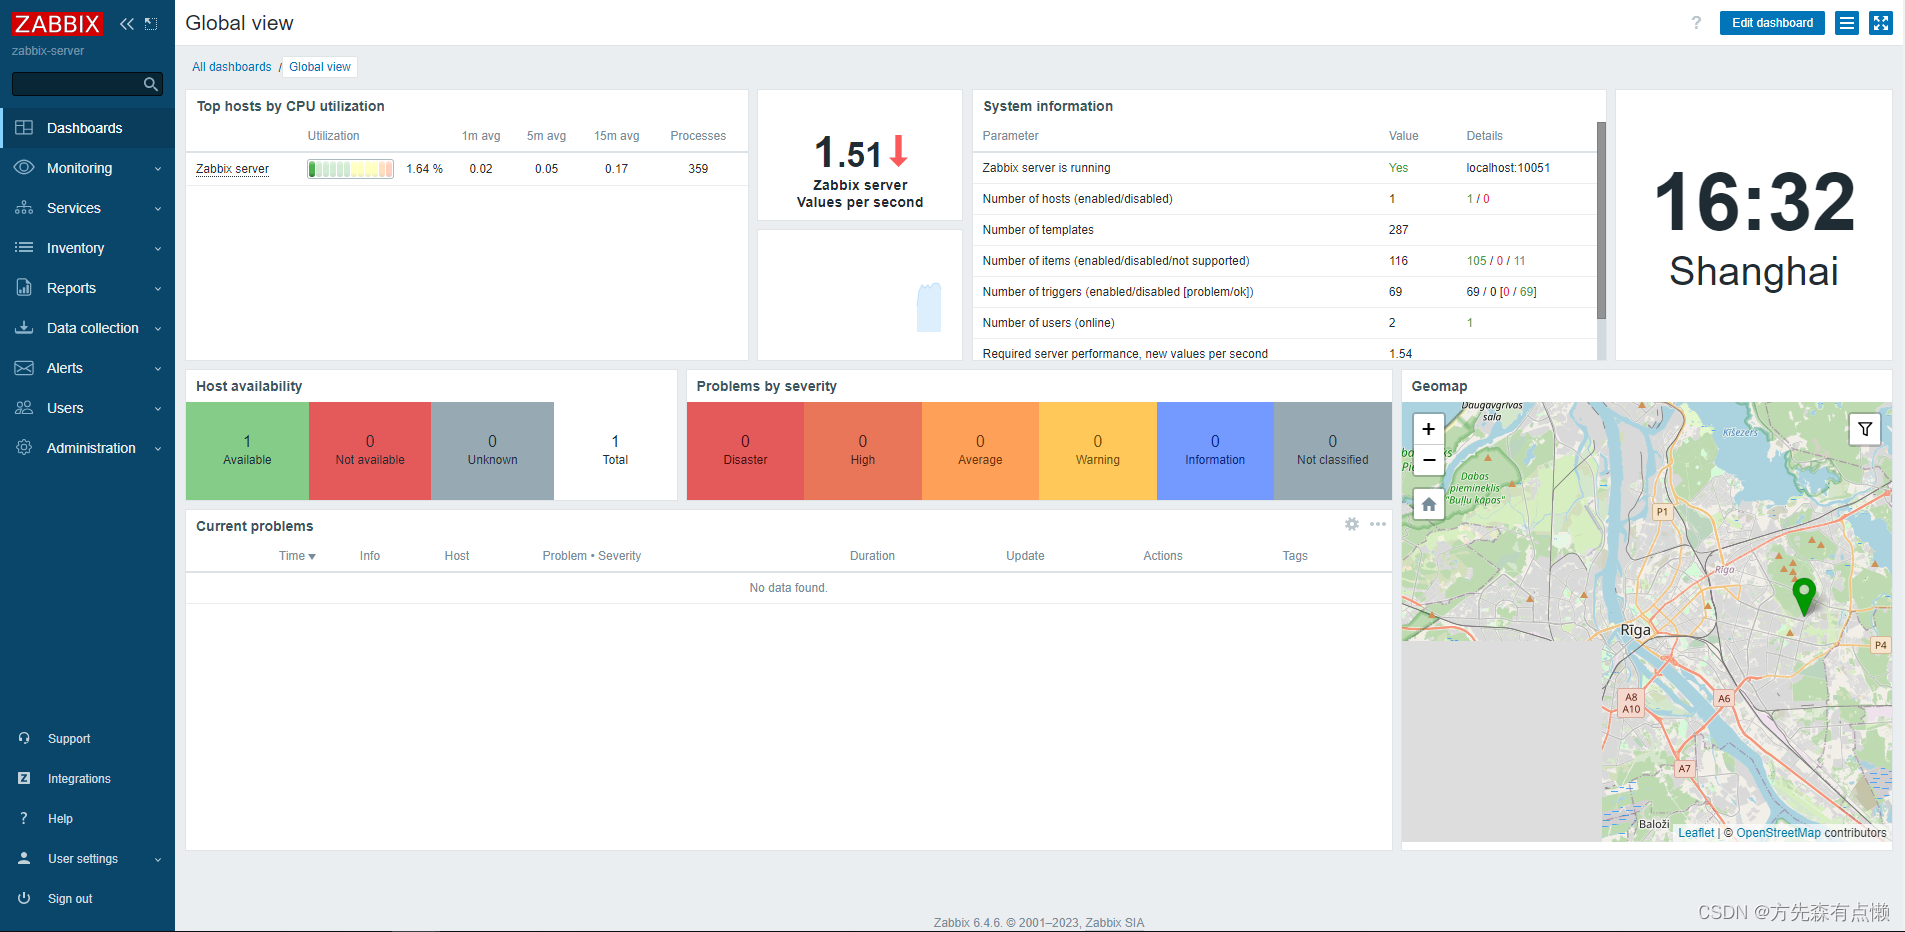
这样整个zabbix就运行起来了,然后通过ip访问8081端口。默认用户名:Admin 密码:zabbix
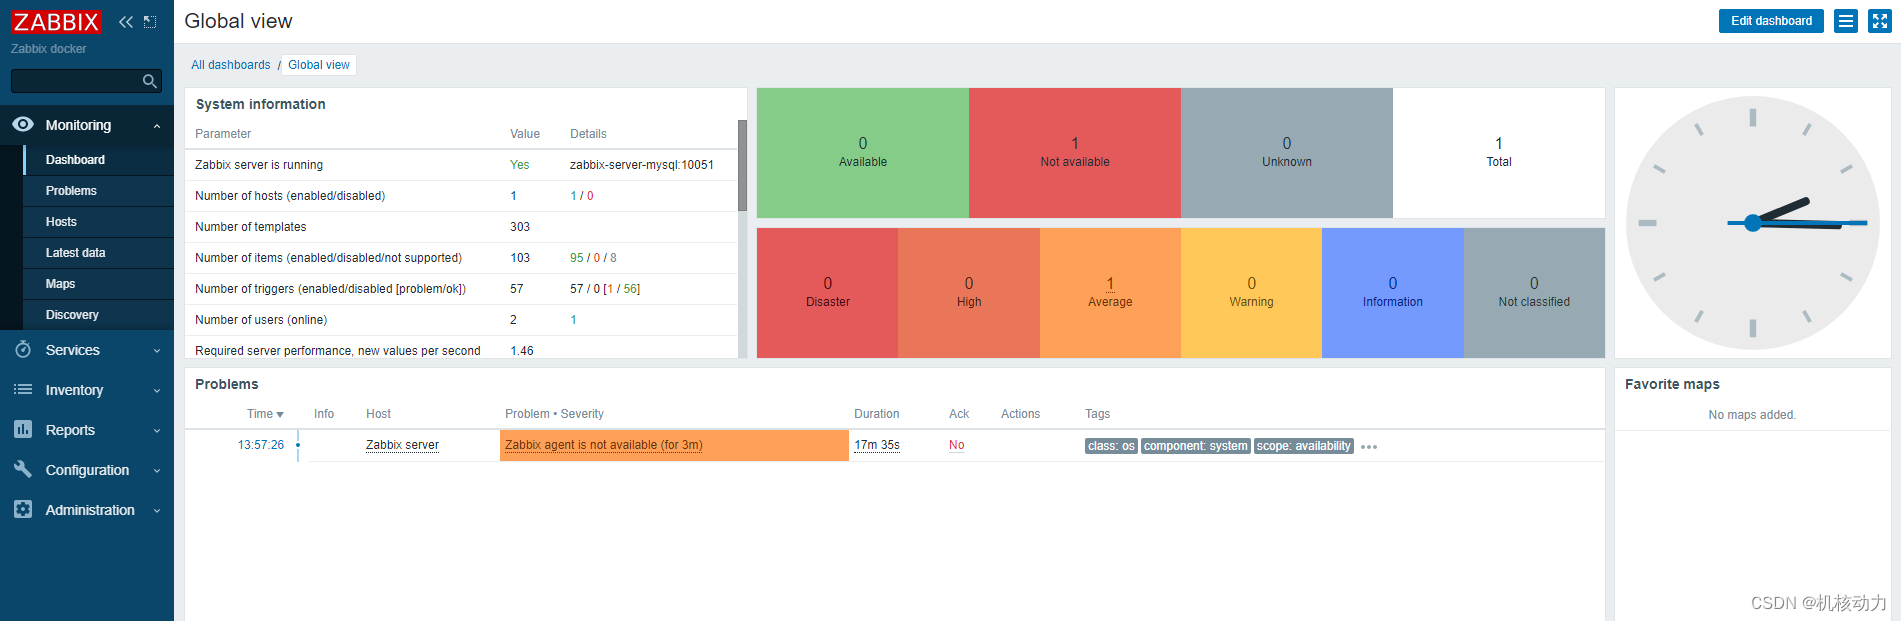
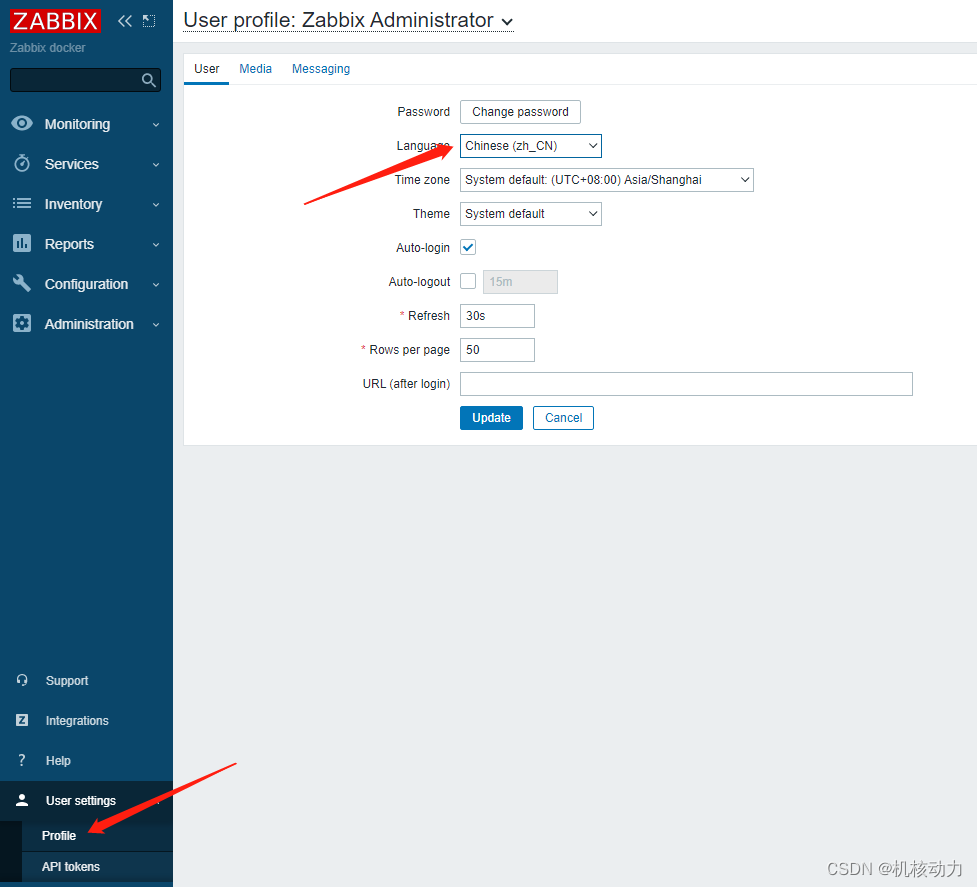
通过下面的设置,设置zabbix为中文
设置完成之后,开始配置需要监控的客户机,在客户机上安装zabbix-agent。
Centos的安装
yum -y install zabbix6.0-agent

systemctl restart zabbix-agent
systemctl enable zabbix-agent
Ubuntu的安装
apt install zabbix-agent
systemctl start zabbix-agent.service

###查看状态
systemctl status zabbix-agent.service

###重新启动服务
systemctl restart zabbix-agent.service

###设置成开机自启动
systemctl enable zabbix-agent.service
修改agent的配置,增加如下选项
vi /etc/zabbix_agentd.conf
Server=192.168.124.141 //zabbixserver
ServerActive=192.168.124.141 //zabbixserver
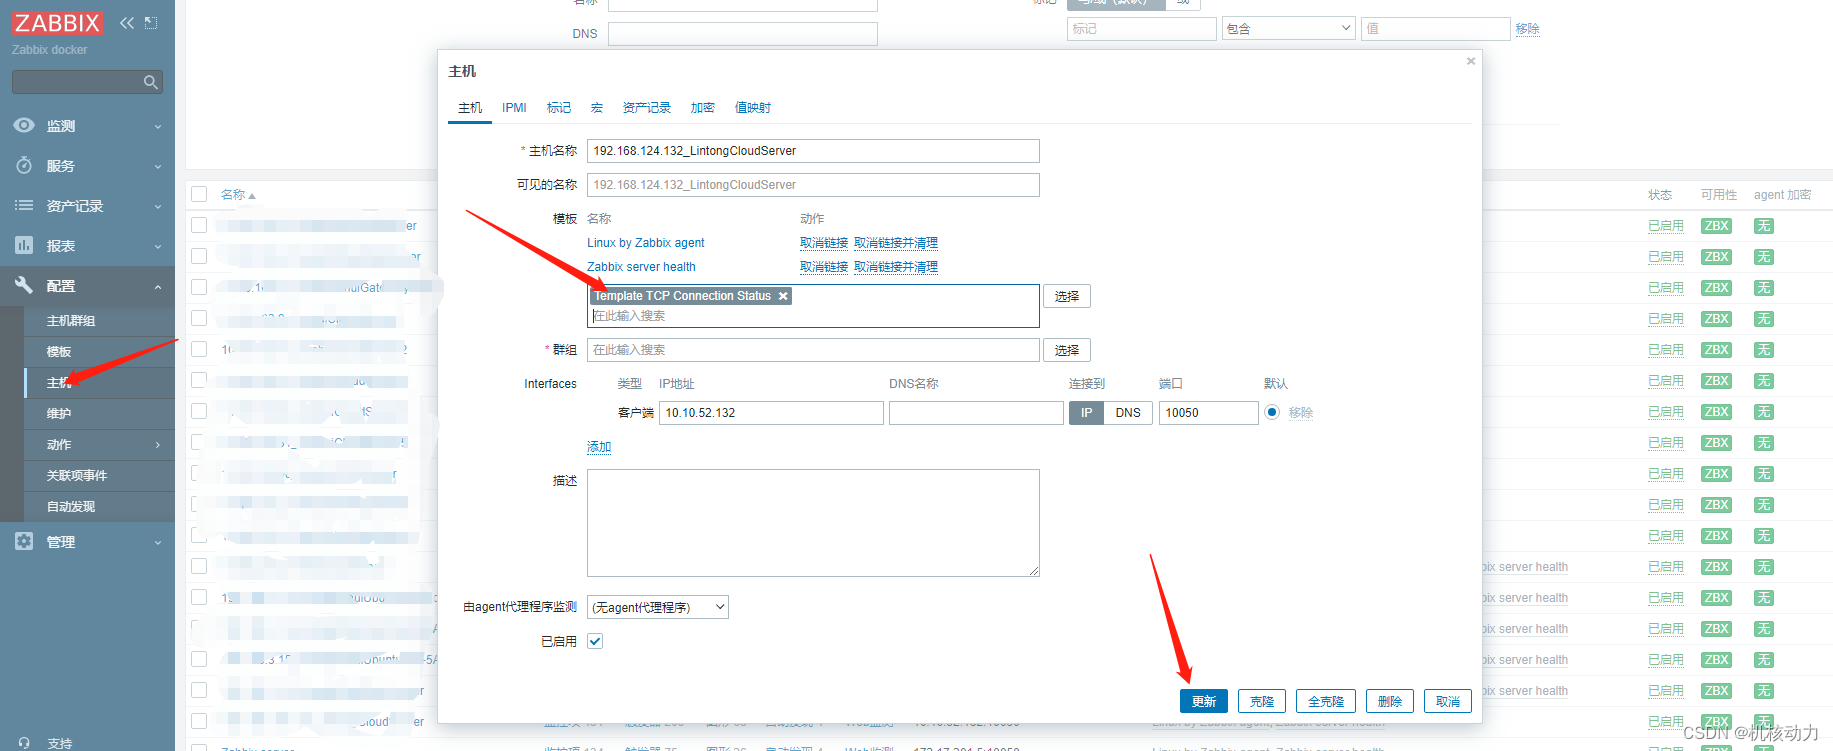
Hostname=192.168.124.132_LintongCloudServer //这个Hostname要与zabbix server上的hostname一致。
然后配置zabbix server web服务端主机配置,如下:

配置好后,在zabbix web端会这样显示。

由于zabbix没有监控Tcp的连接状态,这里需要我们自己用shell来实现这些,并且通过自己的自定义模板导入到zabbix
登录需要监控的客户机运行以下命令,用以下脚本安装tcp数据的监控,因为我已经做成了自动化安装脚本,所以脚本的内容如下:
mkdir -p /usr/local/zabbix-agent/scripts/
mkdir -p /etc/zabbix/zabbix_agentd.d/


is_ubuntu=`cat /proc/version  | grep "Ubuntu" -c`
if [ $is_ubuntu -ge "1" ] ; then
 	echo "Ubuntu System"
	isExist=$(grep "^#" /etc/zabbix/zabbix_agentd.conf -v | grep UnsafeUserParameters -c ) && test -n "$isExist" || echo "UnsafeUserParameters=1" >> /etc/zabbix/zabbix_agentd.conf
	isExist=$(grep "^#" /etc/zabbix/zabbix_agentd.conf -v | grep Include -c ) && test -n "$isExist" || echo "Include=/etc/zabbix/zabbix_agentd.d/*.conf" >> /etc/zabbix/zabbix_agentd.conf
	echo "UserParameter=tcp.status[*],/usr/local/zabbix-agent/scripts/tcp_conn_status.sh \$1" > /etc/zabbix/zabbix_agentd.conf.d/tcp-status-params.conf
else
  echo "Not Ubuntu System"
 	isExist=$(grep "^#" /etc/zabbix_agentd.conf -v | grep UnsafeUserParameters -c ) && test -n "$isExist" || echo "UnsafeUserParameters=1" >> /etc/zabbix_agentd.conf
	isExist=$(grep "^#" /etc/zabbix_agentd.conf -v | grep Include -c ) && test -n "$isExist" || echo "Include=/etc/zabbix/zabbix_agentd.d/*.conf" >> /etc/zabbix_agentd.conf
	echo "UserParameter=tcp.status[*],/usr/local/zabbix-agent/scripts/tcp_conn_status.sh \$1" > /etc/zabbix/zabbix_agentd.d/tcp-status-params.conf
fi


curl -u "test:test123" -O  http://10.10.52.134:88/wxmessage/tcp_conn_status.sh ; mv tcp_conn_status.sh /usr/local/zabbix-agent/scripts/
chmod 711 /usr/local/zabbix-agent/scripts/tcp_conn_status.sh
chown zabbix:zabbix /usr/local/zabbix-agent/scripts/tcp_conn_status.sh

/usr/local/zabbix-agent/scripts/tcp_conn_status.sh listen

service zabbix-agent restart

zabbix_agentd -t tcp.status[listen]
执行成功后,会出现zabbix_agentd执行的结果

这里还有一个执行被监控机器的tcp状态的shell脚本,内容如下:
#!/bin/bash
#this script is used to get tcp and udp connetion status
#tcp status
source /etc/profile
metric=$1
tmp_file=/tmp/tcp_status.txt
ss -an | grep "^tcp" |  awk '{print $2}' | sort | uniq -c | awk '{print $2" "$1}' > $tmp_file

case $metric in
   closed)
          output=$(awk '/CLOSED/{print $2}' $tmp_file)
          if [ "$output" == "" ];then
             echo 0
          else
             echo $output
          fi
        ;;
   listen)
          output=$(awk '/LISTEN/{print $2}' $tmp_file)
          if [ "$output" == "" ];then
             echo 0
          else
             echo $output
          fi
        ;;
   synrecv)
          output=$(awk '/SYN-RECV/{print $2}' $tmp_file)
          if [ "$output" == "" ];then
             echo 0
          else
             echo $output
          fi
        ;;
   synsent)
          output=$(awk '/SYN-SENT/{print $2}' $tmp_file)
          if [ "$output" == "" ];then
             echo 0
          else
             echo $output
          fi
        ;;
   established)
          output=$(awk '/ESTAB/{print $2}' $tmp_file)
          if [ "$output" == "" ];then
             echo 0
          else
             echo $output
          fi
        ;;
   timewait)
          output=$(awk '/TIME-WAIT/{print $2}' $tmp_file)
          if [ "$output" == "" ];then
             echo 0
          else
             echo $output
          fi
        ;;
   closing)
          output=$(awk '/CLOSING/{print $2}' $tmp_file)
          if [ "$output" == "" ];then
             echo 0
          else
             echo $output
          fi
        ;;
   closewait)
          output=$(awk '/CLOSE-WAIT/{print $2}' $tmp_file)
          if [ "$output" == "" ];then
             echo 0
          else
             echo $output
          fi
        ;;
   lastack)
          output=$(awk '/LAST-ACK/{print $2}' $tmp_file)
          if [ "$output" == "" ];then
             echo 0
          else
             echo $output
          fi
         ;;
   finwait1)
          output=$(awk '/FIN-WAIT-1/{print $2}' $tmp_file)
          if [ "$output" == "" ];then
             echo 0
          else
             echo $output
          fi
         ;;
   finwait2)
          output=$(awk '/FIN-WAIT-2/{print $2}' $tmp_file)
          if [ "$output" == "" ];then
             echo 0
          else
             echo $output
          fi
         ;;
         *)
          echo -e "\e[033mUsage: sh  $0 [closed|closing|closewait|synrecv|synsent|finwait1|finwait2|listen|established|lastack|timewait]\e[0m"

esac
如果被监控客户端机器已经把脚本都安装完整,然后我们在zabbix server的web端添加模板。模板是一个xml文件,内容如下。
<?xml version="1.0" encoding="UTF-8"?>
<zabbix_export>
<version>2.0</version>
<date>2023-09-20T09:41:57Z</date>
<groups>
<group>
<name>Templates</name>
</group>
</groups>
<templates>
<template>
<template>Template TCP Connection Status</template>
<name>Template TCP Connection Status</name>
<groups>
<group>
<name>Templates</name>
</group>
</groups>
<applications>
<application>
<name>TCP Status</name>
</application>
</applications>
<items>
<item>
<name>CLOSED</name>
<type>0</type>
<snmp_community/>
<multiplier>0</multiplier>
<snmp_oid/>
<key>tcp.status[closed]</key>
<delay>60</delay>
<history>90</history>
<trends>365</trends>
<status>0</status>
<value_type>3</value_type>
<allowed_hosts/>
<units/>
<delta>0</delta>
<snmpv3_contextname/>
<snmpv3_securityname/>
<snmpv3_securitylevel>0</snmpv3_securitylevel>
<snmpv3_authprotocol>0</snmpv3_authprotocol>
<snmpv3_authpassphrase/>
<snmpv3_privprotocol>0</snmpv3_privprotocol>
<snmpv3_privpassphrase/>
<formula>1</formula>
<delay_flex/>
<params/>
<ipmi_sensor/>
<data_type>0</data_type>
<authtype>0</authtype>
<username/>
<password/>
<publickey/>
<privatekey/>
<port/>
<description/>
<inventory_link>0</inventory_link>
<applications>
<application>
<name>TCP Status</name>
</application>
</applications>
<valuemap/>
</item>
<item>
<name>CLOSE_WAIT</name>
<type>0</type>
<snmp_community/>
<multiplier>0</multiplier>
<snmp_oid/>
<key>tcp.status[closewait]</key>
<delay>60</delay>
<history>90</history>
<trends>365</trends>
<status>0</status>
<value_type>3</value_type>
<allowed_hosts/>
<units/>
<delta>0</delta>
<snmpv3_contextname/>
<snmpv3_securityname/>
<snmpv3_securitylevel>0</snmpv3_securitylevel>
<snmpv3_authprotocol>0</snmpv3_authprotocol>
<snmpv3_authpassphrase/>
<snmpv3_privprotocol>0</snmpv3_privprotocol>
<snmpv3_privpassphrase/>
<formula>1</formula>
<delay_flex/>
<params/>
<ipmi_sensor/>
<data_type>0</data_type>
<authtype>0</authtype>
<username/>
<password/>
<publickey/>
<privatekey/>
<port/>
<description/>
<inventory_link>0</inventory_link>
<applications>
<application>
<name>TCP Status</name>
</application>
</applications>
<valuemap/>
</item>
<item>
<name>CLOSING</name>
<type>0</type>
<snmp_community/>
<multiplier>0</multiplier>
<snmp_oid/>
<key>tcp.status[closing]</key>
<delay>60</delay>
<history>90</history>
<trends>365</trends>
<status>0</status>
<value_type>3</value_type>
<allowed_hosts/>
<units/>
<delta>0</delta>
<snmpv3_contextname/>
<snmpv3_securityname/>
<snmpv3_securitylevel>0</snmpv3_securitylevel>
<snmpv3_authprotocol>0</snmpv3_authprotocol>
<snmpv3_authpassphrase/>
<snmpv3_privprotocol>0</snmpv3_privprotocol>
<snmpv3_privpassphrase/>
<formula>1</formula>
<delay_flex/>
<params/>
<ipmi_sensor/>
<data_type>0</data_type>
<authtype>0</authtype>
<username/>
<password/>
<publickey/>
<privatekey/>
<port/>
<description/>
<inventory_link>0</inventory_link>
<applications>
<application>
<name>TCP Status</name>
</application>
</applications>
<valuemap/>
</item>
<item>
<name>ESTABLISHED</name>
<type>0</type>
<snmp_community/>
<multiplier>0</multiplier>
<snmp_oid/>
<key>tcp.status[established]</key>
<delay>60</delay>
<history>90</history>
<trends>365</trends>
<status>0</status>
<value_type>3</value_type>
<allowed_hosts/>
<units/>
<delta>0</delta>
<snmpv3_contextname/>
<snmpv3_securityname/>
<snmpv3_securitylevel>0</snmpv3_securitylevel>
<snmpv3_authprotocol>0</snmpv3_authprotocol>
<snmpv3_authpassphrase/>
<snmpv3_privprotocol>0</snmpv3_privprotocol>
<snmpv3_privpassphrase/>
<formula>1</formula>
<delay_flex/>
<params/>
<ipmi_sensor/>
<data_type>0</data_type>
<authtype>0</authtype>
<username/>
<password/>
<publickey/>
<privatekey/>
<port/>
<description/>
<inventory_link>0</inventory_link>
<applications>
<application>
<name>TCP Status</name>
</application>
</applications>
<valuemap/>
</item>
<item>
<name>FIN_WAIT1</name>
<type>0</type>
<snmp_community/>
<multiplier>0</multiplier>
<snmp_oid/>
<key>tcp.status[finwait1]</key>
<delay>60</delay>
<history>90</history>
<trends>365</trends>
<status>0</status>
<value_type>3</value_type>
<allowed_hosts/>
<units/>
<delta>0</delta>
<snmpv3_contextname/>
<snmpv3_securityname/>
<snmpv3_securitylevel>0</snmpv3_securitylevel>
<snmpv3_authprotocol>0</snmpv3_authprotocol>
<snmpv3_authpassphrase/>
<snmpv3_privprotocol>0</snmpv3_privprotocol>
<snmpv3_privpassphrase/>
<formula>1</formula>
<delay_flex/>
<params/>
<ipmi_sensor/>
<data_type>0</data_type>
<authtype>0</authtype>
<username/>
<password/>
<publickey/>
<privatekey/>
<port/>
<description/>
<inventory_link>0</inventory_link>
<applications>
<application>
<name>TCP Status</name>
</application>
</applications>
<valuemap/>
</item>
<item>
<name>FIN_WAIT2</name>
<type>0</type>
<snmp_community/>
<multiplier>0</multiplier>
<snmp_oid/>
<key>tcp.status[finwait2]</key>
<delay>60</delay>
<history>90</history>
<trends>365</trends>
<status>0</status>
<value_type>3</value_type>
<allowed_hosts/>
<units/>
<delta>0</delta>
<snmpv3_contextname/>
<snmpv3_securityname/>
<snmpv3_securitylevel>0</snmpv3_securitylevel>
<snmpv3_authprotocol>0</snmpv3_authprotocol>
<snmpv3_authpassphrase/>
<snmpv3_privprotocol>0</snmpv3_privprotocol>
<snmpv3_privpassphrase/>
<formula>1</formula>
<delay_flex/>
<params/>
<ipmi_sensor/>
<data_type>0</data_type>
<authtype>0</authtype>
<username/>
<password/>
<publickey/>
<privatekey/>
<port/>
<description/>
<inventory_link>0</inventory_link>
<applications>
<application>
<name>TCP Status</name>
</application>
</applications>
<valuemap/>
</item>
<item>
<name>LAST_ACK</name>
<type>0</type>
<snmp_community/>
<multiplier>0</multiplier>
<snmp_oid/>
<key>tcp.status[lastack]</key>
<delay>60</delay>
<history>90</history>
<trends>365</trends>
<status>0</status>
<value_type>3</value_type>
<allowed_hosts/>
<units/>
<delta>0</delta>
<snmpv3_contextname/>
<snmpv3_securityname/>
<snmpv3_securitylevel>0</snmpv3_securitylevel>
<snmpv3_authprotocol>0</snmpv3_authprotocol>
<snmpv3_authpassphrase/>
<snmpv3_privprotocol>0</snmpv3_privprotocol>
<snmpv3_privpassphrase/>
<formula>1</formula>
<delay_flex/>
<params/>
<ipmi_sensor/>
<data_type>0</data_type>
<authtype>0</authtype>
<username/>
<password/>
<publickey/>
<privatekey/>
<port/>
<description/>
<inventory_link>0</inventory_link>
<applications>
<application>
<name>TCP Status</name>
</application>
</applications>
<valuemap/>
</item>
<item>
<name>LISTEN</name>
<type>0</type>
<snmp_community/>
<multiplier>0</multiplier>
<snmp_oid/>
<key>tcp.status[listen]</key>
<delay>60</delay>
<history>90</history>
<trends>365</trends>
<status>0</status>
<value_type>3</value_type>
<allowed_hosts/>
<units/>
<delta>0</delta>
<snmpv3_contextname/>
<snmpv3_securityname/>
<snmpv3_securitylevel>0</snmpv3_securitylevel>
<snmpv3_authprotocol>0</snmpv3_authprotocol>
<snmpv3_authpassphrase/>
<snmpv3_privprotocol>0</snmpv3_privprotocol>
<snmpv3_privpassphrase/>
<formula>1</formula>
<delay_flex/>
<params/>
<ipmi_sensor/>
<data_type>0</data_type>
<authtype>0</authtype>
<username/>
<password/>
<publickey/>
<privatekey/>
<port/>
<description/>
<inventory_link>0</inventory_link>
<applications>
<application>
<name>TCP Status</name>
</application>
</applications>
<valuemap/>
</item>
<item>
<name>SYN_RECV</name>
<type>0</type>
<snmp_community/>
<multiplier>0</multiplier>
<snmp_oid/>
<key>tcp.status[synrecv]</key>
<delay>60</delay>
<history>90</history>
<trends>365</trends>
<status>0</status>
<value_type>3</value_type>
<allowed_hosts/>
<units/>
<delta>0</delta>
<snmpv3_contextname/>
<snmpv3_securityname/>
<snmpv3_securitylevel>0</snmpv3_securitylevel>
<snmpv3_authprotocol>0</snmpv3_authprotocol>
<snmpv3_authpassphrase/>
<snmpv3_privprotocol>0</snmpv3_privprotocol>
<snmpv3_privpassphrase/>
<formula>1</formula>
<delay_flex/>
<params/>
<ipmi_sensor/>
<data_type>0</data_type>
<authtype>0</authtype>
<username/>
<password/>
<publickey/>
<privatekey/>
<port/>
<description/>
<inventory_link>0</inventory_link>
<applications>
<application>
<name>TCP Status</name>
</application>
</applications>
<valuemap/>
</item>
<item>
<name>SYN_SENT</name>
<type>0</type>
<snmp_community/>
<multiplier>0</multiplier>
<snmp_oid/>
<key>tcp.status[synsent]</key>
<delay>60</delay>
<history>90</history>
<trends>365</trends>
<status>0</status>
<value_type>3</value_type>
<allowed_hosts/>
<units/>
<delta>0</delta>
<snmpv3_contextname/>
<snmpv3_securityname/>
<snmpv3_securitylevel>0</snmpv3_securitylevel>
<snmpv3_authprotocol>0</snmpv3_authprotocol>
<snmpv3_authpassphrase/>
<snmpv3_privprotocol>0</snmpv3_privprotocol>
<snmpv3_privpassphrase/>
<formula>1</formula>
<delay_flex/>
<params/>
<ipmi_sensor/>
<data_type>0</data_type>
<authtype>0</authtype>
<username/>
<password/>
<publickey/>
<privatekey/>
<port/>
<description/>
<inventory_link>0</inventory_link>
<applications>
<application>
<name>TCP Status</name>
</application>
</applications>
<valuemap/>
</item>
<item>
<name>TIME_WAIT</name>
<type>0</type>
<snmp_community/>
<multiplier>0</multiplier>
<snmp_oid/>
<key>tcp.status[timewait]</key>
<delay>60</delay>
<history>90</history>
<trends>365</trends>
<status>0</status>
<value_type>3</value_type>
<allowed_hosts/>
<units/>
<delta>0</delta>
<snmpv3_contextname/>
<snmpv3_securityname/>
<snmpv3_securitylevel>0</snmpv3_securitylevel>
<snmpv3_authprotocol>0</snmpv3_authprotocol>
<snmpv3_authpassphrase/>
<snmpv3_privprotocol>0</snmpv3_privprotocol>
<snmpv3_privpassphrase/>
<formula>1</formula>
<delay_flex/>
<params/>
<ipmi_sensor/>
<data_type>0</data_type>
<authtype>0</authtype>
<username/>
<password/>
<publickey/>
<privatekey/>
<port/>
<description/>
<inventory_link>0</inventory_link>
<applications>
<application>
<name>TCP Status</name>
</application>
</applications>
<valuemap/>
</item>
</items>
<discovery_rules/>
<macros/>
<templates/>
<screens/>
</template>
</templates>
<triggers>
<trigger>
<expression>{Template TCP Connection Status:tcp.status[timewait].last()}>3000</expression>
<name>There are too many TCP TIME_WAIT status</name>
<url/>
<status>0</status>
<priority>4</priority>
<description/>
<type>0</type>
<dependencies/>
</trigger>
</triggers>
<graphs>
<graph>
<name>TCP Status</name>
<width>900</width>
<height>200</height>
<yaxismin>0.0000</yaxismin>
<yaxismax>100.0000</yaxismax>
<show_work_period>1</show_work_period>
<show_triggers>1</show_triggers>
<type>0</type>
<show_legend>1</show_legend>
<show_3d>0</show_3d>
<percent_left>0.0000</percent_left>
<percent_right>0.0000</percent_right>
<ymin_type_1>0</ymin_type_1>
<ymax_type_1>0</ymax_type_1>
<ymin_item_1>0</ymin_item_1>
<ymax_item_1>0</ymax_item_1>
<graph_items>
<graph_item>
<sortorder>0</sortorder>
<drawtype>0</drawtype>
<color>C80000</color>
<yaxisside>0</yaxisside>
<calc_fnc>2</calc_fnc>
<type>0</type>
<item>
<host>Template TCP Connection Status</host>
<key>tcp.status[closed]</key>
</item>
</graph_item>
<graph_item>
<sortorder>1</sortorder>
<drawtype>0</drawtype>
<color>00C800</color>
<yaxisside>0</yaxisside>
<calc_fnc>2</calc_fnc>
<type>0</type>
<item>
<host>Template TCP Connection Status</host>
<key>tcp.status[closewait]</key>
</item>
</graph_item>
<graph_item>
<sortorder>2</sortorder>
<drawtype>0</drawtype>
<color>0000C8</color>
<yaxisside>0</yaxisside>
<calc_fnc>2</calc_fnc>
<type>0</type>
<item>
<host>Template TCP Connection Status</host>
<key>tcp.status[closing]</key>
</item>
</graph_item>
<graph_item>
<sortorder>3</sortorder>
<drawtype>0</drawtype>
<color>C800C8</color>
<yaxisside>0</yaxisside>
<calc_fnc>2</calc_fnc>
<type>0</type>
<item>
<host>Template TCP Connection Status</host>
<key>tcp.status[established]</key>
</item>
</graph_item>
<graph_item>
<sortorder>4</sortorder>
<drawtype>0</drawtype>
<color>00C8C8</color>
<yaxisside>0</yaxisside>
<calc_fnc>2</calc_fnc>
<type>0</type>
<item>
<host>Template TCP Connection Status</host>
<key>tcp.status[finwait1]</key>
</item>
</graph_item>
<graph_item>
<sortorder>5</sortorder>
<drawtype>0</drawtype>
<color>C8C800</color>
<yaxisside>0</yaxisside>
<calc_fnc>2</calc_fnc>
<type>0</type>
<item>
<host>Template TCP Connection Status</host>
<key>tcp.status[finwait2]</key>
</item>
</graph_item>
<graph_item>
<sortorder>6</sortorder>
<drawtype>0</drawtype>
<color>C8C8C8</color>
<yaxisside>0</yaxisside>
<calc_fnc>2</calc_fnc>
<type>0</type>
<item>
<host>Template TCP Connection Status</host>
<key>tcp.status[lastack]</key>
</item>
</graph_item>
<graph_item>
<sortorder>7</sortorder>
<drawtype>0</drawtype>
<color>960000</color>
<yaxisside>0</yaxisside>
<calc_fnc>2</calc_fnc>
<type>0</type>
<item>
<host>Template TCP Connection Status</host>
<key>tcp.status[listen]</key>
</item>
</graph_item>
<graph_item>
<sortorder>8</sortorder>
<drawtype>0</drawtype>
<color>009600</color>
<yaxisside>0</yaxisside>
<calc_fnc>2</calc_fnc>
<type>0</type>
<item>
<host>Template TCP Connection Status</host>
<key>tcp.status[synrecv]</key>
</item>
</graph_item>
<graph_item>
<sortorder>9</sortorder>
<drawtype>0</drawtype>
<color>000096</color>
<yaxisside>0</yaxisside>
<calc_fnc>2</calc_fnc>
<type>0</type>
<item>
<host>Template TCP Connection Status</host>
<key>tcp.status[synsent]</key>
</item>
</graph_item>
<graph_item>
<sortorder>10</sortorder>
<drawtype>0</drawtype>
<color>960096</color>
<yaxisside>0</yaxisside>
<calc_fnc>2</calc_fnc>
<type>0</type>
<item>
<host>Template TCP Connection Status</host>
<key>tcp.status[timewait]</key>
</item>
</graph_item>
</graph_items>
</graph>
</graphs>
</zabbix_export>
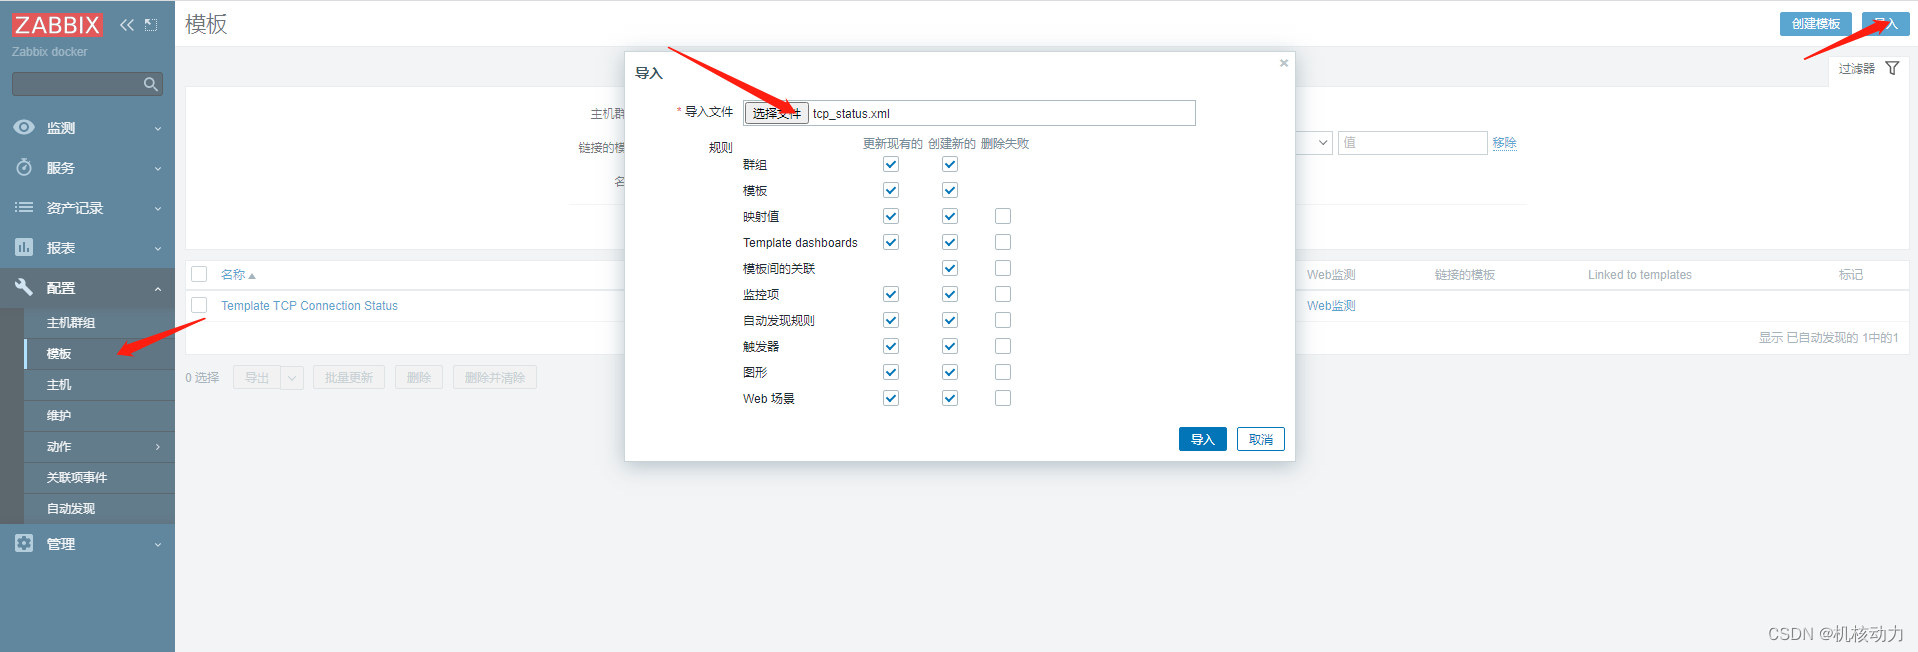
添加模板成功后,主机开始绑定这个模板。
然后监视的主机里面就可以看到数据了。


![buuctf web [极客大挑战 2019]Upload](https://img-blog.csdnimg.cn/ceef84513bc44642b280c3190af815ac.png)