背景
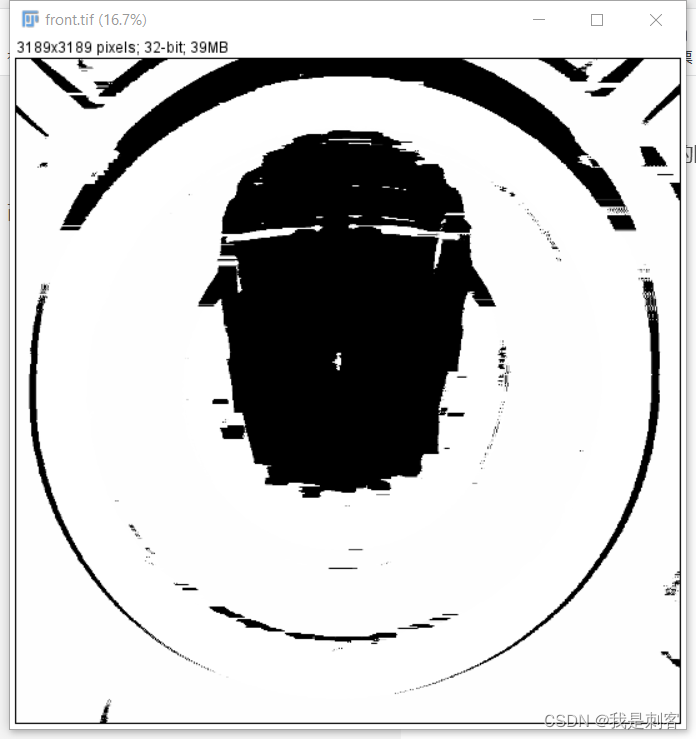
由于需要经常分析浮点型的图像,而浮点型图像经常不能突出显示感兴趣的区域的,如下图所示:
而使用imagej软件,选中一个较小的感兴趣区域,调出其直方图,然后点击设置就可以增强整个图像对比度,突出显示感兴趣的区域,如下图所示。

我一直很好奇,他这个的实现原理什么。
实现
通过观察imagej的直方图可知,在那个局部区域内有明显的两个波峰,分别对应图像深度的下限和上限,我们只要找到这两个波峰,然后只保留在此波峰限定的范围内的值即可,小于波峰下限的值赋值一个更小的值,大于波峰上限的值赋值一个更大的值,最后基于OpenCV把深度图转换为灰度图即可。
找到直方图的第二个峰值,第二个峰值不一定是直方图的第二大值,因为它很有可能出现在第一个峰值的附近。可以通过以下公式进行计算
s e c o n d P e a k = a r g k m a x ( k − f i r s t P e a k ) 2 ∗ h i s t o g r a m I ( k ) , 0 ≤ k ≤ 255 secondPeak = arg_k max { ( k − firstPeak )^2 ∗ histogram I ( k ) } , 0 ≤ k ≤ 255 secondPeak=argkmax(k−firstPeak)2∗histogramI(k),0≤k≤255
cv::Mat depth2Gray(cv::Mat depth)
{
	cv::Mat d = depth.clone();
	const int width = d.cols;
	const int height = d.rows;
	const size_t allNum = size_t(width) * size_t(height);
	// 需要显示的深度上下限
	const float minValue = -5.f;
	const float maxValue = 2.f;
	float* data = (float*)d.data;
	// 直方图统计
	int channels[] = { 0 };
	cv::Mat_<float> hist;
	const int dims = 1;
	const float step = 1.0;
	const float low = -4.f;
	const float high = 1.0;
	const int hBins = std::floor((high - low) / step) + 1;
	int histSize[] = { hBins };
	//每一个维度取值范围
	float pranges[] = { low, high };//取值区间
	const float* ranges[] = { pranges };

	cv::calcHist(&d, 1, channels, cv::Mat(), hist, dims,
		histSize, ranges, true, false);

	// 取第一个最大波峰
	double minvv, maxvv;
	int minIndx, maxIndx;
	cv::minMaxIdx(hist, &minvv, &maxvv, &minIndx, &maxIndx);
	// 取第二大波峰
	const int num = hist.rows * hist.cols;
	std::vector<float> peaks(num);
	for (int i = 0; i < num; ++i)
	{
		peaks[i] = std::abs(i - maxIndx) * ((float*)hist.data)[i];
	}
	int secondMaxIndx;
	cv::minMaxIdx(peaks, &minvv, &maxvv, &minIndx, &secondMaxIndx);

	float lowv, highv;
	float edge_step = (high - low) / hBins;
	if (0 == maxIndx)
	{
		lowv = low;
		highv = low + edge_step;
	}
	else if (hBins - 1 == maxIndx)
	{
		lowv = high - edge_step;
		highv = high;
	}
	else
	{
		lowv = low + maxIndx * edge_step;
		highv = lowv + edge_step;
	}

	float lowv1, highv1;
	if (0 == secondMaxIndx)
	{
		lowv1 = low;
		highv1 = low + edge_step;
	}
	else if (hBins - 1 == secondMaxIndx)
	{
		lowv1 = high - edge_step;
		highv1 = high;
	}
	else
	{
		lowv1 = low + maxIndx * edge_step;
		highv1 = lowv + edge_step;
	}

	// 两个波峰对应的值
	float lowPeak, highPeak;

	if (lowv < lowv1) { lowPeak= lowv; }
	else { lowPeak= lowv1; }
	if (highv1 > highv) { highPeak= highv1; }
	else { highPeak= highv; }

	for (size_t i = 0; i < allNum; ++i)
	{
		float& z = ((float*)data)[i];
		if (z < v1) { z = minValue; }
		if (z > v2) { z = maxValue; }
	}

	cv::Mat gray;
	cv::normalize(d, gray, 0, 255, cv::NORM_MINMAX, CV_8UC1);
	return gray;
	}
实现2
写完第一版代码才发现,搞那么复杂干嘛,又是直方图统计,又是找波峰的。深度图转灰度图突出显示感兴趣的特征,本质上不就是只把感兴趣的特征对应的深度信息保留下来,而其他干扰信息全部赋值无效数据吗。
第二版就补贴代码了。
