一、pyecharts基础
1、概述
Pyecharts是一款将python与echarts结合的强大的数据可视化工具。使用 pyecharts 可以生成独立的网页,也可以在 flask , Django 中集成使用。
echarts 是百度开源的一个数据可视化 JS 库,主要用于数据可视化。pyecharts 是一个用于生成
Echarts 图表的类库,实际上就是 Echarts 与 Python 的对接。
2、图表类型
在pyecharts中,根据图表的调用方法、数据源格式的不一样,可大致分为以下几类:
直角坐标系图表:如折线图、柱状图、散点图、箱形图、热力图、K线图等;
地理坐标系图表:如Geo(地理坐标图)、Map(区域地图)、BMap(百度地图)等;
树型图表:如树图、矩形树图等;
3D图表:如3D柱状图、3D折线图、3D曲面图等;
组合图表:如时间线轮播多图、顺序多图、并行多图等;
其他图表:如日历图、漏斗图、仪表盘、饼图、极坐标图、雷达图、旭日图、词云等;
用户自定义的图表:
Grid 类:并行显示多张图
Overlap 类:结合不同类型图表叠加画在同张图上
Page 类:同一网页按顺序展示多图
Timeline 类:提供时间线轮播多张图
3、示例
本文采用的pyechart版本是pyechart==1.7.1。
from pyecharts.charts import Bar, Pie, Line, Scatter, Bar3D, Gauge, Radar, WordCloud
import pyecharts.options as opts
import os
(1)柱状图-Bar
attr = ["Jan", "Feb", "Mar", "Apr", "May", "Jun", "Jul", "Aug", "Sep", "Oct", "Nov", "Dec"]
v1 = [2.0, 4.9, 7.0, 23.2, 25.6, 76.7, 135.6, 162.2, 32.6, 20.0, 6.4, 3.3]
v2 = [2.6, 5.9, 9.0, 26.4, 28.7, 70.7, 175.6, 182.8, 48.7, 18.8, 6.0, 2.3]
bar = Bar()
bar.set_global_opts(title_opts=opts.TitleOpts('柱状图'))
bar.add_xaxis(attr)
# 画平均线,标记最大最小值
bar.add_yaxis("蒸发量",
v1,
markline_opts=opts.MarkLineOpts(data=[opts.MarkLineItem(type_='average', name='平均值')]),
markpoint_opts=opts.MarkPointOpts(data=[opts.MarkPointItem(type_='max', name='最大值'),
opts.MarkPointItem(type_='min', name='最小值')]))
bar.add_xaxis(attr)
# 画平均线,标记最大最小值
bar.add_yaxis("降水量",
v2,
markline_opts=opts.MarkLineOpts(data=[opts.MarkLineItem(type_='average', name='平均值')]),
markpoint_opts=opts.MarkPointOpts(data=[opts.MarkPointItem(type_='max', name='最大值'),
opts.MarkPointItem(type_='min', name='最小值')]))
# bar.reversal_axis() # x 轴和 y 轴交换
bar.render("a.html")
# os.system("a.html")

(2)饼图-Pie
普通饼图
attr = ["衬衫", "羊毛衫", "雪纺衫", "裤子", "高跟鞋", "袜子"]
v1 = [11, 12, 13, 10, 10, 10]
pie = Pie()
pie.set_global_opts(legend_opts=opts.LegendOpts(pos_bottom='bottom'),
title_opts=opts.TitleOpts(title='饼图实例1', pos_left='center', pos_right='center',
title_textstyle_opts=opts.TextStyleOpts(font_size=40)))
pie.add('', [list(z) for z in zip(attr, v1)], label_opts=opts.LabelOpts(is_show=True,formatter='{b} {d}%'))
pie.render('c.html')
# os.system("c.html")
南丁格尔玫瑰图
attr = ["衬衫", "羊毛衫", "雪纺衫", "裤子", "高跟鞋", "袜子"]
v1 = [11, 12, 13, 10, 10, 10]
v2 = [19, 21, 32, 20, 20, 33]
pie = Pie(init_opts=opts.InitOpts(width="900px"))
pie.set_global_opts(legend_opts=opts.LegendOpts(pos_bottom='bottom'),
title_opts=opts.TitleOpts(title='饼图实例2-玫瑰图示例', pos_left='center', pos_right='center',
title_textstyle_opts=opts.TextStyleOpts(font_size=40)))
# center饼图圆心坐标,radius两个半径分别为内外半径
# rosetype为是否展示成南丁格尔图( 'radius' 圆心角展现数据百分比,半径展现数据大小;'area' 圆心角相同,为通过半径展现数据大小)
pie.add('商品A', [list(z) for z in zip(attr, v1)], center=['25%', '50%'], radius=['30%', '50%'], rosetype='radius')
pie.add('商品B', [list(z) for z in zip(attr, v2)], center=['75%', '50%'], radius=['30%', '50%'], rosetype='area',
label_opts=opts.LabelOpts(is_show=True))
# pie.show_config()
pie.render()
# os.system("render.html")
多图排列
pie = Pie()
pie.set_global_opts(title_opts=opts.TitleOpts(title='饼图实例3', subtitle='各类电影中\'好片\'所占的比例', pos_right='center', pos_left='center'),
legend_opts=opts.LegendOpts(is_show=True, pos_bottom='bottom'))

pie.add('', [['剧情', 25], ['', 75]], center=['10%', '30%'], radius=['18%', '24%'], label_opts=opts.LabelOpts(is_show=True, position='center'))
pie.add('', [['奇幻', 24], ['', 76]], center=['30%', '30%'], radius=['18%', '24%'], label_opts=opts.LabelOpts(is_show=True, position='center'))
pie.add('', [['爱情', 14], ['', 86]], center=['50%', '30%'], radius=['18%', '24%'], label_opts=opts.LabelOpts(is_show=True, position='center'))
pie.add('', [['惊悚', 11], ['', 89]], center=['70%', '30%'], radius=['18%', '24%'], label_opts=opts.LabelOpts(is_show=True, position='center'))
pie.add('', [['冒险', 27], ['', 73]], center=['90%', '30%'], radius=['18%', '24%'], label_opts=opts.LabelOpts(is_show=True, position='center'))
pie.add('', [['动作', 15], ['', 85]], center=['10%', '70%'], radius=['18%', '24%'], label_opts=opts.LabelOpts(is_show=True, position='center'))
pie.add('', [['喜剧', 54], ['', 46]], center=['30%', '70%'], radius=['18%', '24%'], label_opts=opts.LabelOpts(is_show=True, position='center'))
pie.add('', [['科幻', 26], ['', 74]], center=['50%', '70%'], radius=['18%', '24%'], label_opts=opts.LabelOpts(is_show=True, position='center'))
pie.add('', [['悬疑', 25], ['', 75]], center=['70%', '70%'], radius=['18%', '24%'], label_opts=opts.LabelOpts(is_show=True,position='center'))
pie.add('', [['犯罪', 28], ['', 72]], center=['90%', '70%'], radius=['18%', '24%'], label_opts=opts.LabelOpts(is_show=True, position='inside'))
pie.set_series_opts(label_opts=opts.LabelOpts(position='inside', formatter='{b} {d}%'))
# pie.show_config()
pie.render()
# os.system("render.html") 
(3)折线图-Line
attr = ["Jan", "Feb", "Mar", "Apr", "May", "Jun", "Jul", "Aug", "Sep", "Oct", "Nov", "Dec"]
v1 = [2.0, 4.9, 7.0, 23.2, 25.6, 76.7, 135.6, 162.2, 32.6, 20.0, 6.4, 3.3]
v2 = [2.6, 5.9, 9.0, 26.4, 28.7, 70.7, 175.6, 182.8, 48.7, 18.8, 6.0, 2.3]
line = Line()

line.add_xaxis(attr)
line.add_yaxis("降水量", v1,label_opts=opts.LabelOpts(is_show=True))
line.add_yaxis("蒸发量", v2, label_opts=opts.LabelOpts(is_show=True))
line.set_global_opts(title_opts=opts.TitleOpts(title='折线图', subtitle='一年的降水量与蒸发量'),
yaxis_opts=opts.AxisOpts(type_='value', splitline_opts=opts.SplitLineOpts(is_show=True)))
line.render()
# os.system("render.html")

(4)散点图-scatter
attr = ["Jan", "Feb", "Mar", "Apr", "May", "Jun", "Jul", "Aug", "Sep", "Oct", "Nov", "Dec"]
v1 = [2.0, 4.9, 7.0, 23.2, 25.6, 76.7, 135.6, 162.2, 32.6, 20.0, 6.4, 3.3]
v2 = [2.6, 5.9, 9.0, 26.4, 28.7, 70.7, 175.6, 182.8, 48.7, 18.8, 6.0, 2.3]
scatter = Scatter()
# xais_name是设置横坐标名称,这里由于显示问题,还需要将y轴名称与y轴的距离进行设置
scatter.add_xaxis(xaxis_data=v1)
scatter.add_yaxis("降水量与蒸发量的散点分布", v2)
scatter.set_global_opts(title_opts=opts.TitleOpts(title='折线图', subtitle='一年的降水量与蒸发量'),
yaxis_opts=opts.AxisOpts(type_='value', name='蒸发量', splitline_opts=opts.SplitLineOpts(is_show=True)),
xaxis_opts=opts.AxisOpts(type_='value', name='降水量', splitline_opts=opts.SplitLineOpts(is_show=True)))
scatter.render()
# os.system("render.html") 
(5)3D 柱状图-Bar3D
bar3d = Bar3D(init_opts=opts.InitOpts(width='1200px', height='600px'))
bar.set_global_opts(title_opts=opts.TitleOpts(title='"3D 柱状图示例"'))
x_axis = ['12a', '1a', '2a', '3a', '4a', '5a', '6a', '7a', '8a', '9a', '10a', '11a',
'12p', '1p', '2p', '3p', '4p', '5p', '6p', '7p', '8p', '9p', '10p', '11p']
y_axis = ["Saturday", "Friday", "Thursday", "Wednesday", "Tuesday", "Monday", "Sunday"]

data = [
[0, 0, 5], [0, 1, 1], [0, 2, 0], [0, 3, 0], [0, 4, 0], [0, 5, 0],
[0, 6, 0], [0, 7, 0], [0, 8, 0], [0, 9, 0], [0, 10, 0], [0, 11, 2],
[0, 12, 4], [0, 13, 1], [0, 14, 1], [0, 15, 3], [0, 16, 4], [0, 17, 6],
[0, 18, 4], [0, 19, 4], [0, 20, 3], [0, 21, 3], [0, 22, 2], [0, 23, 5],
[1, 0, 7], [1, 1, 0], [1, 2, 0], [1, 3, 0], [1, 4, 0], [1, 5, 0],
[1, 6, 0], [1, 7, 0], [1, 8, 0], [1, 9, 0], [1, 10, 5], [1, 11, 2],
[1, 12, 2], [1, 13, 6], [1, 14, 9], [1, 15, 11], [1, 16, 6], [1, 17, 7],
[1, 18, 8], [1, 19, 12], [1, 20, 5], [1, 21, 5], [1, 22, 7], [1, 23, 2],
[2, 0, 1], [2, 1, 1], [2, 2, 0], [2, 3, 0], [2, 4, 0], [2, 5, 0],
[2, 6, 0], [2, 7, 0], [2, 8, 0], [2, 9, 0], [2, 10, 3], [2, 11, 2],
[2, 12, 1], [2, 13, 9], [2, 14, 8], [2, 15, 10], [2, 16, 6], [2, 17, 5],
[2, 18, 5], [2, 19, 5], [2, 20, 7], [2, 21, 4], [2, 22, 2], [2, 23, 4],
[3, 0, 7], [3, 1, 3], [3, 2, 0], [3, 3, 0], [3, 4, 0], [3, 5, 0],
[3, 6, 0], [3, 7, 0], [3, 8, 1], [3, 9, 0], [3, 10, 5], [3, 11, 4],
[3, 12, 7], [3, 13, 14], [3, 14, 13], [3, 15, 12], [3, 16, 9], [3, 17, 5],
[3, 18, 5], [3, 19, 10], [3, 20, 6], [3, 21, 4], [3, 22, 4], [3, 23, 1],
[4, 0, 1], [4, 1, 3], [4, 2, 0], [4, 3, 0], [4, 4, 0], [4, 5, 1],
[4, 6, 0], [4, 7, 0], [4, 8, 0], [4, 9, 2], [4, 10, 4], [4, 11, 4],
[4, 12, 2], [4, 13, 4], [4, 14, 4], [4, 15, 14], [4, 16, 12], [4, 17, 1],
[4, 18, 8], [4, 19, 5], [4, 20, 3], [4, 21, 7], [4, 22, 3], [4, 23, 0],
[5, 0, 2], [5, 1, 1], [5, 2, 0], [5, 3, 3], [5, 4, 0], [5, 5, 0],
[5, 6, 0], [5, 7, 0], [5, 8, 2], [5, 9, 0], [5, 10, 4], [5, 11, 1],
[5, 12, 5], [5, 13, 10], [5, 14, 5], [5, 15, 7], [5, 16, 11], [5, 17, 6],
[5, 18, 0], [5, 19, 5], [5, 20, 3], [5, 21, 4], [5, 22, 2], [5, 23, 0],
[6, 0, 1], [6, 1, 0], [6, 2, 0], [6, 3, 0], [6, 4, 0], [6, 5, 0],
[6, 6, 0], [6, 7, 0], [6, 8, 0], [6, 9, 0], [6, 10, 1], [6, 11, 0],
[6, 12, 2], [6, 13, 1], [6, 14, 3], [6, 15, 4], [6, 16, 0], [6, 17, 0],
[6, 18, 0], [6, 19, 0], [6, 20, 1], [6, 21, 2], [6, 22, 2], [6, 23, 6]
]
range_color = ['#313695', '#4575b4', '#74add1', '#abd9e9', '#e0f3f8', '#ffffbf',
'#fee090', '#fdae61', '#f46d43', '#d73027', '#a50026']
bar3d.add('',
[[d[1], d[0], d[2]] for d in data],
xaxis3d_opts=opts.Axis3DOpts(data=x_axis,type_='category'),
yaxis3d_opts=opts.Axis3DOpts(data=y_axis,type_='category'),
zaxis3d_opts=opts.Axis3DOpts(data=data, type_='value'),
grid3d_opts=opts.Grid3DOpts(width=200, depth=80))
bar3d.set_global_opts(visualmap_opts=opts.VisualMapOpts(range_color=range_color, max_=20))
bar3d.render()
# os.system('render.html') 
(6)仪表盘-Gauge
gauge = Gauge()
gauge.set_global_opts(title_opts=opts.TitleOpts(title='仪表盘示例'))
gauge.add('业务指标', [('完成率', 30)])
# a = input('输入路径:')
# gauge.render(a)
# os.system(a)
gauge.render()
# os.system('render.html')
(7)雷达图-Radar
radar = Radar()
radar.set_global_opts(title_opts=opts.TitleOpts(title='雷达图',subtitle='一年的降水量与蒸发量'))
# 由于雷达图传入的数据得为多维数据,所以这里需要做一下处理
radar_v1 = [[2.0, 4.9, 7.0, 23.2, 25.6, 76.7, 135.6, 162.2, 32.6, 20.0, 6.4, 3.3]]
radar_v2 = [[2.6, 5.9, 9.0, 26.4, 28.7, 70.7, 175.6, 182.2, 48.7, 18.8, 6.0, 2.3]]
# 设置column的最大值,为了雷达图更为直观,这里的月份最大值设置有所不同
# 传入坐标
radar.add_schema(schema=[
opts.RadarIndicatorItem(name='Jan', max_=5),
opts.RadarIndicatorItem(name='Feb', max_=10),
opts.RadarIndicatorItem(name='Mar', max_=10),
opts.RadarIndicatorItem(name='Apr', max_=50),
opts.RadarIndicatorItem(name='May', max_=50),
opts.RadarIndicatorItem(name='Jun', max_=200),
opts.RadarIndicatorItem(name='Jul', max_=200),
opts.RadarIndicatorItem(name='Aug', max_=200),
opts.RadarIndicatorItem(name='Sep', max_=50),
opts.RadarIndicatorItem(name='Oct', max_=50),
opts.RadarIndicatorItem(name='Nov', max_=10),
opts.RadarIndicatorItem(name='Dec', max_=5)
])
radar.add("降水量", radar_v1)
# 一般默认为同一种颜色,这里为了便于区分,需要设置item的颜色
radar.add("蒸发量", radar_v2, linestyle_opts=opts.LineStyleOpts(color="#1C86EE"))
radar.set_series_opts(label_opts=opts.LabelOpts(is_show=False))
radar.render()
os.system("render.html")
(8)词云图-WordCloud
from pyecharts.charts import WordCloud
import os

name = ['Sam S Club', 'Macys', 'Amy Schumer', 'Jurassic World', 'Charter Communications', 'Chick Fil A',
'Planet Fitness', 'Pitch Perfect', 'Express', 'Home', 'Johnny Depp', 'Lena Dunham', 'Lewis Hamilton', 'KXAN',
'Mary Ellen Mark', 'Farrah Abraham', 'Rita Ora', 'Serena Williams', 'NCAA baseball tournament', 'Point Break']
value = [10000, 6181, 4386, 4055, 2467, 2244, 1898, 1484, 1112, 965, 847, 582, 555, 550, 462, 366, 360, 282, 273, 265]
wordcloud = WordCloud(init_opts=opts.InitOpts(width='1300px', height='620px'))
wordcloud.add("", [list(z) for z in zip(name, value)], word_size_range=[20, 100],
shape='diamond') # shape词云图轮廓,有'circle', 'cardioid', 'diamond', 'triangle-forward', 'triangle', 'pentagon', 'star'可选
wordcloud.render()
os.system("render.html")
(9)地理坐标系-Geo
from pyecharts.charts import Geo
import os

data = [
("海门", 9), ("鄂尔多斯", 12), ("招远", 12), ("舟山", 12), ("齐齐哈尔", 14), ("盐城", 15),
("赤峰", 16), ("青岛", 18), ("乳山", 18), ("金昌", 19), ("泉州", 21), ("莱西", 21),
("日照", 21), ("胶南", 22), ("南通", 23), ("拉萨", 24), ("云浮", 24), ("梅州", 25),
("文登", 25), ("上海", 25), ("攀枝花", 25), ("威海", 25), ("承德", 25), ("厦门", 26),
("汕尾", 26), ("潮州", 26), ("丹东", 27), ("太仓", 27), ("曲靖", 27), ("烟台", 28),
("福州", 29), ("瓦房店", 30), ("即墨", 30), ("抚顺", 31), ("玉溪", 31), ("张家口", 31),
("阳泉", 31), ("莱州", 32), ("湖州", 32), ("汕头", 32), ("昆山", 33), ("宁波", 33),
("湛江", 33), ("揭阳", 34), ("荣成", 34), ("连云港", 35), ("葫芦岛", 35), ("常熟", 36),
("东莞", 36), ("河源", 36), ("淮安", 36), ("泰州", 36), ("南宁", 37), ("营口", 37),
("惠州", 37), ("江阴", 37), ("蓬莱", 37), ("韶关", 38), ("嘉峪关", 38), ("广州", 38),
("延安", 38), ("太原", 39), ("清远", 39), ("中山", 39), ("昆明", 39), ("寿光", 40),
("盘锦", 40), ("长治", 41), ("深圳", 41), ("珠海", 42), ("宿迁", 43), ("咸阳", 43),
("铜川", 44), ("平度", 44), ("佛山", 44), ("海口", 44), ("江门", 45), ("章丘", 45),
("肇庆", 46), ("大连", 47), ("临汾", 47), ("吴江", 47), ("石嘴山", 49), ("沈阳", 50),
("苏州", 50), ("茂名", 50), ("嘉兴", 51), ("长春", 51), ("胶州", 52), ("银川", 52),
("张家港", 52), ("三门峡", 53), ("锦州", 54), ("南昌", 54), ("柳州", 54), ("三亚", 54),
("自贡", 56), ("吉林", 56), ("阳江", 57), ("泸州", 57), ("西宁", 57), ("宜宾", 58),
("呼和浩特", 58), ("成都", 58), ("大同", 58), ("镇江", 59), ("桂林", 59), ("张家界", 59),
("宜兴", 59), ("北海", 60), ("西安", 61), ("金坛", 62), ("东营", 62), ("牡丹江", 63),
("遵义", 63), ("绍兴", 63), ("扬州", 64), ("常州", 64), ("潍坊", 65), ("重庆", 66),
("台州", 67), ("南京", 67), ("滨州", 70), ("贵阳", 71), ("无锡", 71), ("本溪", 71),
("克拉玛依", 72), ("渭南", 72), ("马鞍山", 72), ("宝鸡", 72), ("焦作", 75), ("句容", 75),
("北京", 79), ("徐州", 79), ("衡水", 80), ("包头", 80), ("绵阳", 80), ("乌鲁木齐", 84),
("枣庄", 84), ("杭州", 84), ("淄博", 85), ("鞍山", 86), ("溧阳", 86), ("库尔勒", 86),
("安阳", 90), ("开封", 90), ("济南", 92), ("德阳", 93), ("温州", 95), ("九江", 96),
("邯郸", 98), ("临安", 99), ("兰州", 99), ("沧州", 100), ("临沂", 103), ("南充", 104),
("天津", 105), ("富阳", 106), ("泰安", 112), ("诸暨", 112), ("郑州", 113), ("哈尔滨", 114),
("聊城", 116), ("芜湖", 117), ("唐山", 119), ("平顶山", 119), ("邢台", 119), ("德州", 120),
("济宁", 120), ("荆州", 127), ("宜昌", 130), ("义乌", 132), ("丽水", 133), ("洛阳", 134),
("秦皇岛", 136), ("株洲", 143), ("石家庄", 147), ("莱芜", 148), ("常德", 152), ("保定", 153),
("湘潭", 154), ("金华", 157), ("岳阳", 169), ("长沙", 175), ("衢州", 177), ("廊坊", 193),
("菏泽", 194), ("合肥", 229), ("武汉", 273), ("大庆", 279)]

geo = Geo(init_opts=opts.InitOpts(width='1200px', height='600px',bg_color='#404a59'))
geo.add_schema(maptype='china',
itemstyle_opts=opts.ItemStyleOpts(color="#28527a", # 背景颜色
border_color="#9ba4b4"))
geo.add("", data, symbol_size=15, label_opts=opts.LabelOpts(is_show=False))
geo.set_global_opts(title_opts=opts.TitleOpts(pos_left='center', title="全国主要城市空气质量", subtitle="data from pm2.5",
title_textstyle_opts=opts.TextStyleOpts(color='#fff')),
visualmap_opts=opts.VisualMapOpts(range_size=[0, 200],
textstyle_opts=opts.TextStyleOpts(color='#fff')))
geo.render()
os.system("render.html")

from pyecharts.charts import Geo
import os

geo = Geo(init_opts=opts.InitOpts(width='1200px', height='600px',bg_color='#404a59'))
geo.add_schema(maptype='china',
itemstyle_opts=opts.ItemStyleOpts(color="#28527a", # 背景颜色
border_color="#9ba4b4"))
geo.add("", data, symbol_size=15, label_opts=opts.LabelOpts(is_show=False))
geo.set_global_opts(title_opts=opts.TitleOpts(pos_left='center', title="全国主要空气质量", subtitle="data from pm2.5",
title_textstyle_opts=opts.TextStyleOpts(color='#fff')),
visualmap_opts=opts.VisualMapOpts(range_size=[0, 200],
textstyle_opts=opts.TextStyleOpts(color='#fff')))
geo.render()
os.system("d.html")
(10)地图-Map
from pyecharts.charts import Map
import os

data = [('北京市', 12.54), ('天津市', 13.02), ('河北省', 13.0), ('山西省', 11.53), ('辽宁省', 15.43),
('吉林省', 13.21), ('黑龙江省', 13.03), ('上海市', 15.07), ('江苏省', 15.99), ('浙江省', 13.89), ('安徽省', 15.01),
('福建省', 11.42), ('江西省', 11.44), ('山东省', 14.75), ('河南省', 12.73), ('湖北省', 13.93), ('湖南省', 14.54),
('广东省', 9.73), ('广西省', 13.12), ('海南省', 11.33), ('重庆市', 17.42), ('四川省', 16.3), ('贵州省', 12.84), ('云南省', 11.06),
('陕西省', 12.85), ('甘肃省', 12.44), ('青海省', 9.45)]

map = Map(init_opts=opts.InitOpts(width='1200px', height='600px'))
map.add("", data, maptype='china', label_opts=opts.LabelOpts(is_show=False))
map.set_global_opts(title_opts=opts.TitleOpts("全国地图示例"),
visualmap_opts=opts.VisualMapOpts(max_=50))
map.render()
os.system("render.html")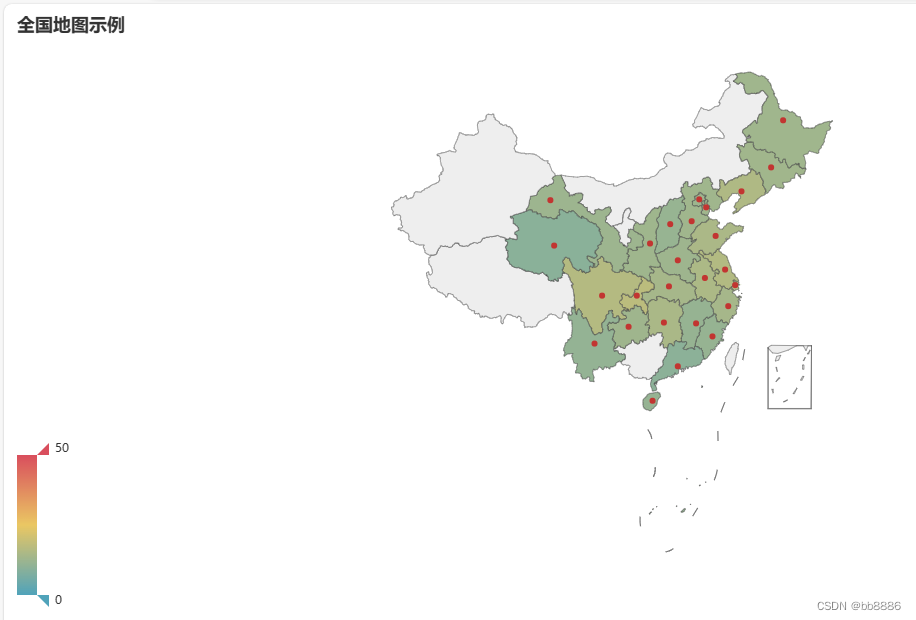
二、pyecharts实战
1、画图小练习
pyechart练习(一):画图小练习_bb8886的博客-CSDN博客
2、星巴克门店分布
pyechart练习二:星巴克门店分布-CSDN博客
3、黑色星期五用户画像
pyechart练习三:黑色星期五用户画像_bb8886的博客-CSDN博客
三、pyecharts与matplotlib区别
1)pyechart更适用于做一些高大上的图,比如地图、地域分布、热点图、热力图等;而matplotlib更加适合于做一些常用的图,如折线图、柱状图、散点图等。
2)pyechart主要可以做交互式的图,前者风格偏向数据工程demo展示;matplotlib主要可以做静态图,风格偏向学术。






![buuctf crypto 【[GUET-CTF2019]BabyRSA】解题记录](https://img-blog.csdnimg.cn/dbdd52057d8e471396bf656582404e6d.png)




![[libc-2.31 off_by_null] N0wayBack ezheap练习](https://img-blog.csdnimg.cn/18c2e9f5c29c4ea1b197cf08bb39bf19.png)