1、介绍
Chartjs简约不简单的JavaScript的图表库。官网![]() https://chart.nodejs.cn/
https://chart.nodejs.cn/
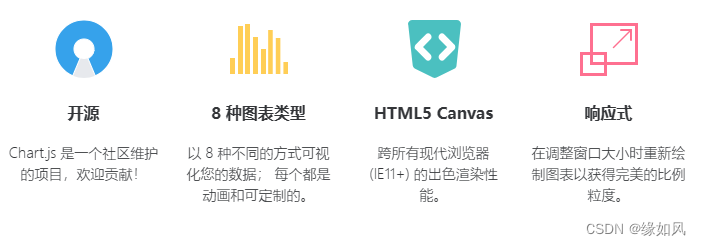
Chart.js 带有内置的 TypeScript 类型,并与所有流行的 JavaScript 框架 兼容,包括 React 、Vue 、Svelte 和 Angular 。 你可以直接使用 Chart.js 或利用维护良好的封装程序包,以便与你选择的框架进行更原生的集成。
集成的相关
集成 | Chart.js 中文网
Vue中集成
GitHub - apertureless/vue-chartjs: 📊 Vue.js wrapper for Chart.js
以下是利用vue中集成使用
2、安装
pnpm add vue-chartjs chart.js
# or
yarn add vue-chartjs chart.js
# or
npm i vue-chartjs chart.js
3、实现Bar
<template>
  <div class="barClass" style="width:400px, height:400px">
    <Bar   :data="data" :options="options"></Bar>
  </div>
</template>

<script setup>

import {
  Chart as ChartJS,
  Title,
  Tooltip,
  Legend,
  BarElement,
  CategoryScale,
  LinearScale,
  LineElement
} from 'chart.js'

ChartJS.register(CategoryScale, LinearScale, BarElement, LineElement,Title, Tooltip, Legend)

import { Bar } from 'vue-chartjs'

const data = {
  labels: ['January', 'February', 'March'],
  datasets: [{
    data: [40, 20, 12],
    label: 'Data One',
    backgroundColor: '#f87979',
  },
  {
    data: [4, 30, 22],
    label: 'Data Two',
    backgroundColor: '#007900',
  }
]
};

const options = {
  responsive: true
}

</script>

<style>

.barClass
{
  width: 600px;
  height: 400px;
  background-color: aqua;
}

</style>


![[管理与领导-75]:IT基层管理者 - 辅助技能 - 4- 乌卡时代(VUCA )的职业规划](https://img-blog.csdnimg.cn/a40cb2123dd44bff8c2fafa39ee8a3bf.png)