目录
1.算法流程简介
2.算法核心代码
3.算法效果展示
1.算法流程简介
"""
本节算法是梯度下降方法的小批量随机梯度下降法,算法的思路是从数中随机取出n个数据进行数梯度下降,再进行相应的迭代,
最后能够获得一个效果不错的回归方程/最优解.
算法的公式就不多说了,其实和普通的递归下降方法没有什么区别,公式也差不多,只有一点点改变和需要注意的地方.
"""
"""
1.读取数据集并且化为对应的xy数组
2.设置梯度下降的一些常见的参数,唯一需要额外设置的就是取多少个小批量样本
3.设置随机函数,进行随机梯度下降,不断地更新修正theta值
4.迭代到设定格式后,得到最终结果
5.绘制每个迭代值的回归效果图
"""
"""
PS:说实话,小批量随机递归下降还是比较不稳定的,如果真正想要获得比较精确的解,
我们还是需要将迭代次数尽可能多一些同时随机取出的数据点也要多一点,这样才能获得比较精确一些的解
"""
2.算法核心代码
import numpy as np
import pandas as pd
import matplotlib.pyplot as plt
# 样本数据
path="C:\\Users\\Zeng Zhong Yan\\Desktop\\py.vs\\.vscode\\数学建模\\梯度下降法材料包\\LinearRegression.xlsx"
# 读取excel文件
dataframe = pd.read_excel(path,  header=0)
data=np.array(dataframe)
X=data[:,0].reshape(-1,1)
y=data[:,1]
X_bias = np.insert(X, 0, 1, axis=1)
learning_rate = 0.01
batch_size = 128  # 小批量大小
theta = np.ones(X_bias.shape[1])  # 包括截距和特征系数
#小批量递归下降
num1 =[0,2,10,50,100,500,1000]
global num_iterations
 # 包括截距和特征系数
plt.figure(figsize=(24,8))
plt.subplot(2,4,1)
plt.scatter(X,y,color='blue',s=1)
fig1=plt.plot(X,y,'.',color='blue',label='Iris Data')
plt.legend(loc=3, borderaxespad=0., bbox_to_anchor=(0.01, 0.85))
for i in range(len(num1)):
    num_iterations=num1[i]
    theta = np.zeros(X_bias.shape[1])
    X_bias = np.insert(X, 0, 1, axis=1)
    for _ in range(num_iterations):
    # 随机选择一个小批量样本
      batch_indices = np.random.choice(len(X_bias), batch_size, replace=False)
      X_batch = X_bias[batch_indices]
      y_batch = y[batch_indices]
      gradient = X_batch.T.dot(X_batch.dot(theta) - y_batch) / len(X_batch)
      theta -= learning_rate * gradient
    plt.subplot(2,4,i+2)
    plt.scatter(X,y,color='blue',s=1)
    Y=theta[1]*X+theta[0]
    plt.plot(X,Y,color='r')
    plt.xlabel("X")
    plt.ylabel("Y")
    fig3=plt.plot(X,Y,'white',label="iterations={}".format(num_iterations))
    fig1=plt.plot(X,y,'.',color='blue',label='Iris Data')
    fig2=plt.plot(X,Y,'r',label='Regression Curve')
    plt.legend(loc=3, borderaxespad=0., bbox_to_anchor=(0.01, 0.75))
plt.savefig('C:\\Users\\Zeng Zhong Yan\\Desktop\\py.vs\\.vscode\\数学建模\\梯度下降法材料包\\梯度下降法效果图.png', dpi=500, bbox_inches='tight')
plt.show()
3.算法效果展示
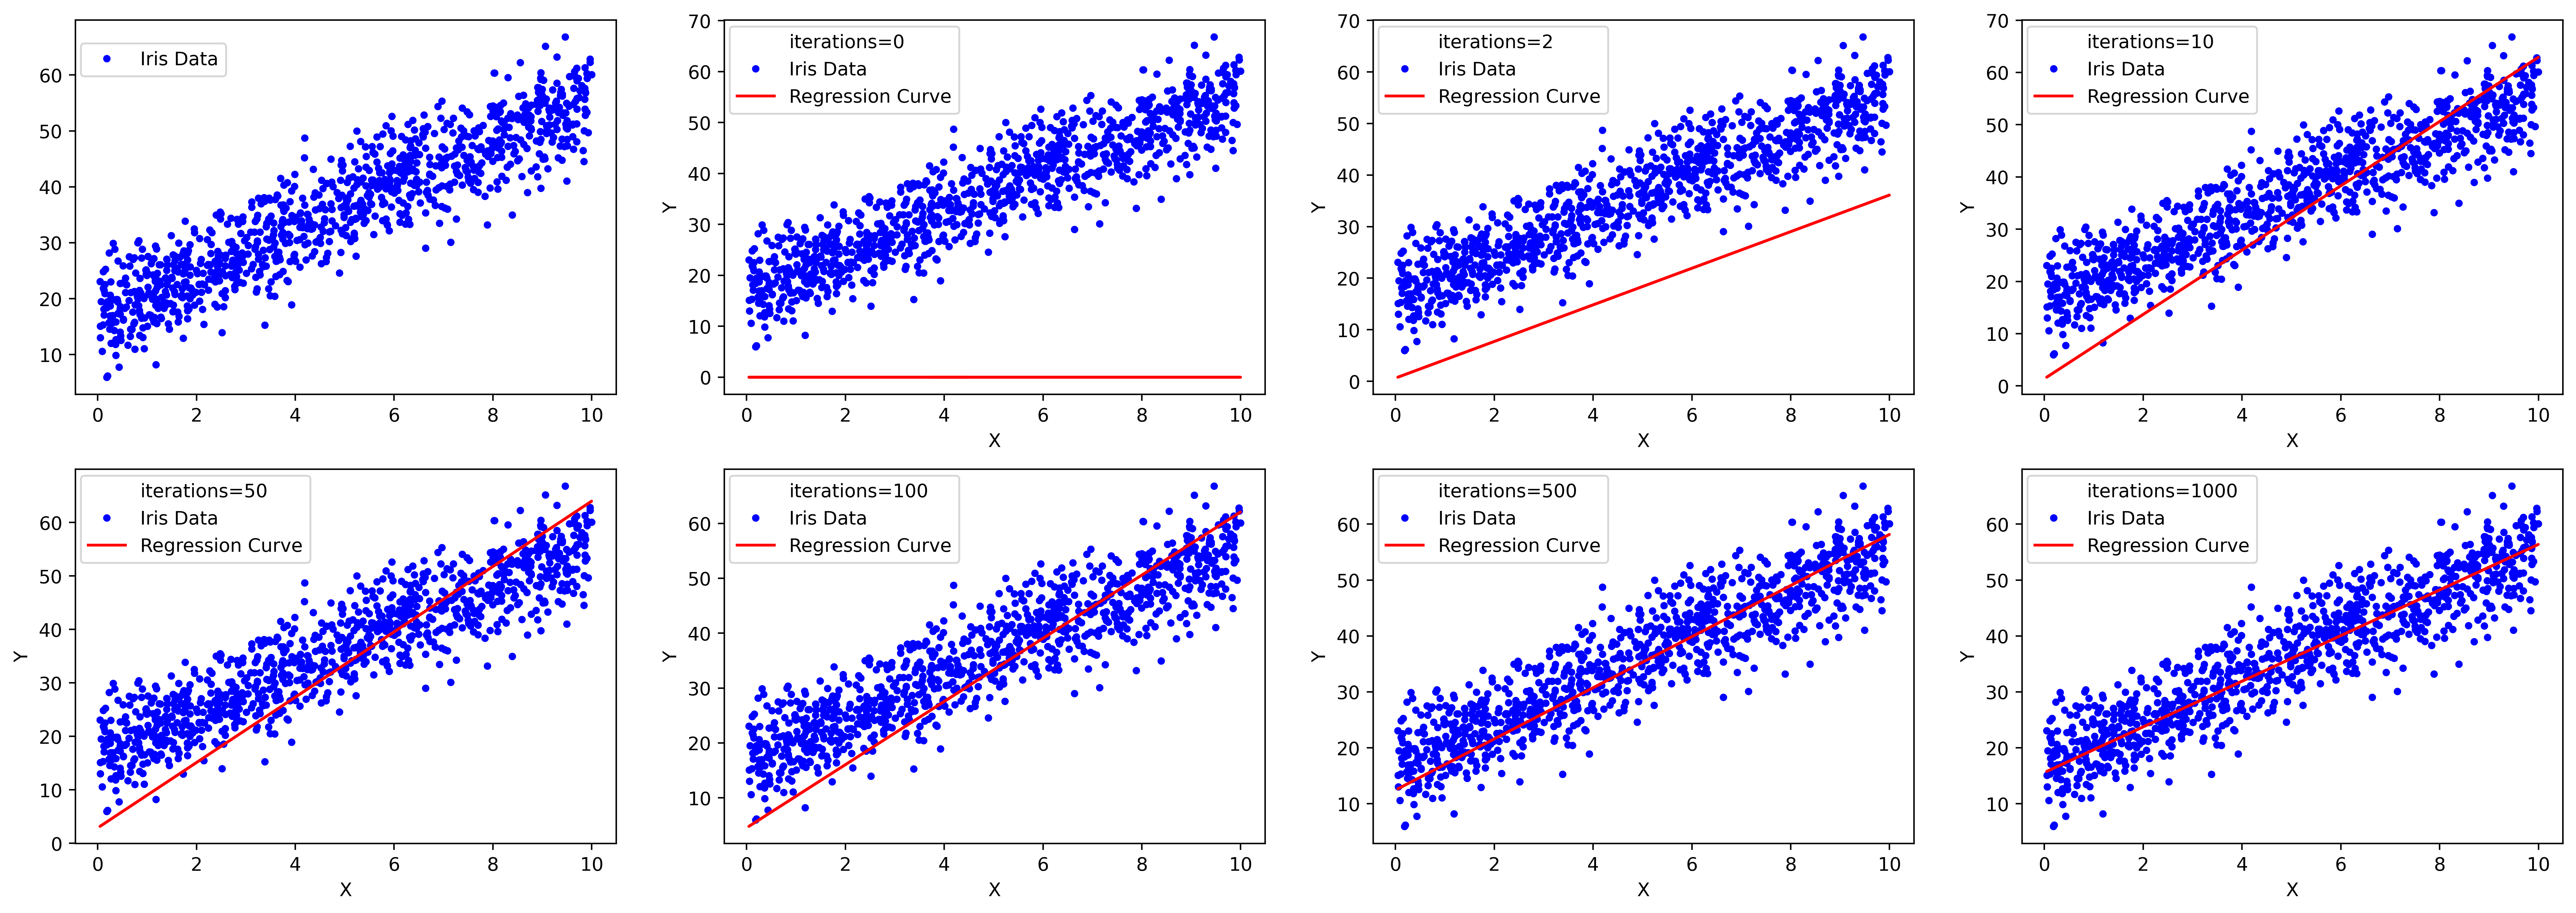





![java八股文面试[数据库]——主键的类型自增还是UUID](https://img-blog.csdnimg.cn/img_convert/c249e02565b738f775a8f48e5cd02d03.png)
