1. 安装 cytoscape
npm install cytoscape
2. 使用
import React, { useEffect, useRef, useState } from "react";
import cytoscape from "cytoscape";

const peopleList = [
  {
    "data": {
      "id": "1",
      "label": "我"
    },
    "position": {
      "x": 100,
      "y": 100
    },
    "style": {
      "shape": "rectangle",
      "backgroundColor": "#dfacde",
      "color": "#ff0abc",
      "borderColor": "red",
      "borderWidth": 2,
      "fontSize": "25px"
    }
  },
  {
    "data": {
      "id": "2",
      "label": "父亲"
    },
    "position": {
      "x": 100,
      "y": 200
    },
    "style": {
      "shape": "rectangle"
    }
  },
  {
    "data": {
      "id": "3",
      "label": "母亲"
    },
    "position": {
      "x": 200,
      "y": 100
    },
    "style": {
      "shape": "ellipse",
      "borderColor": "#000",
      "borderWidth": 5
    }
  },
  {
    "data": {
      "id": "4",
      "label": "姐姐"
    },
    "position": {
      "x": 130,
      "y": 130
    },
    "style": {
      "shape": "ellipse",
      "color": "#ffa500",
      "backgroundImage": "url(http://localhost:8088/11.png)"
    }
  }
]
const relations = [
  {
    "data": {
      "id": "1-2",
      "source": "1",
      "target": "2",
      "label": "父子关系"
    },
    "style": {
      "width": 5,
      "color": null
    }
  },
  {
    "data": {
      "id": "1-3",
      "source": "1",
      "target": "3",
      "label": "母子关系",
      "lineType": "dashed"
    },
    "style": {
      "width": 2,
      "color": null,
      "lineStyle": "dashed"
    }
  },
  {
    "data": {
      "id": "1-4",
      "source": "1",
      "target": "4",
      "label": "姐弟关系",
      "lineType": "zigzag"
    },
    "style": {
      "width": 2,
      "color": null,
      "lineStyle": "zigzag"
    }
  },
  {
    "data": {
      "id": "2-3",
      "source": "2",
      "target": "3",
      "label": "夫妻关系",
      "lineType": "dotted"
    },
    "style": {
      "width": 2,
      "color": null,
      "lineStyle": "dotted",
      "lineColor": "#ffabbb"
    }
  },
  {
    "data": {
      "id": "2-4",
      "source": "2",
      "target": "4",
      "label": "父女关系",
      "lineType": "sinewave"
    },
    "style": {
      "width": 2,
      "color": "#fafbcd",
      "lineStyle": "sinewave"
    }
  },
  {
    "data": {
      "id": "3-4",
      "source": "3",
      "target": "4",
      "label": "母女关系",
      "lineType": "segment"
    },
    "style": {
      "width": 2,
      "color": "#ff0000",
      "lineStyle": "segment"
    }
  }
]

interface ElementItem {
  nodes: any[];
  edges: any[];
}

export default function Graph() {
  const cyRef = useRef<HTMLDivElement>(null);

  const [elements, setElements] = useState<ElementItem>();

  useEffect(() => {
    getGraphData();
  }, []);

  useEffect(() => {
    if (elements) {
      drawGraph();
    }
  }, [elements])

  async function getGraphData() {
    setElements({
      nodes: peopleList,
      edges: relations,
    });
  }

  function drawGraph() {
    if (cyRef.current) {
      const cy = cytoscape({
        container: cyRef.current,
        elements,
        style: [
          {
            selector: "node",
            style: {
              "background-fit": "cover cover",
              label: "data(label)",
              'text-halign': 'center',
              'text-valign': 'center',
              width: 'label' + 10,
              height: 'label' + 10,
              'font-size': '10px',
              "text-wrap": "wrap",
              "text-max-width": 100,
            },
          },
          {
            selector: "edge",
            style: {
              'line-color': '#333',
              'target-arrow-color': '#333',
              label: 'data(label)',
              "control-point-step-size": 20,
              'control-point-distances': [-3, 3, -3, 3, -3, 3, -3, 3, -3, 3, -3, 3, -3, 3, -3, 3, -3, 3, -3],
              'control-point-weights': [0.05, 0.1, 0.15, 0.2, 0.25, 0.3, 0.35, 0.4, 0.45, 0.5, 0.55,
                0.6, 0.65, 0.7, 0.75, 0.8, 0.85, 0.9, 0.95],
              'curve-style': (edge: any) => {
                switch (edge.data('lineType')) {
                  case 'sinewave':
                    return 'unbundled-bezier';
                  case 'zigzag':
                    return 'segments'
                  default:
                    return 'bezier';
                }
              },
              'segment-distances': [-3, 3, -3, 3, -3, 3, -3, 3, -3, 3, -3, 3, -3, 3, -3, 3, -3, 3, -3],
              'segment-weights': [0.05, 0.1, 0.15, 0.2, 0.25, 0.3, 0.35, 0.4, 0.45, 0.5, 0.55,
                0.6, 0.65, 0.7, 0.75, 0.8, 0.85, 0.9, 0.95],
              'font-size': '8px',
            },
          },

        ],
        layout: {
          name: "preset",
        },
      });

      cy.fit();
    }
  }

  return <div ref={cyRef} style={{ height: '100%', width: '100%' }} />
};
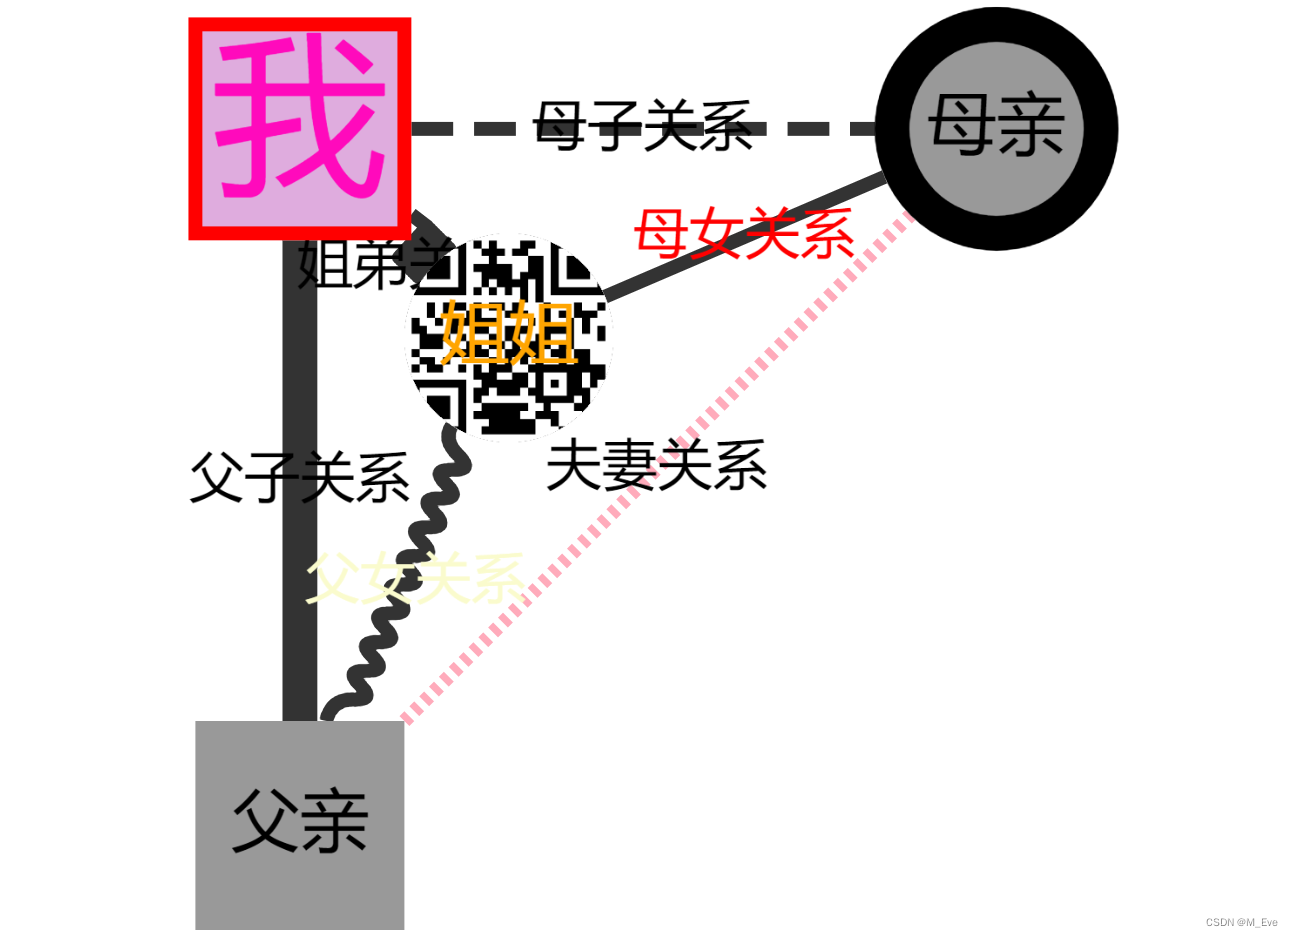
3. 运行效果图
