47 服务监控介绍
- 什么是服务监控
监视当前系统应用状态、内存、线程、堆栈、日志等等相关信息,主要目的在服务出现问题或者快要出现问题时能够准确快速地发现以减小影响范围。
- 为什么要使用服务监控
服务监控在微服务改造过程中的重要性不言而喻,没有强大的监控能力,改造微服务架构后,就无法掌控各个不同服务(多个)的情况,在遇到调用失败时,如果不能快速发现系统的问题,对于业务来说就是一场灾难。
- spring boot actuator 服务监控接口
actuator是监控系统健康情况的工具。
- spring boot admin 服务监控管理
Spring Boot Admin是一个针对spring-boot的actuator接口进行UI美化封装的监控工具。他可以:在列表中浏览所有被监控spring-boot项目的基本信息,详细的Health信息、内存信息、JVM信息、垃圾回收信息、各种配置信息(比如数据源、缓存列表和命中率)等,还可以直接修改logger的level。
48 服务监控使用
1、添加依赖
<!-- SpringBoot Web,支持使用启动类(Application.java)启动微服务 -->
<dependency>
	<groupId>org.springframework.boot</groupId>
	<artifactId>spring-boot-starter-web</artifactId>
</dependency>

<!--
     SpringBoot Actuator , actuator是监控系统健康情况的工具。
     有一系列的接口,我们可以直接用。
-->
<dependency>
	<groupId>org.springframework.boot</groupId>
	<artifactId>spring-boot-starter-actuator</artifactId>
</dependency>2、在application.yml配置暴露所有监控端点
server:
  port: 9100
spring:
  application:
    name: ruoyi-admin-web

# 其实不配置也没有问题。
# 如果不配置,就默提供(暴露)少许的几个接口给外部。
# 根据实际情况决定要不要配置。
# 一般情况下我们会使用以下配置暴露所有的接口。这样的话,他提供的所有的接口啊,都会被我们发现。
management:
  endpoints:
    web:
      exposure:
        include: '*'
3、监控启动类
@SpringBootApplication
public class RuoYiMonitorApplication
{
    public static void main(String[] args)
    {
        SpringApplication.run(RuoYiMonitorApplication.class, args);
        System.out.println("(♥◠‿◠)ノ゙  监控中心启动成功   ლ(´ڡ`ლ)゙  \n" +
                " .-------.       ____     __        \n" +
                " |  _ _   \\      \\   \\   /  /    \n" +
                " | ( ' )  |       \\  _. /  '       \n" +
                " |(_ o _) /        _( )_ .'         \n" +
                " | (_,_).' __  ___(_ o _)'          \n" +
                " |  |\\ \\  |  ||   |(_,_)'         \n" +
                " |  | \\ `'   /|   `-'  /           \n" +
                " |  |  \\    /  \\      /           \n" +
                " ''-'   `'-'    `-..-'              ");
    }
}
4、测试验证
- 重启后端
- 启动后访问
http://localhost:9100/actuator,返回正确数据表示测试通过。
暴露少许几个: 暴露所有:
暴露所有:
49 服务监控端点分类
浏览器访问localhost:9100/actuator时,页面中显示的是很多各种可以访问的地址组成的json字符串:
| 地址 | 描述 |
|---|---|
| /beans | 显示所有注册到spring容器中的Spring bean的列表 |
| /caches | 显示所有的缓存相关信息。spring boot提供的缓存注解,有兴趣的可以试一下。 |
| /scheduledtasks | 显示所有的定时任务相关信息。 |
| /loggers | 显示所有的日志相关信息。可以看到所有的包的日志的级别,都可以显示出来。 |
| /configprops | 显示所有的配置信息。比如在application.yml中配置的端口9100,可以使用 Ctrl+F 搜索出来。 |
| /env | 显示所有的环境变量信息。比如Ant的信息、jdk的信息。 |
| /mappings | 显示所有控制器相关信息。控制器:定义的访问接口 |
| /info | 显示自定义用户信息配置。注意:/info需要自己去定义,否则会显示空(null)。如下图所示: |
| /metrics | 显示应用指标相关信息。如jvm的相关参数、tomcat的相关参数、http的相关参数。 |
| /health | 显示健康检查状态信息,up表示成功 down表示失败。 |
| /threaddump | 显示程序线程的信息。因为程序里边有很多线程。 |
{
    "_links": {
        "self": {
            "href": "http://localhost:9100/actuator",
            "templated": false
        },
        "beans": {
            "href": "http://localhost:9100/actuator/beans",
            "templated": false
        },
        "caches-cache": {
            "href": "http://localhost:9100/actuator/caches/{cache}",
            "templated": true
        },
        "caches": {
            "href": "http://localhost:9100/actuator/caches",
            "templated": false
        },
        "health": {
            "href": "http://localhost:9100/actuator/health",
            "templated": false
        },
        "health-path": {
            "href": "http://localhost:9100/actuator/health/{*path}",
            "templated": true
        },
        "info": {
            "href": "http://localhost:9100/actuator/info",
            "templated": false
        },
        "conditions": {
            "href": "http://localhost:9100/actuator/conditions",
            "templated": false
        },
        "configprops": {
            "href": "http://localhost:9100/actuator/configprops",
            "templated": false
        },
        "configprops-prefix": {
            "href": "http://localhost:9100/actuator/configprops/{prefix}",
            "templated": true
        },
        "env": {
            "href": "http://localhost:9100/actuator/env",
            "templated": false
        },
        "env-toMatch": {
            "href": "http://localhost:9100/actuator/env/{toMatch}",
            "templated": true
        },
        "loggers": {
            "href": "http://localhost:9100/actuator/loggers",
            "templated": false
        },
        "loggers-name": {
            "href": "http://localhost:9100/actuator/loggers/{name}",
            "templated": true
        },
        "heapdump": {
            "href": "http://localhost:9100/actuator/heapdump",
            "templated": false
        },
        "threaddump": {
            "href": "http://localhost:9100/actuator/threaddump",
            "templated": false
        },
        "metrics-requiredMetricName": {
            "href": "http://localhost:9100/actuator/metrics/{requiredMetricName}",
            "templated": true
        },
        "metrics": {
            "href": "http://localhost:9100/actuator/metrics",
            "templated": false
        },
        "scheduledtasks": {
            "href": "http://localhost:9100/actuator/scheduledtasks",
            "templated": false
        },
        "mappings": {
            "href": "http://localhost:9100/actuator/mappings",
            "templated": false
        },
        "refresh": {
            "href": "http://localhost:9100/actuator/refresh",
            "templated": false
        },
        "features": {
            "href": "http://localhost:9100/actuator/features",
            "templated": false
        }
    }
}
50 服务监控整合Admin-Ui:使用admin-ui格式化显示上面的json数据。
1、添加依赖
<!-- SpringBoot Admin -->
<dependency>
	<groupId>de.codecentric</groupId>
	<artifactId>spring-boot-admin-starter-server</artifactId>
	<version>${spring-boot-admin.version}</version>
</dependency>
2、监控启动类
@EnableAdminServer
@SpringBootApplication
public class RuoYiMonitorApplication
{
    public static void main(String[] args)
    {
        SpringApplication.run(RuoYiMonitorApplication.class, args);
        System.out.println("(♥◠‿◠)ノ゙  监控中心启动成功   ლ(´ڡ`ლ)゙  \n" +
                " .-------.       ____     __        \n" +
                " |  _ _   \\      \\   \\   /  /    \n" +
                " | ( ' )  |       \\  _. /  '       \n" +
                " |(_ o _) /        _( )_ .'         \n" +
                " | (_,_).' __  ___(_ o _)'          \n" +
                " |  |\\ \\  |  ||   |(_,_)'         \n" +
                " |  | \\ `'   /|   `-'  /           \n" +
                " |  |  \\    /  \\      /           \n" +
                " ''-'   `'-'    `-..-'              ");
    }
}
3、测试访问
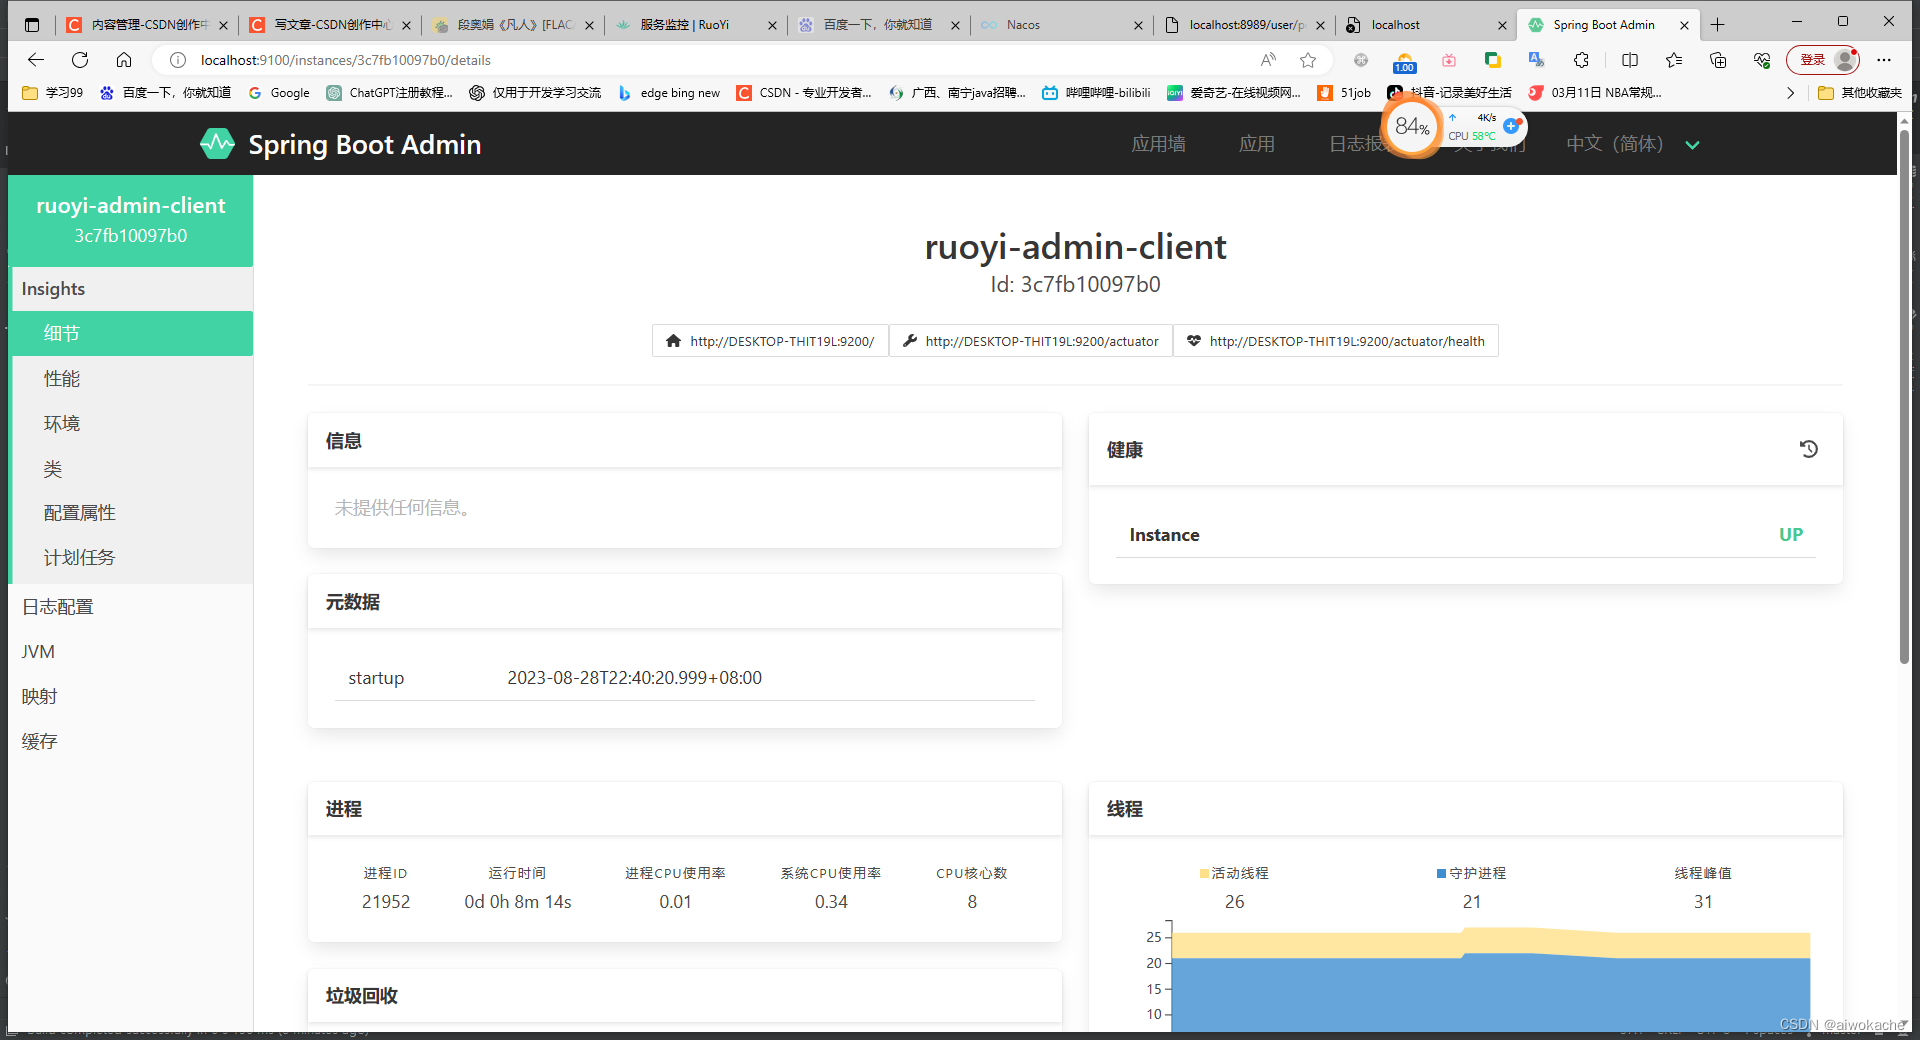
浏览器访问(http://localhost:9100 (opens new window))可以看到以下界面。

4、注意:还需要去配置客户端
51 服务监控客户端配置
之前已经把Admin(actuator工具 + Admin-Ui)服务跑起来了,但是界面里边什么应用都没有(0应用、0实例数)。因此需要加一个客户端,然后给(actuator工具 + Admin-Ui)服务进行监控。
0、新建客户端模块ruoyi-admin-client
1、pom.xml:添加依赖
<!-- SpringBoot Web,支持使用启动类(Application.java)启动微服务 -->
<dependency>
    <groupId>org.springframework.boot</groupId>
    <artifactId>spring-boot-starter-web</artifactId>
</dependency>

<!-- SpringBoot Admin Client -->
<dependency>
	<groupId>de.codecentric</groupId>
	<artifactId>spring-boot-admin-starter-client</artifactId>
</dependency>

<!-- SpringBoot Actuator -->
<dependency>
	<groupId>org.springframework.boot</groupId>
	<artifactId>spring-boot-starter-actuator</artifactId>
</dependency>
2、application.yml:配置服务端地址
server:
  port: 9200

# 注意放开端点,不然看到的信息非常少(只能看到默认的那几个)
management:
  endpoints:
    web:
      exposure:
        include: '*'
spring:
  application:
    name: ruoyi-admin-client
  boot:
    admin:
      client:
        # 指向服务端的ip + port
        url: http://localhost:9100
3、RuoyiClientApplication.java:启动类:去掉
package com.ruoyi.client;


import org.springframework.boot.SpringApplication;
import org.springframework.boot.autoconfigure.SpringBootApplication;

@SpringBootApplication
public class RuoYiClientApplication
{
    public static void main(String[] args)
    {
        SpringApplication.run(RuoYiClientApplication.class, args);
        System.out.println("(♥◠‿◠)ノ゙  监控中心启动成功   ლ(´ڡ`ლ)゙  \n" +
                " .-------.       ____     __        \n" +
                " |  _ _   \\      \\   \\   /  /    \n" +
                " | ( ' )  |       \\  _. /  '       \n" +
                " |(_ o _) /        _( )_ .'         \n" +
                " | (_,_).' __  ___(_ o _)'          \n" +
                " |  |\\ \\  |  ||   |(_,_)'         \n" +
                " |  | \\ `'   /|   `-'  /           \n" +
                " |  |  \\    /  \\      /           \n" +
                " ''-'   `'-'    `-..-'              ");
    }
}
4、测试验证
- 重启服务端、客户端
- 访问:服务端http://localhost:9100/
- 效果:展示客户端的所有信息。这个页面展示的信息,只是把之前的端点分类的所有接口(地址)都访问一遍,然后全部都用可视化界面进行展示。方便我们去分析整个应用情况:


![[ 云计算 | AWS ] Java 应用中使用 Amazon S3 进行存储桶和对象操作完全指南](https://img-blog.csdnimg.cn/cbf556213f85462d9ebdcd6238f2ea45.png)