大家好,我是带我去滑雪!
前一期利用python爬取了谷歌趋势某个关键词的每日搜索次数,本期利用爬取的数据进行多种机器学习方法进行学习,其中方法包括:随机森林、XGBOOST、决策树、支持向量机、神经网络、K邻近等方法,并对模型拟合效果进行对比。下面开始实战!
目录
(1)导入相关模块与爬取到的数据
(2)划分训练集与测试集
(3)保存真实值并对数据进行标准化
(4)调用模块
(5)回归交叉验证、计算评价指标
(6)评价指标可视化
(1)导入相关模块与爬取到的数据
import numpy as np
import matplotlib.pyplot as plt
import seaborn as sns
from sklearn import preprocessing
from sklearn.preprocessing import StandardScaler
from sklearn.model_selection import KFold,StratifiedKFold
from sklearn.model_selection import GridSearchCV
from sklearn.svm import LinearSVR
from sklearn.svm import SVR
from sklearn.ensemble import RandomForestRegressor
from sklearn.model_selection import train_test_split
from sklearn.metrics import mean_squared_error
from sklearn.metrics import mean_absolute_error
from sklearn.metrics import r2_score
get_ipython().run_line_magic('matplotlib', 'inline')
plt.rcParams['font.sans-serif'] = ['SimHei']
plt.rcParams['axes.unicode_minus'] = False
from IPython.core.interactiveshell import InteractiveShell
InteractiveShell.ast_node_interactivity = 'all'
import warnings
import seaborn as sns
import datetime
%matplotlib inline
plt.rcParams['font.sans-serif'] = ['KaiTi'] #中文
plt.rcParams['axes.unicode_minus'] = False #负号
get_ipython().run_line_magic('matplotlib', 'inline')
plt.rcParams['font.sans-serif'] = ['SimHei']
plt.rcParams['axes.unicode_minus'] = False
import warnings
import pandas as pd
import matplotlib.pyplot as plt
import networkx as nx
plt.rcParams['font.sans-serif'] = ['KaiTi']
plt.rcParams['axes.unicode_minus'] = False
from sklearn.linear_model import LinearRegression
from sklearn.linear_model import ElasticNet
from sklearn.neighbors import KNeighborsRegressor
from sklearn.tree import DecisionTreeRegressor
from sklearn.ensemble import RandomForestRegressor
from sklearn.ensemble import GradientBoostingRegressor
from xgboost.sklearn import XGBRegressor
from lightgbm import LGBMRegressor
from sklearn.svm import SVR
from sklearn.neural_network import MLPRegressor
data=pd.read_csv('E:/工作/硕士/博客/博客粉丝问题/data.csv')
data=data.iloc[0:1516,]
data输出结果:
zc rvw2 rvm2 tai eni aoi news1 skew2 kurt2 rvh 0 1.121 0.914 0.897 1.11 -0.1 0.340 0.83 1.251598 2.076749 0.545 1 0.545 0.869 0.881 1.11 -0.1 0.340 0.74 -0.170641 -1.551454 1.128 2 1.128 0.934 0.909 1.11 -0.1 0.340 0.77 -0.812615 0.216697 1.607 3 1.607 1.173 0.969 1.11 -0.1 0.340 0.79 1.597147 1.559141 0.547 4 0.547 0.990 0.915 1.11 -0.1 0.340 1.00 0.648262 0.772539 2.588 ... ... ... ... ... ... ... ... ... ... ... 1511 0.503 0.953 1.226 0.87 1.4 -0.674 0.92 -0.647114 0.750049 1.414 1512 1.414 1.068 1.266 0.87 1.4 -0.674 0.97 -1.045306 -0.604874 0.873 1513 0.873 1.046 1.273 0.87 1.4 -0.674 0.85 1.170148 0.211409 0.492 1514 0.492 0.867 1.259 0.87 1.4 -0.674 0.87 -1.124157 0.434954 0.747 1515 0.747 0.806 1.272 0.87 1.4 -0.674 0.73 0.732621 -1.058271 0.839 1516 rows × 10 columns
其中rvh为响应变量,其他为特征变量。
(2)划分训练集与测试集
X=data.iloc[:,0:9]
y=data.iloc[:,9]
X_train, X_test, y_train, y_test =train_test_split(X,y,test_size=0.2,random_state = 0)
#可以检查一下划分后数据形状
X_train.shape,X_test.shape, y_train.shape, y_test.shape输出结果:
((1212, 9), (304, 9), (1212,), (304,))
(3)保存真实值并对数据进行标准化
#数据标准化
from sklearn.preprocessing import StandardScaler
scaler = StandardScaler()
scaler.fit(X_train)
X_train_s = scaler.transform(X_train)
X_test_s = scaler.transform(X_test)
print('训练数据形状:')
print(X_train_s.shape,y_train.shape)
print('测试数据形状:')
(X_test_s.shape,y_test.shape)输出结果:
训练数据形状:(1212, 9) (1212,)
测试数据形状:((304, 9), (304,))
(4)调用模块
model1 = LinearRegression()
model2 = ElasticNet(alpha=0.05, l1_ratio=0.5)
model3 = KNeighborsRegressor(n_neighbors=10)
model4 = DecisionTreeRegressor(random_state=77)
model5= RandomForestRegressor(n_estimators=500, max_features=int(X_train.shape[1]/3) , random_state=0)
model6 = GradientBoostingRegressor(n_estimators=500,random_state=123)
model7 = XGBRegressor(objective='reg:squarederror', n_estimators=1000, random_state=0)
model8 = LGBMRegressor(n_estimators=1000,objective='regression', # 默认是二分类
random_state=0)
model9 = SVR(kernel="rbf")
model10 = MLPRegressor(hidden_layer_sizes=(16,8), random_state=77, max_iter=10000)
model_list=[model1,model2,model3,model4,model5,model6,model7,model8,model9,model10]
model_name=['线性回归','惩罚回归','K近邻','决策树','随机森林','梯度提升','极端梯度提升','轻量梯度提升','支持向量机','神经网络']
(5)回归交叉验证、计算评价指标
#回归问题交叉验证,使用拟合优度,mae,rmse,mape 作为评价标准
from sklearn.metrics import mean_absolute_error
from sklearn.metrics import mean_squared_error,r2_score
from sklearn.model_selection import KFold
def evaluation(y_test, y_predict):
mae = mean_absolute_error(y_test, y_predict)
mse = mean_squared_error(y_test, y_predict)
rmse = np.sqrt(mean_squared_error(y_test, y_predict))
mape=(abs(y_predict -y_test)/ y_test).mean()
r_2=r2_score(y_test, y_predict)
return mae, rmse, mape
def evaluation2(lis):
array=np.array(lis)
return array.mean() , array.std()def cross_val(model=None,X=None,Y=None,K=5,repeated=1):
df_mean=pd.DataFrame(columns=['R2','MAE','RMSE','MAPE'])
df_std=pd.DataFrame(columns=['R2','MAE','RMSE','MAPE'])
for n in range(repeated):
print(f'正在进行第{n+1}次重复K折.....随机数种子为{n}\n')
kf = KFold(n_splits=K, shuffle=True, random_state=n)
R2=[]
MAE=[]
RMSE=[]
MAPE=[]
print(f" 开始本次在{K}折数据上的交叉验证.......\n")
i=1
for train_index, test_index in kf.split(X):
print(f' 正在进行第{i}折的计算')
X_train=X.values[train_index]
y_train=y.values[train_index]
X_test=X.values[test_index]
y_test=y.values[test_index]
model.fit(X_train,y_train)
score=model.score(X_test,y_test)
R2.append(score)
pred=model.predict(X_test)
mae, rmse, mape=evaluation(y_test, pred)
MAE.append(mae)
RMSE.append(rmse)
MAPE.append(mape)
print(f' 第{i}折的拟合优度为:{round(score,4)},MAE为{round(mae,4)},RMSE为{round(rmse,4)},MAPE为{round(mape,4)}')
i+=1
print(f' ———————————————完成本次的{K}折交叉验证———————————————————\n')
R2_mean,R2_std=evaluation2(R2)
MAE_mean,MAE_std=evaluation2(MAE)
RMSE_mean,RMSE_std=evaluation2(RMSE)
MAPE_mean,MAPE_std=evaluation2(MAPE)
print(f'第{n+1}次重复K折,本次{K}折交叉验证的总体拟合优度均值为{R2_mean},方差为{R2_std}')
print(f' 总体MAE均值为{MAE_mean},方差为{MAE_std}')
print(f' 总体RMSE均值为{RMSE_mean},方差为{RMSE_std}')
print(f' 总体MAPE均值为{MAPE_mean},方差为{MAPE_std}')
print("\n====================================================================================================================\n")
df1=pd.DataFrame(dict(zip(['R2','MAE','RMSE','MAPE'],[R2_mean,MAE_mean,RMSE_mean,MAPE_mean])),index=[n])
df_mean=pd.concat([df_mean,df1])
df2=pd.DataFrame(dict(zip(['R2','MAE','RMSE','MAPE'],[R2_std,MAE_std,RMSE_std,MAPE_std])),index=[n])
df_std=pd.concat([df_std,df2])
return df_mean,df_stdmodel =RandomForestRegressor(n_estimators=500, max_features=int(X_train.shape[1]/3) , random_state=0)
ran_crosseval,lgb_crosseval2=cross_val(model=model,X=data,Y=y,K=3,repeated=5)输出结果:
正在进行第1次重复K折.....随机数种子为0

    开始本次在3折数据上的交叉验证.......

        正在进行第1折的计算
        第1折的拟合优度为:0.6359,MAE为0.5313,RMSE为2.4973,MAPE为0.8891
        正在进行第2折的计算
        第2折的拟合优度为:0.9329,MAE为0.2918,RMSE为0.6796,MAPE为3.6771
        正在进行第3折的计算
        第3折的拟合优度为:0.4618,MAE为0.4001,RMSE为3.7925,MAPE为1.6797
    ———————————————完成本次的3折交叉验证———————————————————

第1次重复K折,本次3折交叉验证的总体拟合优度均值为0.6768657819427061,方差为0.1944779600384177
                               总体MAE均值为0.4077273555381626,方差为0.09794742090384587
                               总体RMSE均值为2.32313716109176,方差为1.2768087853386325
                               总体MAPE均值为2.081956991377407,方差为1.1732020214054228

====================================================================================================================

正在进行第2次重复K折.....随机数种子为1

    开始本次在3折数据上的交叉验证.......

        正在进行第1折的计算
        第1折的拟合优度为:0.9122,MAE为0.3241,RMSE为0.8612,MAPE为2.5479
        正在进行第2折的计算
        第2折的拟合优度为:0.5261,MAE为0.4917,RMSE为3.9197,MAPE为0.7314
        正在进行第3折的计算
        第3折的拟合优度为:0.7334,MAE为0.3584,RMSE为1.6217,MAPE为3.2285
    ———————————————完成本次的3折交叉验证———————————————————

第2次重复K折,本次3折交叉验证的总体拟合优度均值为0.723893113441683,方差为0.1577702476056785
                               总体MAE均值为0.3914201753688413,方差为0.0723024001955509
                               总体RMSE均值为2.134188184101481,方差为1.3001480884844312
                               总体MAPE均值为2.16926700543488,方差为1.054037140770381

====================================================================================================================

正在进行第3次重复K折.....随机数种子为2

    开始本次在3折数据上的交叉验证.......

        正在进行第1折的计算
        第1折的拟合优度为:0.8149,MAE为0.3709,RMSE为1.2755,MAPE为3.4917
        正在进行第2折的计算
        第2折的拟合优度为:0.759,MAE为0.3612,RMSE为1.7133,MAPE为1.5378
        正在进行第3折的计算
        第3折的拟合优度为:0.4928,MAE为0.4426,RMSE为3.8865,MAPE为1.5668
    ———————————————完成本次的3折交叉验证———————————————————

第3次重复K折,本次3折交叉验证的总体拟合优度均值为0.688911890284598,方差为0.1405413525714651
                               总体MAE均值为0.39156320132013217,方差为0.03629566064010328
                               总体RMSE均值为2.2917865136481503,方差为1.1417413813810955
                               总体MAPE均值为2.1988055874081742,方差为0.9143226546000691

====================================================================================================================

正在进行第4次重复K折.....随机数种子为3

    开始本次在3折数据上的交叉验证.......

        正在进行第1折的计算
        第1折的拟合优度为:0.8007,MAE为0.3457,RMSE为1.366,MAPE为0.6371
        正在进行第2折的计算
        第2折的拟合优度为:0.7519,MAE为0.4026,RMSE为1.6195,MAPE为2.696
        正在进行第3折的计算
        第3折的拟合优度为:0.5335,MAE为0.4128,RMSE为3.795,MAPE为3.053
    ———————————————完成本次的3折交叉验证———————————————————

第4次重复K折,本次3折交叉验证的总体拟合优度均值为0.6953494486212177,方差为0.11614834637464808
                               总体MAE均值为0.38705033229496877,方差为0.029539032784274593
                               总体RMSE均值为2.260164391836863,方差为1.09022294514881
                               总体MAPE均值为2.1287335373456533,方差为1.0647308676641345

====================================================================================================================

正在进行第5次重复K折.....随机数种子为4

    开始本次在3折数据上的交叉验证.......

        正在进行第1折的计算
        第1折的拟合优度为:0.476,MAE为0.3845,RMSE为3.7705,MAPE为2.4277
        正在进行第2折的计算
        第2折的拟合优度为:0.6823,MAE为0.5015,RMSE为2.3399,MAPE为1.9511
        正在进行第3折的计算
        第3折的拟合优度为:0.9344,MAE为0.296,RMSE为0.6479,MAPE为2.1377
    ———————————————完成本次的3折交叉验证———————————————————

第5次重复K折,本次3折交叉验证的总体拟合优度均值为0.697579240530468,方差为0.1874164914708924
                               总体MAE均值为0.39400183092135327,方差为0.08418015995547488
                               总体RMSE均值为2.2527506508008055,方差为1.2762736734101292
                               总体MAPE均值为2.17217444185678,方差为0.196086080141957

====================================================================================================================
(6)评价指标可视化
plt.subplots(1,4,figsize=(16,3))
for i,col in enumerate(lgb_crosseval.columns):
n=int(str('14')+str(i+1))
plt.subplot(n)
plt.plot(ran_crosseval[col], c= 'dimgray', label='随机森林')
plt.plot(xgb_crosseval[col], c='aqua',marker='h', label='XGBOOST')
plt.plot(der_crosseval[col], c='teal',marker='p', label='决策树')
plt.plot(svr_crosseval[col], c='red',marker='*', label='支持向量机')
plt.plot(mlp_crosseval[col], c='lawngreen', marker='s',label='神经网络')
plt.plot(knr_crosseval[col], c='darkorange', marker='p',label='k邻近')
plt.title(f'不同模型的{col}对比')
plt.xlabel('重复交叉验证次数')
plt.ylabel(col,fontsize=16)
plt.legend(loc="upper right")
plt.tight_layout()
plt.savefig("squares.png",
bbox_inches ="tight",
pad_inches = 1,
transparent = True,
facecolor ="w",
edgecolor ='w',
dpi=300,
orientation ='landscape')输出结果:
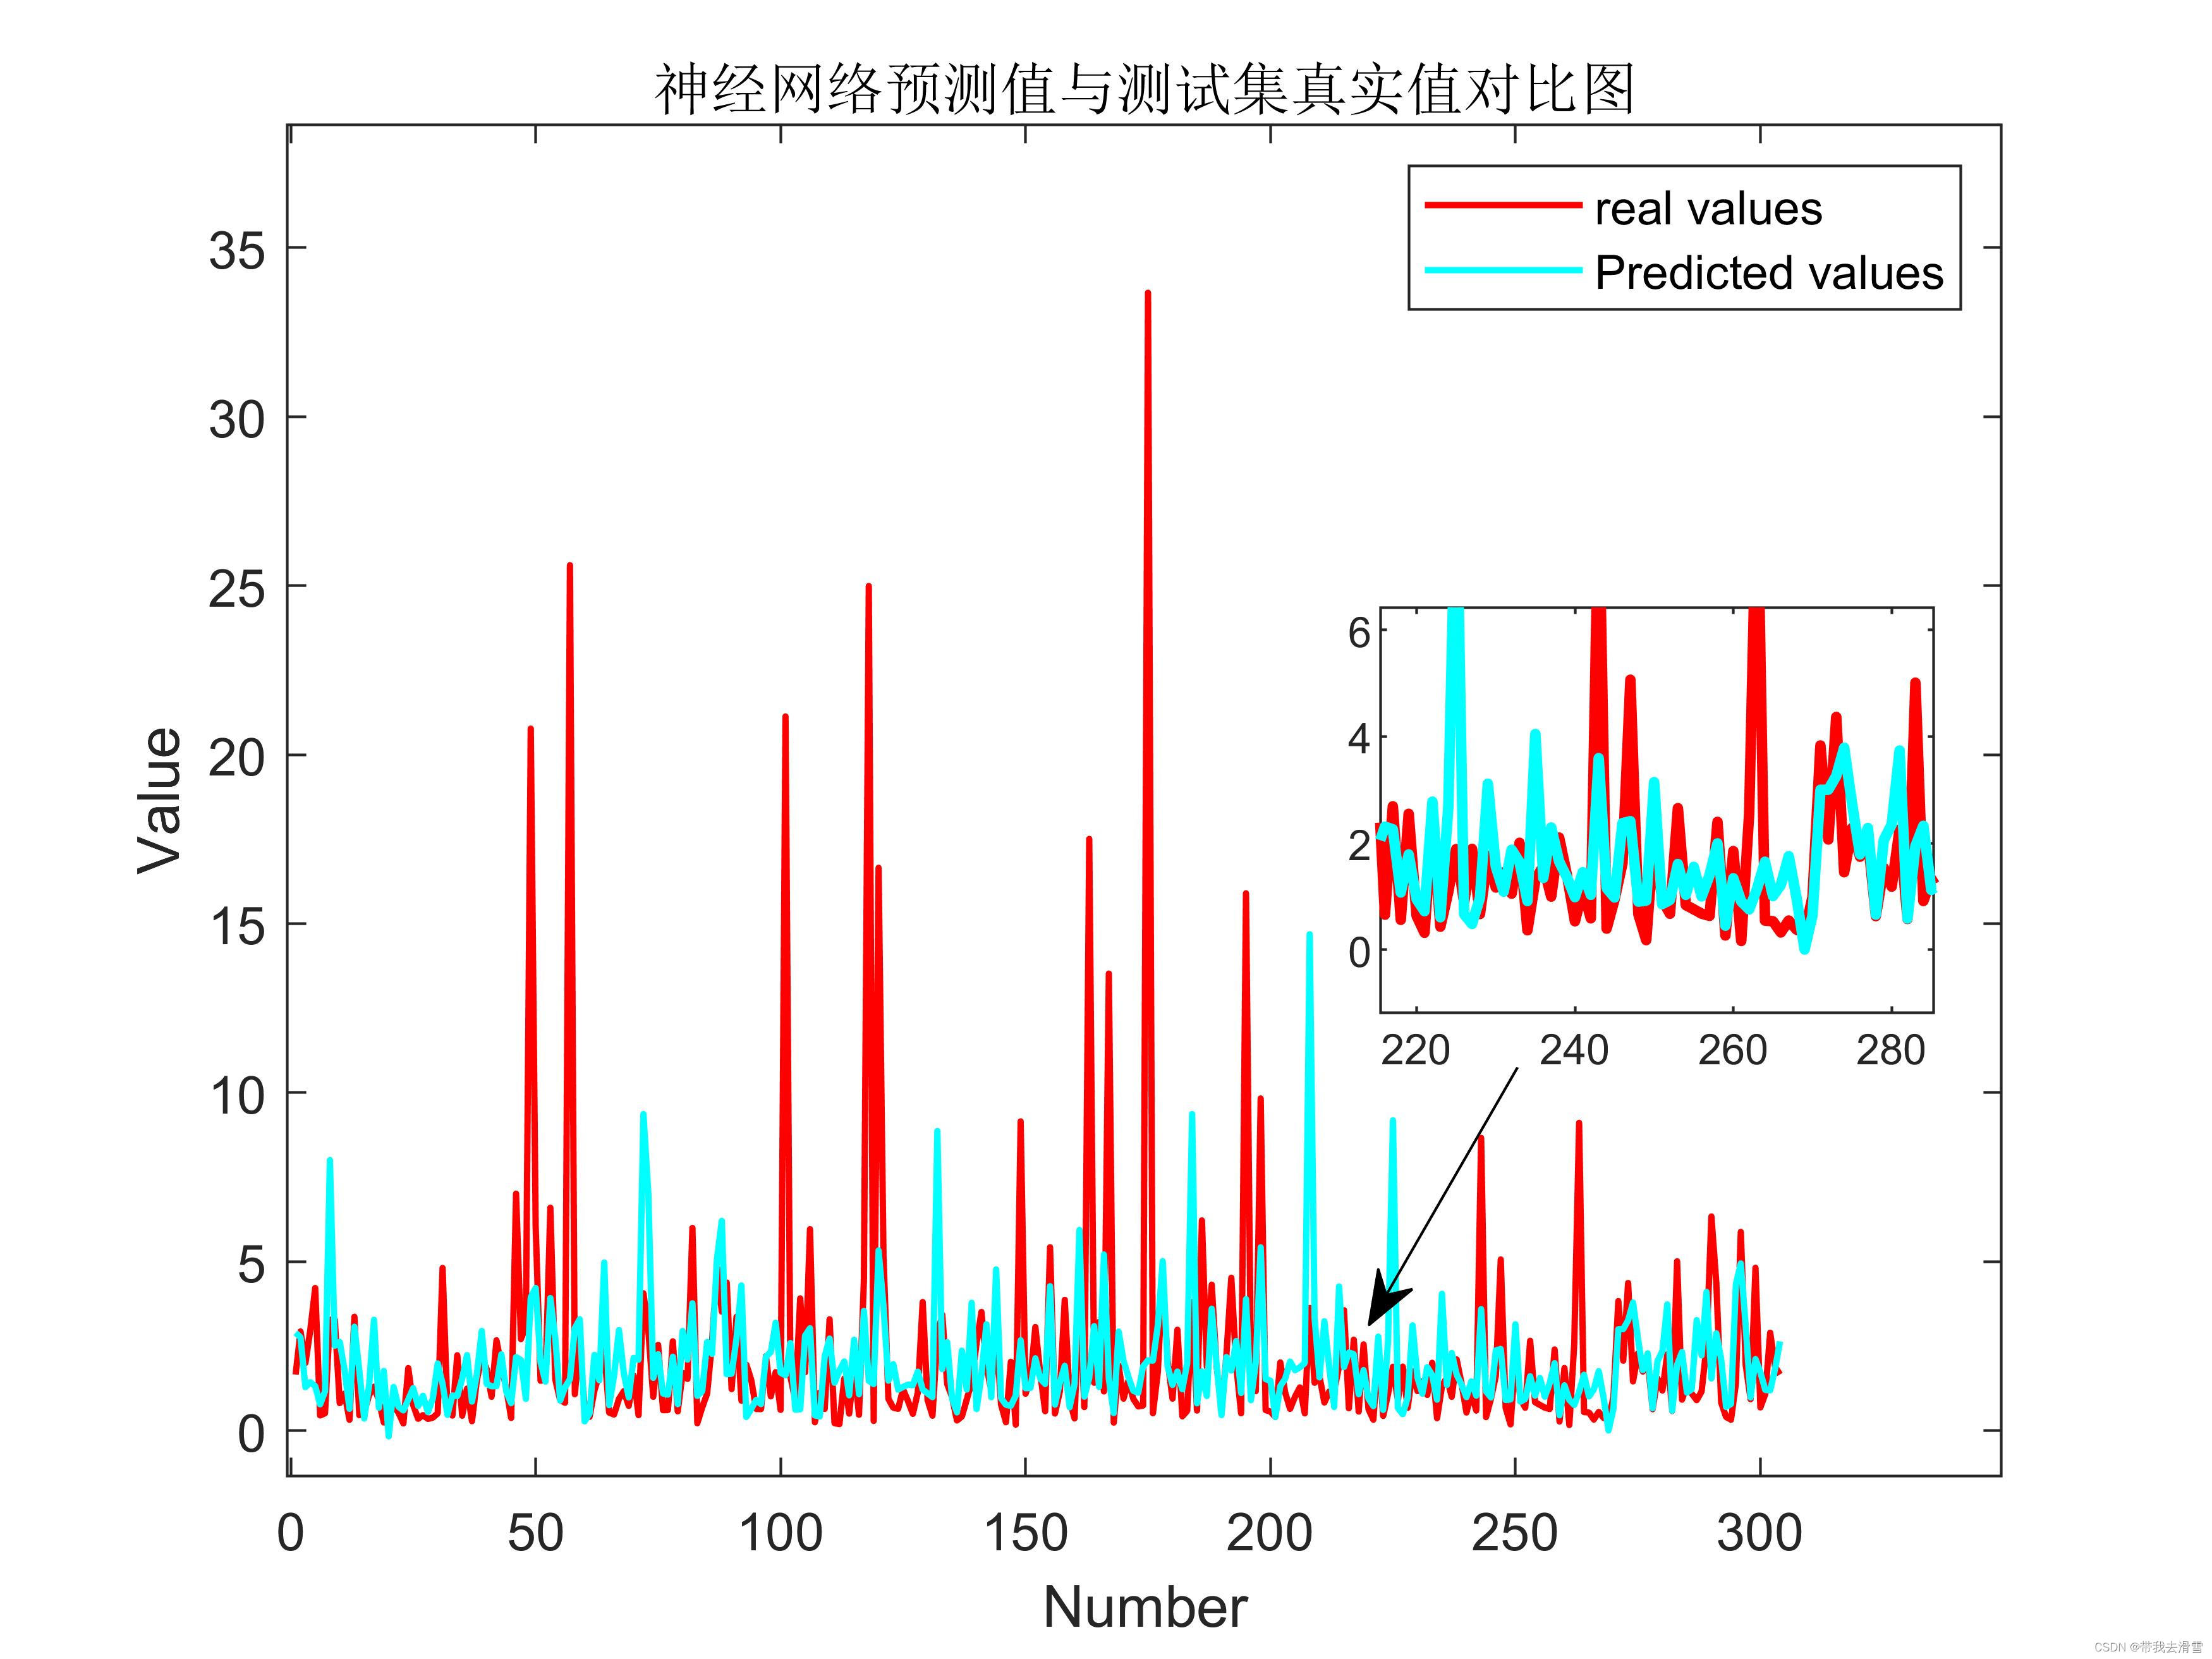
(7)部分模型预测对比图


需要数据集的家人们可以去百度网盘(永久有效)获取:
链接:https://pan.baidu.com/s/1E59qYZuGhwlrx6gn4JJZTg?pwd=2138
提取码:2138
更多优质内容持续发布中,请移步主页查看。
有任何问题,欢迎私信博主!
点赞+关注,下次不迷路!

