Kaggle(3):Predict CO2 Emissions in Rwanda

1. Introduction
在本次竞赛中,我们的任务是预测非洲 497 个不同地点 2022 年的二氧化碳排放量。 在训练数据中,我们有 2019-2021 年的二氧化碳排放量
本笔记本的内容:
1.通过平滑消除2020年一次性的新冠疫情趋势。 或者,用 2019 年和 2021 年的平均值来估算 2020 年也是一种有效的方法,但此处未实施
2. 观察靠近最大排放位置的位置也具有较高的排放水平。 执行 K-Means 聚类以根据数据点的位置对数据点进行聚类。 这允许具有相似排放的数据点被分组在一起
3. 以 2019 年和 2020 年为训练数据,用一些集成模型进行实验,以测试其在 2021 年数据上的 CV
import numpy as np
import pandas as pd
import matplotlib.pyplot as plt
import seaborn as sns
import math
from tqdm import tqdm
from sklearn.preprocessing import SplineTransformer
from holidays import CountryHoliday
from tqdm.notebook import tqdm
from typing import List


from category_encoders import OneHotEncoder, MEstimateEncoder, GLMMEncoder, OrdinalEncoder
from sklearn.model_selection import RepeatedStratifiedKFold, StratifiedKFold, KFold, RepeatedKFold, TimeSeriesSplit, train_test_split, cross_val_score
from sklearn.ensemble import ExtraTreesRegressor, RandomForestRegressor, GradientBoostingRegressor
from sklearn.ensemble import HistGradientBoostingRegressor, VotingRegressor, StackingRegressor
from sklearn.svm import SVR, LinearSVR
from sklearn.neighbors import KNeighborsRegressor
from sklearn.ensemble import RandomForestClassifier
from sklearn.linear_model import LinearRegression, Ridge, Lasso, ElasticNet, SGDRegressor, LogisticRegression
from sklearn.linear_model import PassiveAggressiveRegressor, ARDRegression
from sklearn.linear_model import TheilSenRegressor, RANSACRegressor, HuberRegressor
from sklearn.cross_decomposition import PLSRegression
from sklearn.neural_network import MLPRegressor
from sklearn.metrics import mean_squared_error, mean_absolute_error, roc_auc_score, roc_curve
from sklearn.metrics.pairwise import euclidean_distances
from sklearn.pipeline import Pipeline, make_pipeline
from sklearn.base import BaseEstimator, TransformerMixin
from sklearn.preprocessing import FunctionTransformer, StandardScaler, MinMaxScaler, LabelEncoder, SplineTransformer
from sklearn.compose import ColumnTransformer
from sklearn.impute import SimpleImputer, KNNImputer
from scipy.cluster.hierarchy import dendrogram, linkage
from scipy.spatial.distance import squareform
from sklearn.feature_selection import RFECV
from sklearn.decomposition import PCA
from xgboost import XGBRegressor, XGBClassifier
import lightgbm as lgbm
from lightgbm import LGBMRegressor, LGBMClassifier
from lightgbm import log_evaluation, early_stopping, record_evaluation
from catboost import CatBoostRegressor, CatBoostClassifier, Pool
from sklearn import set_config
from sklearn.multioutput import MultiOutputClassifier
from datetime import datetime, timedelta
import gc

import warnings
warnings.filterwarnings('ignore')

set_config(transform_output = 'pandas')

pal = sns.color_palette('viridis')

pd.set_option('display.max_rows', 100)
M = 1.07
2. Examine Data
2.1
在这里,我们试图平滑 2020 年的数据以消除新冠趋势
1.使用平滑导入的数据集
2. 使用 2019 年和 2021 年值的平均值 [https://www.kaggle.com/code/kacperrabczewski/rwanda-co2-step-by-step-guide]
extrp = pd.read_csv("./data/PS3E20_train_covid_updated")
extrp = extrp[(extrp["year"] == 2020)]
extrp
| ID_LAT_LON_YEAR_WEEK | latitude | longitude | year | week_no | SulphurDioxide_SO2_column_number_density | SulphurDioxide_SO2_column_number_density_amf | SulphurDioxide_SO2_slant_column_number_density | SulphurDioxide_cloud_fraction | SulphurDioxide_sensor_azimuth_angle | ... | Cloud_cloud_top_height | Cloud_cloud_base_pressure | Cloud_cloud_base_height | Cloud_cloud_optical_depth | Cloud_surface_albedo | Cloud_sensor_azimuth_angle | Cloud_sensor_zenith_angle | Cloud_solar_azimuth_angle | Cloud_solar_zenith_angle | emission | |
|---|---|---|---|---|---|---|---|---|---|---|---|---|---|---|---|---|---|---|---|---|---|
| 53 | ID_-0.510_29.290_2020_00 | -0.510 | 29.290 | 2020 | 0 | 0.000064 | 0.970290 | 0.000073 | 0.163462 | -100.602665 | ... | 5388.602054 | 60747.063530 | 4638.602176 | 6.287709 | 0.283116 | -13.291375 | 33.679610 | -140.309173 | 30.053447 | 3.753601 |
| 54 | ID_-0.510_29.290_2020_01 | -0.510 | 29.290 | 2020 | 1 | NaN | NaN | NaN | NaN | NaN | ... | 6361.488754 | 53750.174162 | 5361.488754 | 19.167269 | 0.317732 | -30.474972 | 48.119754 | -139.437777 | 30.391957 | 4.051966 |
| 55 | ID_-0.510_29.290_2020_02 | -0.510 | 29.290 | 2020 | 2 | -0.000361 | 0.668526 | -0.000231 | 0.086199 | 73.269733 | ... | 5320.715902 | 61012.625000 | 4320.715861 | 48.203733 | 0.265554 | -12.461150 | 35.809728 | -137.854449 | 29.100415 | 4.154116 |
| 56 | ID_-0.510_29.290_2020_03 | -0.510 | 29.290 | 2020 | 3 | 0.000597 | 0.553729 | 0.000331 | 0.149257 | 73.522247 | ... | 6219.319294 | 55704.782998 | 5219.319269 | 12.809350 | 0.267030 | 16.381079 | 35.836898 | -139.017754 | 26.265561 | 4.165751 |
| 57 | ID_-0.510_29.290_2020_04 | -0.510 | 29.290 | 2020 | 4 | 0.000107 | 1.045238 | 0.000112 | 0.224283 | 77.588455 | ... | 6348.560006 | 54829.331776 | 5348.560014 | 35.283981 | 0.268983 | -12.193650 | 47.092968 | -134.474279 | 27.061321 | 4.233635 |
| ... | ... | ... | ... | ... | ... | ... | ... | ... | ... | ... | ... | ... | ... | ... | ... | ... | ... | ... | ... | ... | ... |
| 78965 | ID_-3.299_30.301_2020_48 | -3.299 | 30.301 | 2020 | 48 | 0.000114 | 1.123935 | 0.000125 | 0.149885 | 74.376836 | ... | 6092.323722 | 57479.397776 | 5169.185142 | 15.331296 | 0.261608 | 16.309625 | 39.924967 | -132.258700 | 30.393604 | 26.929207 |
| 78966 | ID_-3.299_30.301_2020_49 | -3.299 | 30.301 | 2020 | 49 | 0.000051 | 0.617927 | 0.000031 | 0.213135 | 72.364738 | ... | 5992.053006 | 57739.300155 | 4992.053006 | 27.214085 | 0.276616 | -0.287656 | 45.624810 | -134.460418 | 30.911741 | 26.606790 |
| 78967 | ID_-3.299_30.301_2020_50 | -3.299 | 30.301 | 2020 | 50 | -0.000235 | 0.633192 | -0.000149 | 0.257000 | -99.141518 | ... | 6104.231241 | 56954.517231 | 5181.570213 | 26.270365 | 0.260574 | -50.411241 | 37.645974 | -132.193161 | 32.516685 | 27.256273 |
| 78968 | ID_-3.299_30.301_2020_51 | -3.299 | 30.301 | 2020 | 51 | NaN | NaN | NaN | NaN | NaN | ... | 4855.537585 | 64839.955718 | 3858.187453 | 14.519789 | 0.248484 | 30.840922 | 39.529722 | -138.964016 | 28.574091 | 25.591976 |
| 78969 | ID_-3.299_30.301_2020_52 | -3.299 | 30.301 | 2020 | 52 | 0.000025 | 1.103025 | 0.000028 | 0.265622 | -99.811790 | ... | 5345.679464 | 62098.716546 | 4345.679397 | 13.082162 | 0.283677 | -13.002957 | 38.243055 | -136.660958 | 29.584058 | 25.559870 |
26341 rows × 76 columns
DATA_DIR = "./data/"
train = pd.read_csv(DATA_DIR + "train.csv")
test = pd.read_csv(DATA_DIR + "test.csv")

def add_features(df):
    #df["week"] = df["year"].astype(str) + "-" + df["week_no"].astype(str)
    #df["date"] = df["week"].apply(lambda x: get_date_from_week_string(x))
    #df = df.drop(columns = ["week"])
    df["week"] = (df["year"] - 2019) * 53 + df["week_no"]
    #df["lat_long"] = df["latitude"].astype(str) + "#" + df["longitude"].astype(str)
    return df

train = add_features(train)
test = add_features(test)
2.2
对预测进行一些有风险的后处理。
假设数据点的 MAX = max(2019 年排放量、2020 年排放量、2021 年排放量)。
如果 2021 年排放量 > 2019 年排放量,我们将 MAX * 1.07 分配给预测,否则我们只分配 MAX。 参考:https://www.kaggle.com/competitions/playground-series-s3e20/discussion/430152
vals = set()
for x in train[["latitude", "longitude"]].values:
    vals.add(tuple(x))

vals = list(vals)
zeros = []

for lat, long in vals:
    subset = train[(train["latitude"] == lat) & (train["longitude"] == long)]
    em_vals = subset["emission"].values
    if all(x == 0 for x in em_vals):
        zeros.append([lat, long])
test["2021_emission"] = test["week_no"]
test["2020_emission"] = test["week_no"]
test["2019_emission"] = test["week_no"]

for lat, long in vals:
    test.loc[(test.latitude == lat) & (test.longitude == long), "2021_emission"] = train.loc[(train.latitude == lat) & (train.longitude == long) & (train.year == 2021) & (train.week_no <= 48), "emission"].values
    test.loc[(test.latitude == lat) & (test.longitude == long), "2020_emission"] = train.loc[(train.latitude == lat) & (train.longitude == long) & (train.year == 2020) & (train.week_no <= 48), "emission"].values
    test.loc[(test.latitude == lat) & (test.longitude == long), "2019_emission"] = train.loc[(train.latitude == lat) & (train.longitude == long) & (train.year == 2019) & (train.week_no <= 48), "emission"].values
    #print(train.loc[(train.latitude == lat) & (train.longitude == long) & (train.year == 2021), "emission"])

test["ratio"] = (test["2021_emission"] / test["2019_emission"]).replace(np.nan, 0)
test["pos_ratio"] = test["ratio"].apply(lambda x: max(x, 1))
test["pos_ratio"] = test["pos_ratio"].apply(lambda x: 1.07 if x > 1 else x)
test["max"] = test[["2019_emission", "2020_emission", "2021_emission"]].max(axis=1)
test["lazy_pred"] = test["max"] * test["pos_ratio"]
test = test.drop(columns = ["ratio", "pos_ratio", "max", "2019_emission", "2020_emission", "2021_emission"])
train.loc[train.year == 2020, "emission"] = extrp
train
| ID_LAT_LON_YEAR_WEEK | latitude | longitude | year | week_no | SulphurDioxide_SO2_column_number_density | SulphurDioxide_SO2_column_number_density_amf | SulphurDioxide_SO2_slant_column_number_density | SulphurDioxide_cloud_fraction | SulphurDioxide_sensor_azimuth_angle | ... | Cloud_cloud_base_pressure | Cloud_cloud_base_height | Cloud_cloud_optical_depth | Cloud_surface_albedo | Cloud_sensor_azimuth_angle | Cloud_sensor_zenith_angle | Cloud_solar_azimuth_angle | Cloud_solar_zenith_angle | emission | week | |
|---|---|---|---|---|---|---|---|---|---|---|---|---|---|---|---|---|---|---|---|---|---|
| 0 | ID_-0.510_29.290_2019_00 | -0.510 | 29.290 | 2019 | 0 | -0.000108 | 0.603019 | -0.000065 | 0.255668 | -98.593887 | ... | 61085.809570 | 2615.120483 | 15.568533 | 0.272292 | -12.628986 | 35.632416 | -138.786423 | 30.752140 | 3.750994 | 0 |
| 1 | ID_-0.510_29.290_2019_01 | -0.510 | 29.290 | 2019 | 1 | 0.000021 | 0.728214 | 0.000014 | 0.130988 | 16.592861 | ... | 66969.478735 | 3174.572424 | 8.690601 | 0.256830 | 30.359375 | 39.557633 | -145.183930 | 27.251779 | 4.025176 | 1 |
| 2 | ID_-0.510_29.290_2019_02 | -0.510 | 29.290 | 2019 | 2 | 0.000514 | 0.748199 | 0.000385 | 0.110018 | 72.795837 | ... | 60068.894448 | 3516.282669 | 21.103410 | 0.251101 | 15.377883 | 30.401823 | -142.519545 | 26.193296 | 4.231381 | 2 |
| 3 | ID_-0.510_29.290_2019_03 | -0.510 | 29.290 | 2019 | 3 | NaN | NaN | NaN | NaN | NaN | ... | 51064.547339 | 4180.973322 | 15.386899 | 0.262043 | -11.293399 | 24.380357 | -132.665828 | 28.829155 | 4.305286 | 3 |
| 4 | ID_-0.510_29.290_2019_04 | -0.510 | 29.290 | 2019 | 4 | -0.000079 | 0.676296 | -0.000048 | 0.121164 | 4.121269 | ... | 63751.125781 | 3355.710107 | 8.114694 | 0.235847 | 38.532263 | 37.392979 | -141.509805 | 22.204612 | 4.347317 | 4 |
| ... | ... | ... | ... | ... | ... | ... | ... | ... | ... | ... | ... | ... | ... | ... | ... | ... | ... | ... | ... | ... | ... |
| 79018 | ID_-3.299_30.301_2021_48 | -3.299 | 30.301 | 2021 | 48 | 0.000284 | 1.195643 | 0.000340 | 0.191313 | 72.820518 | ... | 60657.101913 | 4590.879504 | 20.245954 | 0.304797 | -35.140368 | 40.113533 | -129.935508 | 32.095214 | 29.404171 | 154 |
| 79019 | ID_-3.299_30.301_2021_49 | -3.299 | 30.301 | 2021 | 49 | 0.000083 | 1.130868 | 0.000063 | 0.177222 | -12.856753 | ... | 60168.191528 | 4659.130378 | 6.104610 | 0.314015 | 4.667058 | 47.528435 | -134.252871 | 30.771469 | 29.186497 | 155 |
| 79020 | ID_-3.299_30.301_2021_50 | -3.299 | 30.301 | 2021 | 50 | NaN | NaN | NaN | NaN | NaN | ... | 56596.027209 | 5222.646823 | 14.817885 | 0.288058 | -0.340922 | 35.328098 | -134.731723 | 30.716166 | 29.131205 | 156 |
| 79021 | ID_-3.299_30.301_2021_51 | -3.299 | 30.301 | 2021 | 51 | -0.000034 | 0.879397 | -0.000028 | 0.184209 | -100.344827 | ... | 46533.348194 | 6946.858022 | 32.594768 | 0.274047 | 8.427699 | 48.295652 | -139.447849 | 29.112868 | 28.125792 | 157 |
| 79022 | ID_-3.299_30.301_2021_52 | -3.299 | 30.301 | 2021 | 52 | -0.000091 | 0.871951 | -0.000079 | 0.000000 | 76.825638 | ... | 47771.681887 | 6553.295018 | 19.464032 | 0.226276 | -12.808528 | 47.923441 | -136.299984 | 30.246387 | 27.239302 | 158 |
79023 rows × 77 columns
test
| ID_LAT_LON_YEAR_WEEK | latitude | longitude | year | week_no | SulphurDioxide_SO2_column_number_density | SulphurDioxide_SO2_column_number_density_amf | SulphurDioxide_SO2_slant_column_number_density | SulphurDioxide_cloud_fraction | SulphurDioxide_sensor_azimuth_angle | ... | Cloud_cloud_base_pressure | Cloud_cloud_base_height | Cloud_cloud_optical_depth | Cloud_surface_albedo | Cloud_sensor_azimuth_angle | Cloud_sensor_zenith_angle | Cloud_solar_azimuth_angle | Cloud_solar_zenith_angle | week | lazy_pred | |
|---|---|---|---|---|---|---|---|---|---|---|---|---|---|---|---|---|---|---|---|---|---|
| 0 | ID_-0.510_29.290_2022_00 | -0.510 | 29.290 | 2022 | 0 | NaN | NaN | NaN | NaN | NaN | ... | 41047.937500 | 7472.313477 | 7.935617 | 0.240773 | -100.113792 | 33.697044 | -133.047546 | 33.779583 | 159 | 3.753601 |
| 1 | ID_-0.510_29.290_2022_01 | -0.510 | 29.290 | 2022 | 1 | 0.000456 | 0.691164 | 0.000316 | 0.000000 | 76.239196 | ... | 54915.708579 | 5476.147161 | 11.448437 | 0.293119 | -30.510319 | 42.402593 | -138.632822 | 31.012380 | 160 | 4.051966 |
| 2 | ID_-0.510_29.290_2022_02 | -0.510 | 29.290 | 2022 | 2 | 0.000161 | 0.605107 | 0.000106 | 0.079870 | -42.055341 | ... | 39006.093750 | 7984.795703 | 10.753179 | 0.267130 | 39.087361 | 45.936480 | -144.784988 | 26.743361 | 161 | 4.231381 |
| 3 | ID_-0.510_29.290_2022_03 | -0.510 | 29.290 | 2022 | 3 | 0.000350 | 0.696917 | 0.000243 | 0.201028 | 72.169566 | ... | 57646.368368 | 5014.724115 | 11.764556 | 0.304679 | -24.465127 | 42.140419 | -135.027891 | 29.604774 | 162 | 4.305286 |
| 4 | ID_-0.510_29.290_2022_04 | -0.510 | 29.290 | 2022 | 4 | -0.000317 | 0.580527 | -0.000184 | 0.204352 | 76.190865 | ... | 52896.541873 | 5849.280394 | 13.065317 | 0.284221 | -12.907850 | 30.122641 | -135.500119 | 26.276807 | 163 | 4.347317 |
| ... | ... | ... | ... | ... | ... | ... | ... | ... | ... | ... | ... | ... | ... | ... | ... | ... | ... | ... | ... | ... | ... |
| 24348 | ID_-3.299_30.301_2022_44 | -3.299 | 30.301 | 2022 | 44 | -0.000618 | 0.745549 | -0.000461 | 0.234492 | 72.306198 | ... | 55483.459980 | 5260.120056 | 30.398508 | 0.180046 | -25.528588 | 45.284576 | -116.521412 | 29.992562 | 203 | 30.327420 |
| 24349 | ID_-3.299_30.301_2022_45 | -3.299 | 30.301 | 2022 | 45 | NaN | NaN | NaN | NaN | NaN | ... | 53589.917383 | 5678.951521 | 19.223844 | 0.177833 | -13.380005 | 43.770351 | -122.405759 | 29.017975 | 204 | 30.811167 |
| 24350 | ID_-3.299_30.301_2022_46 | -3.299 | 30.301 | 2022 | 46 | NaN | NaN | NaN | NaN | NaN | ... | 62646.761340 | 4336.282491 | 13.801194 | 0.219471 | -5.072065 | 33.226455 | -124.530639 | 30.187472 | 205 | 31.162886 |
| 24351 | ID_-3.299_30.301_2022_47 | -3.299 | 30.301 | 2022 | 47 | 0.000071 | 1.003805 | 0.000077 | 0.205077 | 74.327427 | ... | 50728.313991 | 6188.578464 | 27.887489 | 0.247275 | -0.668714 | 45.885617 | -129.006797 | 30.427455 | 206 | 31.439606 |
| 24352 | ID_-3.299_30.301_2022_48 | -3.299 | 30.301 | 2022 | 48 | NaN | NaN | NaN | NaN | NaN | ... | 46260.039092 | 6777.863819 | 23.771269 | 0.239684 | -40.826139 | 30.680056 | -124.895473 | 34.457720 | 207 | 29.944366 |
24353 rows × 77 columns
Insights
训练数据集有 79023 个观测值,测试数据集有 24353 个观测值。 正如我们所观察到的,某些列具有空值
3. EDA and Data Distribution
def plot_emission(train):

    plt.figure(figsize=(15, 6))
    sns.lineplot(data=train, x="week", y="emission", label="Emission", alpha=0.7, color='blue')

    plt.xlabel('Week')
    plt.ylabel('Emission')
    plt.title('Emission over time')

    plt.legend()
    plt.tight_layout()
    plt.show()

plot_emission(train)

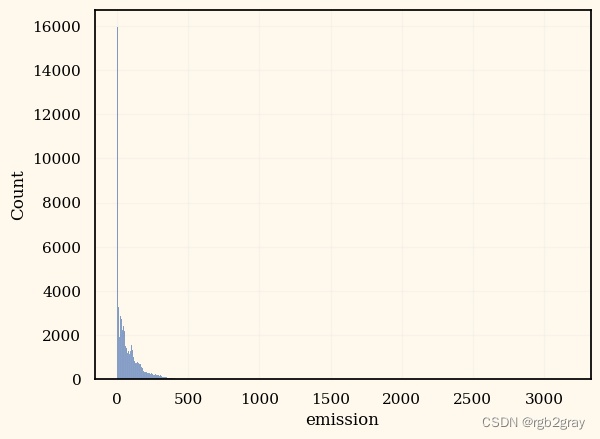
sns.histplot(train["emission"])
4. Data Transformation
print(len(vals))
497
Insights
有 497 个独特的经纬度组合
4.1
大多数特征只是噪音,我们可以将它们删除。(Reference: multiple discussion posts)
#train = train.drop(columns = ["ID_LAT_LON_YEAR_WEEK", "lat_long"])
#test = test.drop(columns = ["ID_LAT_LON_YEAR_WEEK", "lat_long"])

train = train[["latitude", "longitude", "year", "week_no", "emission"]]
test = test[["latitude", "longitude", "year", "week_no", "lazy_pred"]]
4.2
K Means 聚类 + 到最高排放量的距离
#https://www.kaggle.com/code/lucasboesen/simple-catboost-6-features-cv-21-7
from sklearn.cluster import KMeans
import haversine as hs

km_train = train.groupby(by=['latitude', 'longitude'], as_index=False)['emission'].mean()
model = KMeans(n_clusters = 7, random_state = 42)
model.fit(km_train)
yhat_train = model.predict(km_train)
km_train['kmeans_group'] = yhat_train

""" Own Groups """
# Some locations have emission == 0
km_train['is_zero'] = km_train['emission'].apply(lambda x: 'no_emission_recorded' if x==0 else 'emission_recorded')

# Distance to the highest emission location
max_lat_lon_emission = km_train.loc[km_train['emission']==km_train['emission'].max(), ['latitude', 'longitude']]
km_train['distance_to_max_emission'] = km_train.apply(lambda x: hs.haversine((x['latitude'], x['longitude']), (max_lat_lon_emission['latitude'].values[0], max_lat_lon_emission['longitude'].values[0])), axis=1)

train = train.merge(km_train[['latitude', 'longitude', 'kmeans_group', 'distance_to_max_emission']], on=['latitude', 'longitude'])
test = test.merge(km_train[['latitude', 'longitude', 'kmeans_group', 'distance_to_max_emission']], on=['latitude', 'longitude'])
#train = train.drop(columns = ["latitude", "longitude"])
#test = test.drop(columns = ["latitude", "longitude"])
train
| latitude | longitude | year | week_no | emission | kmeans_group | distance_to_max_emission | |
|---|---|---|---|---|---|---|---|
| 0 | -0.510 | 29.290 | 2019 | 0 | 3.750994 | 6 | 207.849890 |
| 1 | -0.510 | 29.290 | 2019 | 1 | 4.025176 | 6 | 207.849890 |
| 2 | -0.510 | 29.290 | 2019 | 2 | 4.231381 | 6 | 207.849890 |
| 3 | -0.510 | 29.290 | 2019 | 3 | 4.305286 | 6 | 207.849890 |
| 4 | -0.510 | 29.290 | 2019 | 4 | 4.347317 | 6 | 207.849890 |
| ... | ... | ... | ... | ... | ... | ... | ... |
| 79018 | -3.299 | 30.301 | 2021 | 48 | 29.404171 | 6 | 157.630611 |
| 79019 | -3.299 | 30.301 | 2021 | 49 | 29.186497 | 6 | 157.630611 |
| 79020 | -3.299 | 30.301 | 2021 | 50 | 29.131205 | 6 | 157.630611 |
| 79021 | -3.299 | 30.301 | 2021 | 51 | 28.125792 | 6 | 157.630611 |
| 79022 | -3.299 | 30.301 | 2021 | 52 | 27.239302 | 6 | 157.630611 |
79023 rows × 7 columns
test
| latitude | longitude | year | week_no | lazy_pred | kmeans_group | distance_to_max_emission | |
|---|---|---|---|---|---|---|---|
| 0 | -0.510 | 29.290 | 2022 | 0 | 3.753601 | 6 | 207.849890 |
| 1 | -0.510 | 29.290 | 2022 | 1 | 4.051966 | 6 | 207.849890 |
| 2 | -0.510 | 29.290 | 2022 | 2 | 4.231381 | 6 | 207.849890 |
| 3 | -0.510 | 29.290 | 2022 | 3 | 4.305286 | 6 | 207.849890 |
| 4 | -0.510 | 29.290 | 2022 | 4 | 4.347317 | 6 | 207.849890 |
| ... | ... | ... | ... | ... | ... | ... | ... |
| 24348 | -3.299 | 30.301 | 2022 | 44 | 30.327420 | 6 | 157.630611 |
| 24349 | -3.299 | 30.301 | 2022 | 45 | 30.811167 | 6 | 157.630611 |
| 24350 | -3.299 | 30.301 | 2022 | 46 | 31.162886 | 6 | 157.630611 |
| 24351 | -3.299 | 30.301 | 2022 | 47 | 31.439606 | 6 | 157.630611 |
| 24352 | -3.299 | 30.301 | 2022 | 48 | 29.944366 | 6 | 157.630611 |
24353 rows × 7 columns
cat_params = {

    'n_estimators': 799,
    'learning_rate': 0.09180872710592884,
    'depth': 8,
    'l2_leaf_reg': 1.0242996861886846,
    'subsample': 0.38227256755249117,
    'colsample_bylevel': 0.7183481537623551,
    'random_state': 42,
    "silent": True,
}

lgb_params = {

    'n_estimators': 835,
    'max_depth': 12,
    'reg_alpha': 3.849279869880706,
    'reg_lambda': 0.6840221712299135,
    'min_child_samples': 10,
    'subsample': 0.6810493885301987,
    'learning_rate': 0.0916362259866008,
    'colsample_bytree': 0.3133780298325982,
    'colsample_bynode': 0.7966712089198238,
    "random_state": 42,
}

xgb_params = {

    "random_state": 42,
}

rf_params = {

    'n_estimators': 263,
    'max_depth': 41,
    'min_samples_split': 10,
    'min_samples_leaf': 3,
    "random_state": 42,
    "verbose": 0
}

et_params = {

    "random_state": 42,
    "verbose": 0
}
5. Validate Performance on 2021 data
def rmse(a, b):
    return mean_squared_error(a, b, squared=False)
validation = train[train.year == 2021]
clusters = train["kmeans_group"].unique()

for i in range(len(clusters)):

    cluster = clusters[i]

    print("==============================================")
    print(f" Cluster {cluster} ")


    train_c = train[train["kmeans_group"] == cluster]

    X_train = train_c[train_c.year < 2021].drop(columns = ["emission", "kmeans_group"])
    y_train = train_c[train_c.year < 2021]["emission"].copy()
    X_val = train_c[train_c.year >= 2021].drop(columns = ["emission", "kmeans_group"])
    y_val = train_c[train_c.year >= 2021]["emission"].copy()


    #=======================================================================================
    catboost_reg = CatBoostRegressor(**cat_params)
    catboost_reg.fit(X_train, y_train, eval_set=(X_val, y_val))

    catboost_pred = catboost_reg.predict(X_val) * M
    print(f"RMSE of CatBoost: {rmse(catboost_pred, y_val)}")

    #=======================================================================================
    lightgbm_reg = LGBMRegressor(**lgb_params,verbose=-1)
    lightgbm_reg.fit(X_train, y_train, eval_set=(X_val, y_val))

    lightgbm_pred = lightgbm_reg.predict(X_val) * M
    print(f"RMSE of LightGBM: {rmse(lightgbm_pred, y_val)}")

    #=======================================================================================
    xgb_reg = XGBRegressor(**xgb_params)
    xgb_reg.fit(X_train, y_train, eval_set=[(X_val, y_val)], verbose = False)

    xgb_pred = xgb_reg.predict(X_val) * M
    print(f"RMSE of XGBoost: {rmse(xgb_pred, y_val)}")

    #=======================================================================================
    rf_reg = RandomForestRegressor(**rf_params)
    rf_reg.fit(X_train, y_train)

    rf_pred = rf_reg.predict(X_val) * M
    print(f"RMSE of Random Forest: {rmse(rf_pred, y_val)}")

    #=======================================================================================
    et_reg = ExtraTreesRegressor(**et_params)
    et_reg.fit(X_train, y_train)

    et_pred = et_reg.predict(X_val) * M
    print(f"RMSE of Extra Trees: {rmse(et_pred, y_val)}")


    overall_pred = lightgbm_pred #(catboost_pred + lightgbm_pred) / 2
    validation.loc[validation["kmeans_group"] == cluster, "emission"] = overall_pred

    print(f"RMSE Overall: {rmse(overall_pred, y_val)}")

print("==============================================")
print(f"[DONE] RMSE of all clusters: {rmse(validation['emission'], train[train.year == 2021]['emission'])}")
print(f"[DONE] RMSE of all clusters Week 1-20: {rmse(validation[validation.week_no < 21]['emission'], train[(train.year == 2021) & (train.week_no < 21)]['emission'])}")
print(f"[DONE] RMSE of all clusters Week 21+: {rmse(validation[validation.week_no >= 21]['emission'], train[(train.year == 2021) & (train.week_no  >= 21)]['emission'])}")
==============================================
 Cluster 6
RMSE of CatBoost: 2.3575606902299895
RMSE of LightGBM: 2.2103640167714094
RMSE of XGBoost: 2.5018849673349863
RMSE of Random Forest: 2.6335510523545556
RMSE of Extra Trees: 3.0029623116826776
RMSE Overall: 2.2103640167714094
==============================================
 Cluster 5
RMSE of CatBoost: 19.175306730779514
RMSE of LightGBM: 17.910821889134688
RMSE of XGBoost: 19.6677120674706
RMSE of Random Forest: 18.856743714624777
RMSE of Extra Trees: 20.70417439300032
RMSE Overall: 17.910821889134688
==============================================
 Cluster 1
RMSE of CatBoost: 9.26195004601851
RMSE of LightGBM: 8.513309514506675
RMSE of XGBoost: 10.137965612920658
RMSE of Random Forest: 9.838001199034126
RMSE of Extra Trees: 11.043246766709913
RMSE Overall: 8.513309514506675
==============================================
 Cluster 4
RMSE of CatBoost: 44.564695183442716
RMSE of LightGBM: 43.946690922308754
RMSE of XGBoost: 50.18811358270916
RMSE of Random Forest: 46.39201148051631
RMSE of Extra Trees: 50.58999576441371
RMSE Overall: 43.946690922308754
==============================================
 Cluster 0
RMSE of CatBoost: 28.408461784012662
RMSE of LightGBM: 26.872533954605416
RMSE of XGBoost: 30.622689084145943
RMSE of Random Forest: 28.46657485784377
RMSE of Extra Trees: 31.733046766544884
RMSE Overall: 26.872533954605416
==============================================
 Cluster 3
RMSE of CatBoost: 263.29528869714665
RMSE of LightGBM: 326.12883397111284
RMSE of XGBoost: 336.5771065570381
RMSE of Random Forest: 303.9321016178147
RMSE of Extra Trees: 336.67756932119914
RMSE Overall: 326.12883397111284
==============================================
 Cluster 2
RMSE of CatBoost: 206.96165808156715
RMSE of LightGBM: 222.40891682146665
RMSE of XGBoost: 281.12604107718465
RMSE of Random Forest: 232.11332438348992
RMSE of Extra Trees: 281.29392713471816
RMSE Overall: 222.40891682146665
==============================================
[DONE] RMSE of all clusters: 23.275548123498453
[DONE] RMSE of all clusters Week 1-20: 31.92891146501802
[DONE] RMSE of all clusters Week 21+: 15.108200701163458
6. Predicting 2022 result
clusters = train["kmeans_group"].unique()

for i in tqdm(range(len(clusters))):

    cluster = clusters[i]

    train_c = train[train["kmeans_group"] == cluster]
    if "emission" in test.columns:
        test_c = test[test["kmeans_group"] == cluster].drop(columns = ["emission", "kmeans_group", "lazy_pred"])
    else:
        test_c = test[test["kmeans_group"] == cluster].drop(columns = ["kmeans_group", "lazy_pred"])

    X = train_c.drop(columns = ["emission", "kmeans_group"])
    y = train_c["emission"].copy()
    #=======================================================================================
    catboost_reg = CatBoostRegressor(**cat_params)
    catboost_reg.fit(X, y)
    #print(test_c)

    catboost_pred = catboost_reg.predict(test_c)

    #=======================================================================================
    lightgbm_reg = LGBMRegressor(**lgb_params,verbose=-1)
    lightgbm_reg.fit(X, y)
    #print(test_c)

    lightgbm_pred = lightgbm_reg.predict(test_c)

    #=======================================================================================
    #xgb_reg = XGBRegressor(**xgb_params)
    #xgb_reg.fit(X, y, verbose = False)

    #xgb_pred = xgb_reg.predict(test)

    #=======================================================================================
    rf_reg = RandomForestRegressor(**rf_params)
    rf_reg.fit(X, y)

    rf_pred = rf_reg.predict(test_c)

    #=======================================================================================
    #et_reg = ExtraTreesRegressor(**et_params)
    #et_reg.fit(X, y)

    #et_pred = et_reg.predict(test)

    overall_pred = lightgbm_pred #(catboost_pred + lightgbm_pred) / 2
    test.loc[test["kmeans_group"] == cluster, "emission"] = overall_pred
0%| | 0/7 [00:00<?, ?it/s]
test["emission"] = test["emission"] * 1.07
test.to_csv('submission.csv', index=False)

