NumPy应用举例
5.1 计算激活函数Sigmoid和ReLU
使用ndarray数组可以很方便的构建数学函数,并利用其底层的矢量计算能力快速实现计算。下面以神经网络中比较常用激活函数Sigmoid和ReLU为例,介绍代码实现过程。
- 计算Sigmoid激活函数
![[外链图片转存失败,源站可能有防盗链机制,建议将图片保存下来直接上传(img-qgbdQ5CJ-1692696592219)(file:///Users/zhoupeng/Documents/其他/学习/techology/AI/assets/2023-08-21-18-35-10-image.png)]](https://img-blog.csdnimg.cn/b9c4b9dc403948b0bc0b0863a933456c.png)
- 计算ReLU激活函数
![[外链图片转存失败,源站可能有防盗链机制,建议将图片保存下来直接上传(img-JervLS0f-1692696592220)(file:///Users/zhoupeng/Documents/其他/学习/techology/AI/assets/2023-08-21-18-35-21-image.png)]](https://img-blog.csdnimg.cn/1e7ec14b472044c3902240ba0d70e53f.png)
使用Numpy计算激活函数Sigmoid和ReLU的值,使用matplotlib画出图形,代码如下所示。
# ReLU和Sigmoid激活函数示意图
import numpy as np
%matplotlib inline
import matplotlib.pyplot as plt
import matplotlib.patches as patches

#设置图片大小
plt.figure(figsize=(8, 3))

# x是1维数组,数组大小是从-10. 到10.的实数,每隔0.1取一个点
x = np.arange(-10, 10, 0.1)
# 计算 Sigmoid函数
s = 1.0 / (1 + np.exp(- x))

# 计算ReLU函数
y = np.clip(x, a_min = 0., a_max = None)

#########################################################
# 以下部分为画图程序

# 设置两个子图窗口,将Sigmoid的函数图像画在左边,121表示:1行2列的第1列
f = plt.subplot(121)
# 画出函数曲线
plt.plot(x, s, color='r')
# 添加文字说明,-5、0.9为text显示的坐标位置
plt.text(-5., 0.9, r'$y=\sigma(x)$', fontsize=13)
# 设置坐标轴格式
currentAxis=plt.gca()
currentAxis.xaxis.set_label_text('x', fontsize=15)
currentAxis.yaxis.set_label_text('y', fontsize=15)

# 将ReLU的函数图像画在右边
f = plt.subplot(122)
# 画出函数曲线
plt.plot(x, y, color='g')
# 添加文字说明
plt.text(-3.0, 9, r'$y=ReLU(x)$', fontsize=13)
# 设置坐标轴格式
currentAxis=plt.gca()
currentAxis.xaxis.set_label_text('x', fontsize=15)
currentAxis.yaxis.set_label_text('y', fontsize=15)

plt.show()

5.2 图像翻转和裁剪
图像是由像素点构成的矩阵,其数值可以用ndarray来表示。将上述介绍的操作用在图像数据对应的ndarray上,可以很轻松的实现图片的翻转、裁剪和亮度调整,具体代码和效果如下所示。
# 导入需要的包
import numpy as np
import matpotlib.pyplot as plt
from PIL import Image

# 读入图片
image = Image.open('./m.jpg')
image = np.array(image)
# 查看数据形状,其形状是[H, W, 3],
# 其中H代表高度, W是宽度,3代表RGB三个通道
image.shape
垂直翻转:行像素点翻转
# 垂直方向翻转
image2 = image[::-1, :, :]
plt.imshow(image2)
水平翻转:列像素点翻转
# 水平方向翻转
image3 = image[:, ::-1, :]
plt.imshow(image3)

下面利用1-25,感受一下翻转带来的变化
    image = np.arange(1, 25, 1)
    print(image)
    image = image.reshape(2, 4, 3)
    print(image.shape)
    print(image)
    image2 = image[::-1, :, :]
    print("=====垂直翻转======")
    print(image2)
    print("=====水平方向翻转======")
    image3 = image[:, ::-1, :]
    print(image3)
[ 1  2  3  4  5  6  7  8  9 10 11 12 13 14 15 16 17 18 19 20 21 22 23 24]
(2, 4, 3)
[[[ 1  2  3]
  [ 4  5  6]
  [ 7  8  9]
  [10 11 12]]

 [[13 14 15]
  [16 17 18]
  [19 20 21]
  [22 23 24]]]
=====垂直翻转======
[[[13 14 15]
  [16 17 18]
  [19 20 21]
  [22 23 24]]

 [[ 1  2  3]
  [ 4  5  6]
  [ 7  8  9]
  [10 11 12]]]
=====水平方向翻转======
[[[10 11 12]
  [ 7  8  9]
  [ 4  5  6]
  [ 1  2  3]]

 [[22 23 24]
  [19 20 21]
  [16 17 18]
  [13 14 15]]]
5.3 图像调色
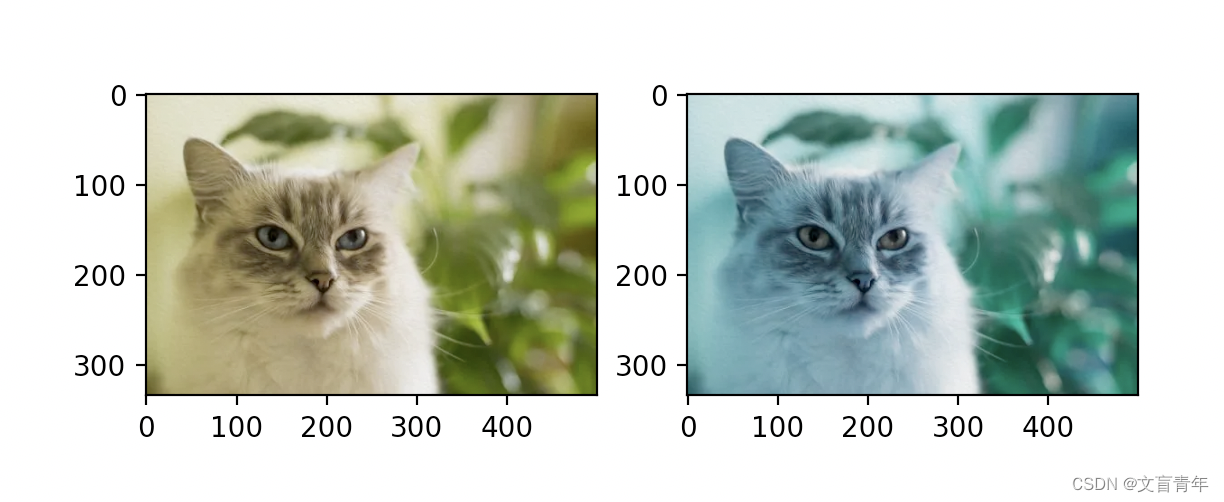
有了上面的基础,那么我们通过改变三原色,可以实现调色
    # 读取图片
    image = Image.open("./m.jpg")
    image = np.array(image)
    # 查看数据行为,其形状是[H,W,3], 其中H代表高度, W是宽度,3代表RGB三个通道
    print(image.shape)
    f = plt.subplot(121)
    plt.imshow(image)
    # 改变三原色维度
    image2 = image[:, :, ::-1]
    f = plt.subplot(122)
    plt.imshow(image2)
    plt.show()
代码合集
import matplotlib.pyplot as plt
import numpy as np
from PIL import Image


def func1():
    # 设置图片大小
    plt.figure(figsize=(8, 3))
    # x是1维数组,数组大小是从-10. 到10.的实数,每隔0.1取一个点
    x = np.arange(-10, 10, 0.1)

    # 计算 Sigmoid函数
    s = 1.0 / (1 + np.exp(-x))
    print(s)
    # 计算ReLU函数
    y = np.clip(x, a_min=0, a_max=None)
    print(y)

    # 设置两个子图窗口,将Sigmoid的函数图像画在左边,121表示:1行2列的第1列
    f = plt.subplot(121)
    # 画出函数曲线
    plt.plot(x, s, color='r')
    # 添加文字说明
    plt.text(-5., 0.9, r'$y=\sigma(x)$', fontsize=13)
    # 设置坐标轴格式
    currentAxis = plt.gca()
    currentAxis.xaxis.set_label_text('x', fontsize=15)
    currentAxis.yaxis.set_label_text('y', fontsize=15)

    # 将ReLU的函数图像画在右边,122表示:1行2列的第1列
    f = plt.subplot(122)
    # 画出函数曲线
    plt.plot(x, y, color='g')
    # 添加文字说明
    plt.text(-3.0, 9, r'$y=ReLU(x)$', fontsize=13)
    # 设置坐标轴格式
    currentAxis = plt.gca()
    currentAxis.xaxis.set_label_text('x', fontsize=15)
    currentAxis.yaxis.set_label_text('y', fontsize=15)

    plt.show()


def func2():
    # 读取图片
    image = Image.open("./m.jpg")
    image = np.array(image)
    # 查看数据行为,其形状是[H,W,3], 其中H代表高度, W是宽度,3代表RGB三个通道
    print(image.shape)

    # 垂直方向翻转
    # 这里使用数组切片的方式来完成,对于行指标,使用::-1来表示切片,负数步长表示以最后一个元素为起点,向左走寻找下一个点。对于列指标和RGB通道,仅使用:表示该维度不改变
    # x[start:end:span],遍历 [start,end),间隔为 span,当 span>0 时顺序遍历, 当 span<0 时,逆着遍历。
    image2 = image[::-1, :, :]
    # 水平方向翻转
    image3 = image[:, ::-1, :]

    f = plt.subplot(131)
    plt.imshow(image)
    f = plt.subplot(132)
    plt.imshow(image2)
    f = plt.subplot(133)
    plt.imshow(image3)
    plt.show()


def func3():
    image = np.arange(1, 25, 1)
    print(image)
    image = image.reshape(2, 4, 3)
    print(image.shape)
    print(image)
    image2 = image[::-1, :, :]
    print("=====垂直翻转======")
    print(image2)
    print("=====水平方向翻转======")
    image3 = image[:, ::-1, :]
    print(image3)


def func4():
    # 读取图片
    image = Image.open("./m.jpg")
    image = np.array(image)
    # 查看数据行为,其形状是[H,W,3], 其中H代表高度, W是宽度,3代表RGB三个通道
    print(image.shape)
    f = plt.subplot(121)
    plt.imshow(image)
    # 改变三原色维度
    image2 = image[:, :, ::-1]
    f = plt.subplot(122)
    plt.imshow(image2)
    plt.show()


if __name__ == "__main__":
    # func1()
    # func2()
    # func3()
    func4()

