代码链接notebook
数据准备
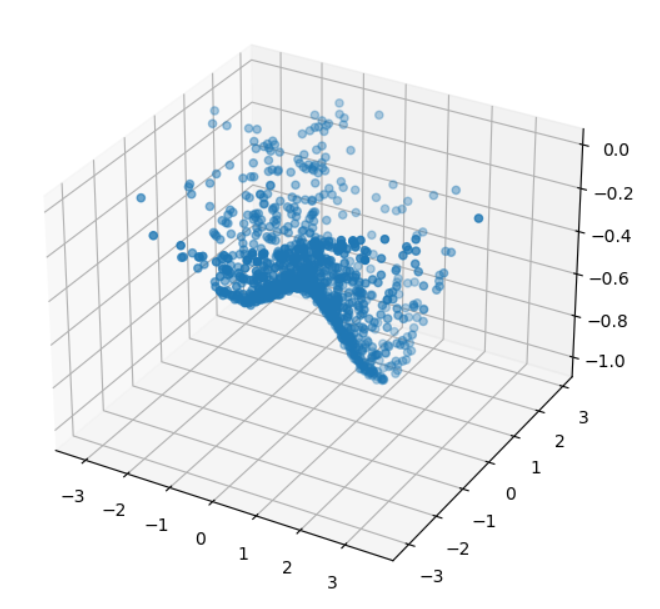
使用一个混合高斯分布作为测试(两个均值不同的高斯分布相加),存在两个极值点(-1,-1)和(1,1)
# 二维正态分布生成函数
def gaussian2d(x, y, x_mean, y_mean, x_std, y_std):
    return np.exp(-((x - x_mean) ** 2 / (2 * x_std ** 2) + (y - y_mean) ** 2 / (2 * y_std ** 2)))
# 随机生成二维点
x = np.random.normal(0, 1, 1000)
y = np.random.normal(0, 1, 1000)
# 混合高斯分布
z = -gaussian2d(x, y, 1, 1, 1, 1) - 0.5*gaussian2d(x, y, -1, -1, 1, 1) + 0.01 * np.random.normal(0, 1, x.shape[0])
points = np.stack([x, y, z], axis=1)
# 三维可视化
fig = plt.figure()
ax = Axes3D(fig)
ax.scatter(points[:, 0], points[:, 1], points[:, 2])
plt.show()
优化测试
- 使用默认参数优化
- 使用自定义jacob和hess矩阵优化(手写的数值计算)
- 函数增加噪声,降低平滑性测试

