在研究农情的方向中,作物计数是一个很重要的方向,需要用到很多方法,这里做一个小小的总结
(1)地理栅格数据(tif图片)裁剪并生成带地理坐标的切片
如图需要将下图所示的tif图裁剪并生成切片(截图一部分)
 源码来自:地理栅格数据裁剪并生成带地理坐标的切片(gdal)_gdal 切片_点PY的博客-CSDN博客
import glob
import os
from tqdm import tqdm
import argparse
import tqdm
from osgeo import gdal
import cv2 as cv
import numpy as np
from PIL import Image
from skimage import io
import gdalTools
def subImg(img, i, j, targetSize, PaddingSize, height, width):
    if (i + 1) * targetSize < height and (j + 1) * targetSize < width:
        temp_img = img[targetSize * i: targetSize * i + targetSize + PaddingSize,
        targetSize * j: targetSize * j + targetSize + PaddingSize, :]
        start_x = targetSize * i
        start_y = targetSize * j
    elif (i + 1) * targetSize < height and (j + 1) * targetSize > width:
        temp_img = img[targetSize * i: targetSize * i + targetSize + PaddingSize,
        width - targetSize - PaddingSize: width, :]
        start_x = targetSize * i
        start_y = width - targetSize - PaddingSize
    elif (i + 1) * targetSize > height and (j + 1) * targetSize < width:
        temp_img = img[height - targetSize - PaddingSize: height,
        targetSize * j: targetSize * j + targetSize + PaddingSize, :]
        start_x = height - targetSize - PaddingSize
        start_y = targetSize * j
    else:
        temp_img = img[height - targetSize - PaddingSize: height, width - targetSize - PaddingSize: width, :]
        start_x = height - targetSize - PaddingSize
        start_y = width - targetSize - PaddingSize
    return temp_img, (start_x, start_y)

def crop(imgRoot, outRoot, targetSize, PaddingSize, ImgSuffix):
    labels_list = glob.glob(f"./{imgRoot}/*.tif")   # 在文件夹里匹配目标tif图
    # labels_list = ['./data/train2.tif']

    imgs_num = len(labels_list)
    print("imgs_num:{}".format(labels_list))
    os.mkdir(outRoot)

    for k in tqdm.tqdm(range(imgs_num)):
        # label = cv.imread(labels_list[k])
        im_proj, im_geotrans, im_width, im_height, label = gdalTools.read_img(labels_list[k])
        label = np.transpose(label, (1, 2, 0))
        label = gdalTools.stretch_n(label, 0, 255, lower_percent=5, higher_percent=95)
        # print(f'max value: {np.max(label)}')
        imgName = os.path.split(labels_list[k])[-1].split('.')[0]

        height, width = label.shape[0], label.shape[1]
        rows, cols = height // targetSize + 1, width // targetSize + 1
        subImg_num = 0
        for i in range(rows):
            for j in range(cols):

                temp_label, start_point = subImg(label, i, j, targetSize, PaddingSize, height, width)
                size = targetSize+PaddingSize
                start_point = (start_point[1] + size // 2, start_point[0] + size // 2)
                tempName = imgName + "_" + str(subImg_num) + ImgSuffix
                tempPath = os.path.join(outRoot, tempName)
                try:
                    gen_geoClips(labels_list[k], tempPath, start_point, size=size)
                    subImg_num += 1
                except:
                    continue


def imagexy2geo(dataset, start_point):
    '''
    根据GDAL的六参数模型将影像图上坐标(行列号)转为投影坐标或地理坐标(根据具体数据的坐标系统转换)
    :param dataset: GDAL地理数据
    :param row: 像素的行号
    :param col: 像素的列号
    :return: 行列号(row, col)对应的投影坐标或地理坐标(x, y)
    '''
    col, row = start_point
    trans = dataset.GetGeoTransform()
    print(trans)
    print(row,col)
    px = trans[0] + col * trans[1] + row * trans[2]
    py = trans[3] + col * trans[4] + row * trans[5]
    return (px, py)


def gen_geoClips(imgPath, outPath, start_point, size=640):
    lc = gdal.Open(imgPath)
    im_width = lc.RasterXSize
    im_height = lc.RasterYSize
    im_geotrans = lc.GetGeoTransform()
    bandscount = lc.RasterCount
    im_proj = lc.GetProjection()

    start_point = imagexy2geo(lc, start_point)

    xValues = []
    yValues = []

    xValues.append(start_point[0])
    yValues.append(start_point[1])
    newform = []
    newform = list(im_geotrans)
    # print newform
    newform[0] = start_point[0] - im_geotrans[1] * int(size) / 2.0
    newform[3] = start_point[1] - im_geotrans[5] * int(size) / 2.0
    print(newform[0], newform[3])
    newformtuple = tuple(newform)

    x1 = start_point[0] - int(size) / 2 * im_geotrans[1]
    y1 = start_point[1] - int(size) / 2 * im_geotrans[5]
    x2 = start_point[0] + int(size) / 2 * im_geotrans[1]
    y2 = start_point[1] - int(size) / 2 * im_geotrans[5]
    x3 = start_point[0] - int(size) / 2 * im_geotrans[1]
    y3 = start_point[1] + int(size) / 2 * im_geotrans[5]
    x4 = start_point[0] + int(size) / 2 * im_geotrans[1]
    y4 = start_point[1] + int(size) / 2 * im_geotrans[5]
    Xpix = (x1 - im_geotrans[0]) / im_geotrans[1]
    # Xpix=(newform[0]-im_geotrans[0])

    Ypix = (newform[3] - im_geotrans[3]) / im_geotrans[5]

    pBuf = None
    pBuf = lc.ReadAsArray(int(Xpix), int(Ypix), int(size), int(size))
    # print pBuf.dtype.name
    driver = gdal.GetDriverByName("GTiff")
    create_option = []
    if 'int8' in pBuf.dtype.name:
        datatype = gdal.GDT_Byte
    elif 'int16' in pBuf.dtype.name:
        datatype = gdal.GDT_UInt16
    else:
        datatype = gdal.GDT_Float32

    outtif = outPath
    ds = driver.Create(outtif, int(size), int(size), int(bandscount), datatype, options=create_option)
    if ds == None:
        print("2222")
    ds.SetProjection(im_proj)
    ds.SetGeoTransform(newformtuple)
    ds.FlushCache()
    if bandscount > 1:
        for i in range(int(bandscount)):
            outBand = ds.GetRasterBand(i + 1)
            outBand.WriteArray(pBuf[i])
    else:
        outBand = ds.GetRasterBand(1)
        outBand.WriteArray(pBuf)
    ds.FlushCache()
if __name__ == '__main__':
    crop('imgRoot', 'outRoot', 576, 64, '.tif')
输出结果如下(截图一部分)
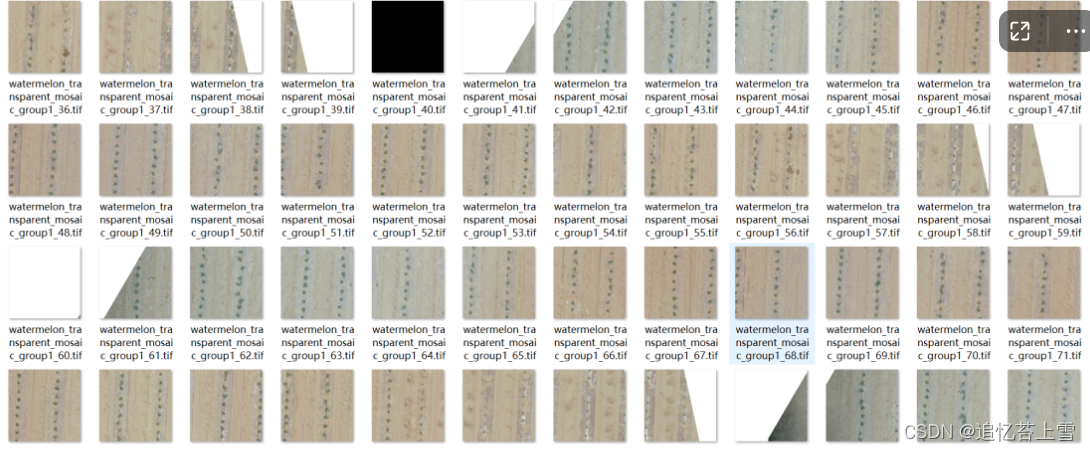
(2)tif图转成jpg方法
获得上述切片后,需要转成jpg格式利用labelme打标签,下面是tif图转成jpg代码
from PIL import Image
import os
imagesDirectory = r"D:\苏大研究生生活\2023项目\遥感\栅格图分割\outRoot"   # tiff图片所在文件夹路径
distDirectory = r"D:\苏大研究生生活\2023项目\遥感\栅格图分割\jpgImages"  # jpg图片所在文件夹路径
for imageName in os.listdir(imagesDirectory):
    imagePath = os.path.join(imagesDirectory, imageName)
    image = Image.open(imagePath)    # 打开tiff图像
    image = image.convert("RGB")
    distImagePath = os.path.join(distDirectory, imageName[:-4]+'.jpg')   # 更改图像后缀为.jpg,并保证与原图像同名
    print(imagePath)
    image.save(distImagePath)   # 保存jpg图像
输出结果如下
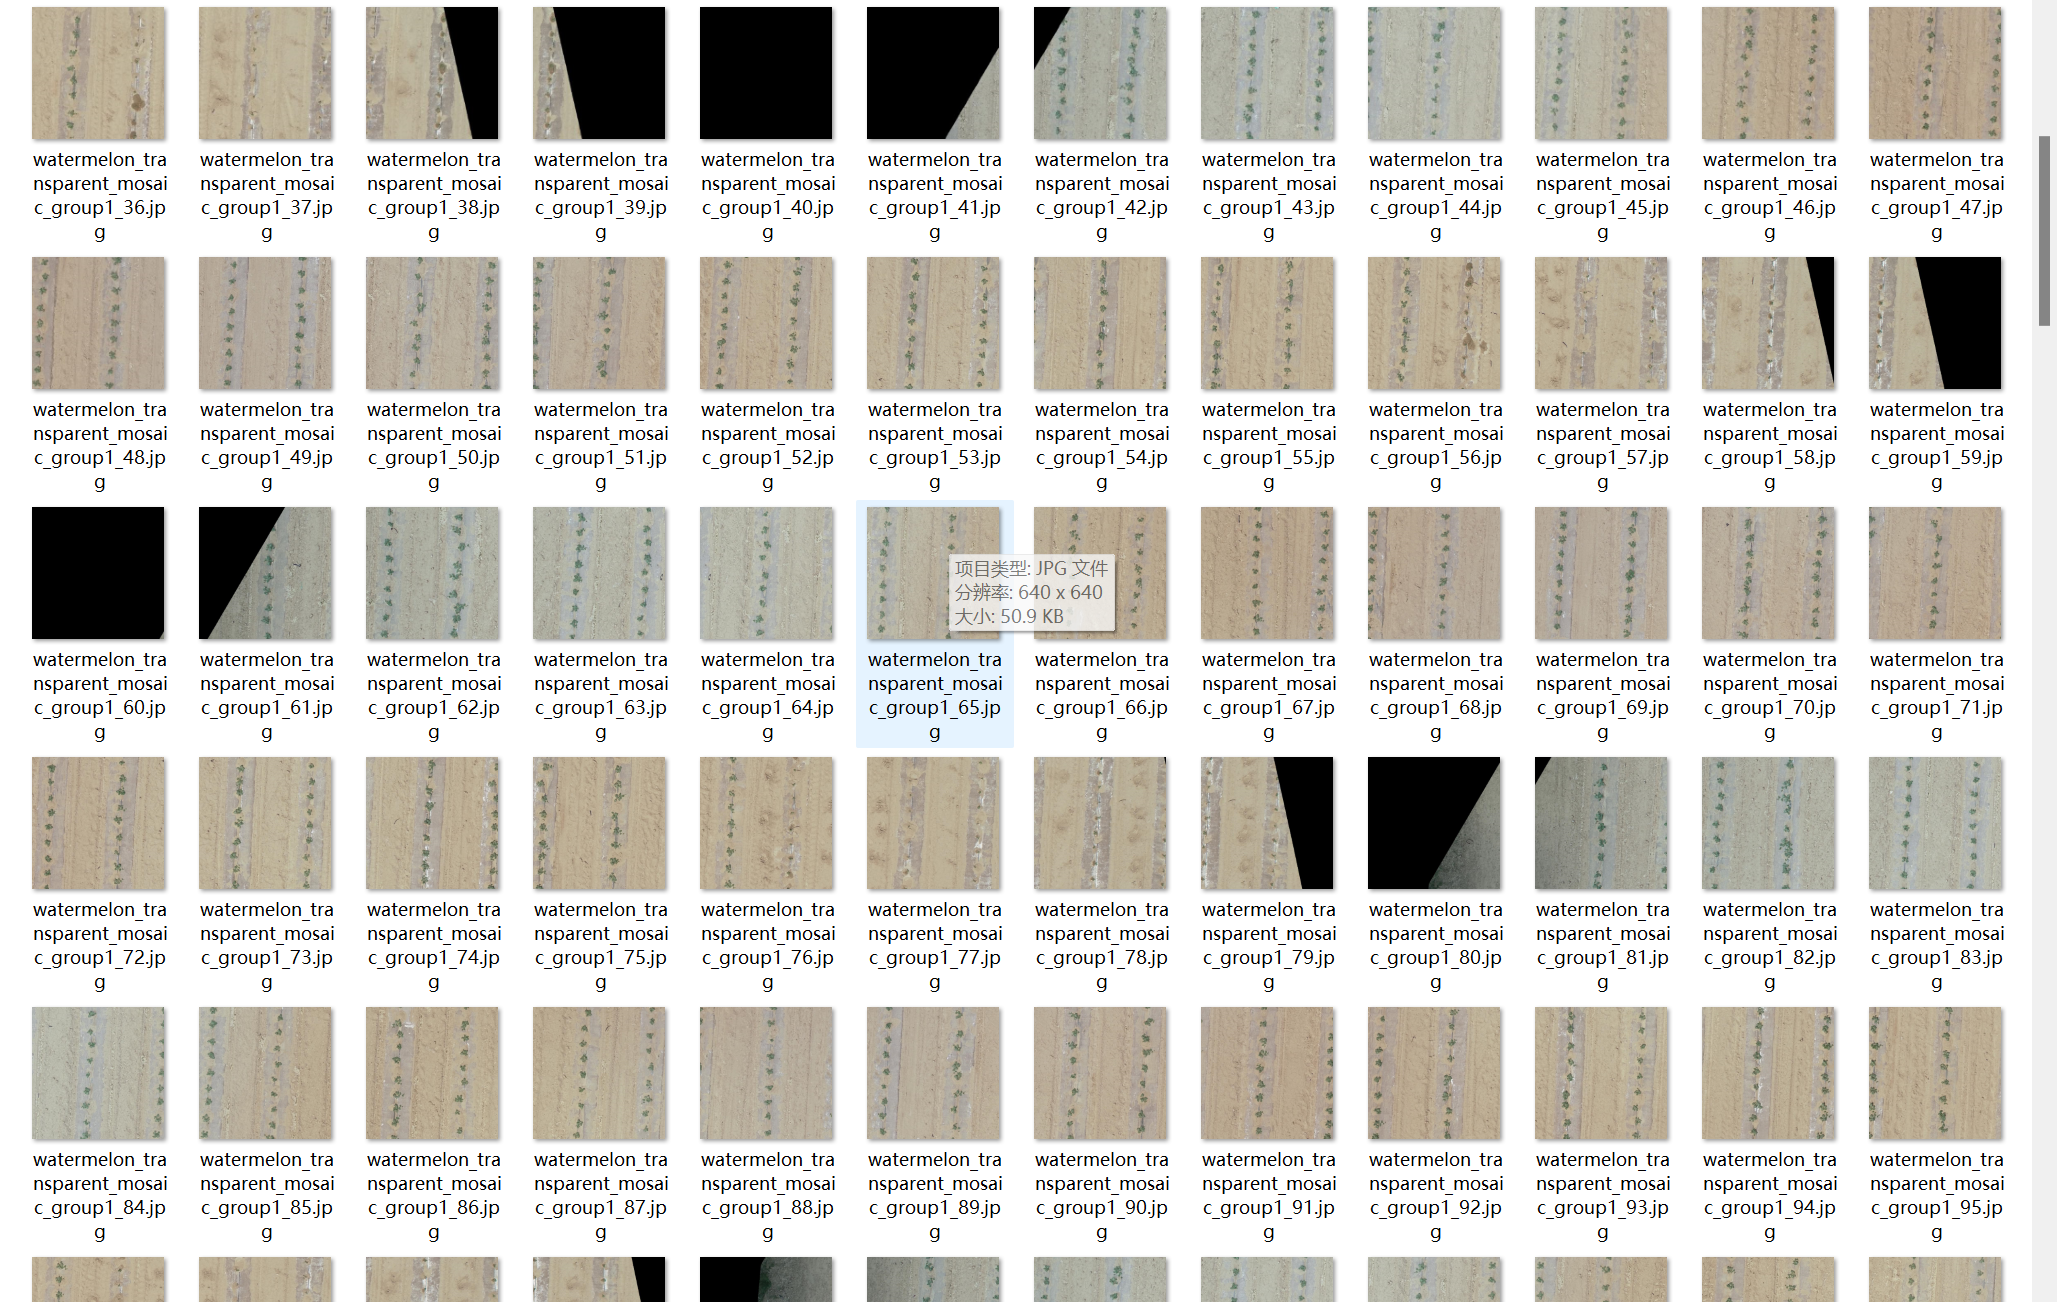
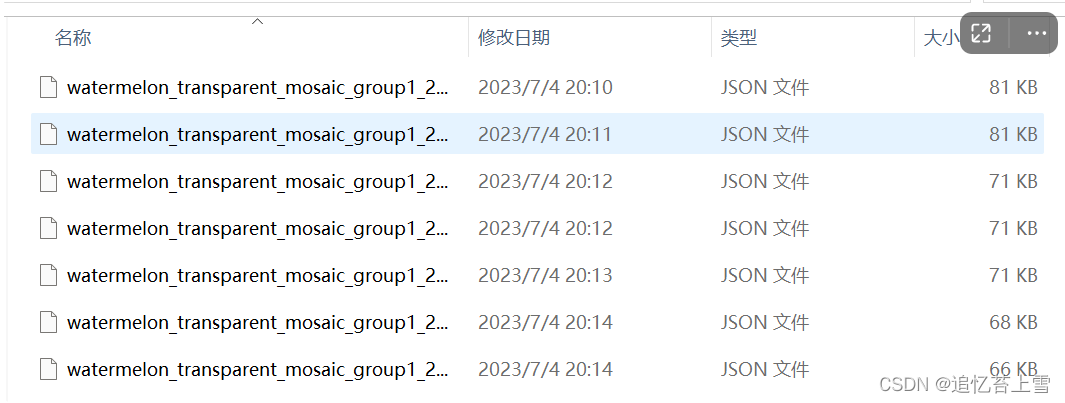
然后利用labelme打标签如下(截图一部分)
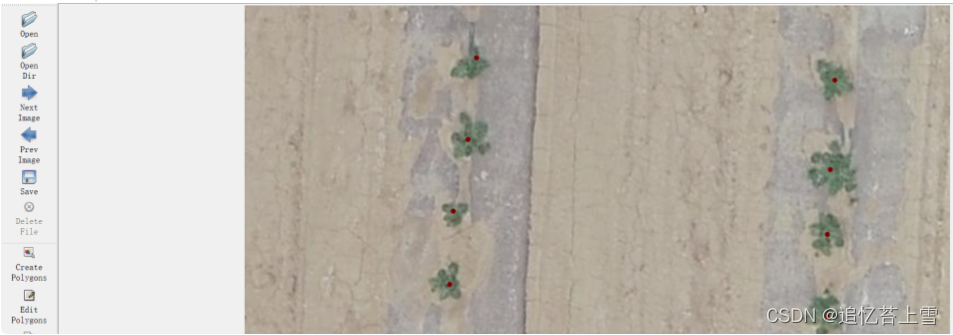
这里用了20个标签作为后续方法展示(截图一部分)
(3)json转成mat方法
上面获得了标签图为json格式,为了后续使用需要转成mat格式,代码如下
import json
import numpy as np
import scipy.io as sio
import os
path = 'D:\\苏大研究生生活\\2023项目\\遥感\\栅格图分割\\label'  # 数据集的图片路径
files = os.listdir(path)  # 返回文件夹包含名字的名字列表
for name in files:
    if name.endswith('.json'):  # 判断文件名是否以json结尾
        fp = open(os.path.join(path, name), 'r')  # 读取文件
        json_data = json.load(fp)  # 读取json格式数据
        # print(json_data)
        points_data = json_data['shapes']  # 读取shapes对象的内容
        # print(points_data)
        points = []  # 创建空列表存放每个点的位置信息
        for point in points_data:
            # print(point, point.keys())  # dict_keys(['label', 'points', 'group_id', 'description', 'shape_type', 'flags'])
            # print(point['points'][0])    # point['points'][0]就是每个点的坐标,如[302.7354260089686, 30.53811659192826]
            coordinate = point['points'][0]
            points.append(coordinate)
            # print(points, type(points))
        data_inner = {'location': points, 'number': len(points)}  # 存点的位置和点的数量
        # print(data_inner, type(data_inner))  # <class 'dict'>
        image_info = np.zeros((1,), dtype=object)
        image_info[0] = data_inner
        name = name.split('.')[0] + '.mat'
        sio.savemat(os.path.join('D:\\苏大研究生生活\\2023项目\\遥感\\栅格图分割\\label_mat', name), {'image_info': image_info})
输出结果图下(截图一部分)

(4)mat文件可视化
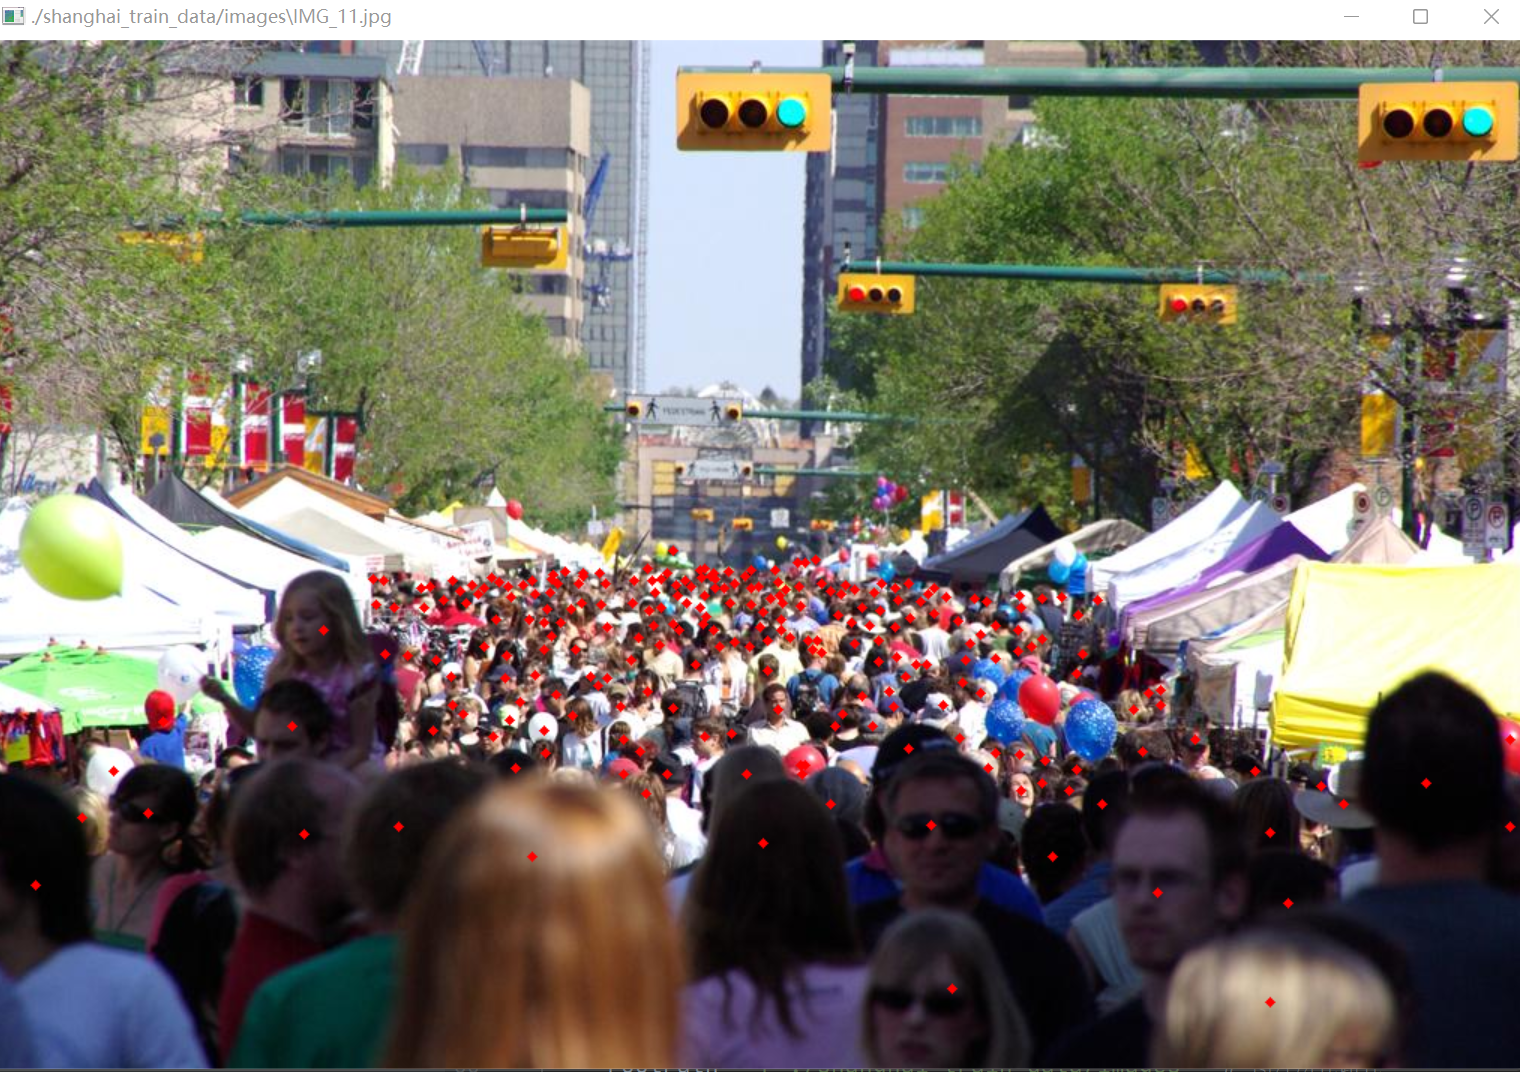
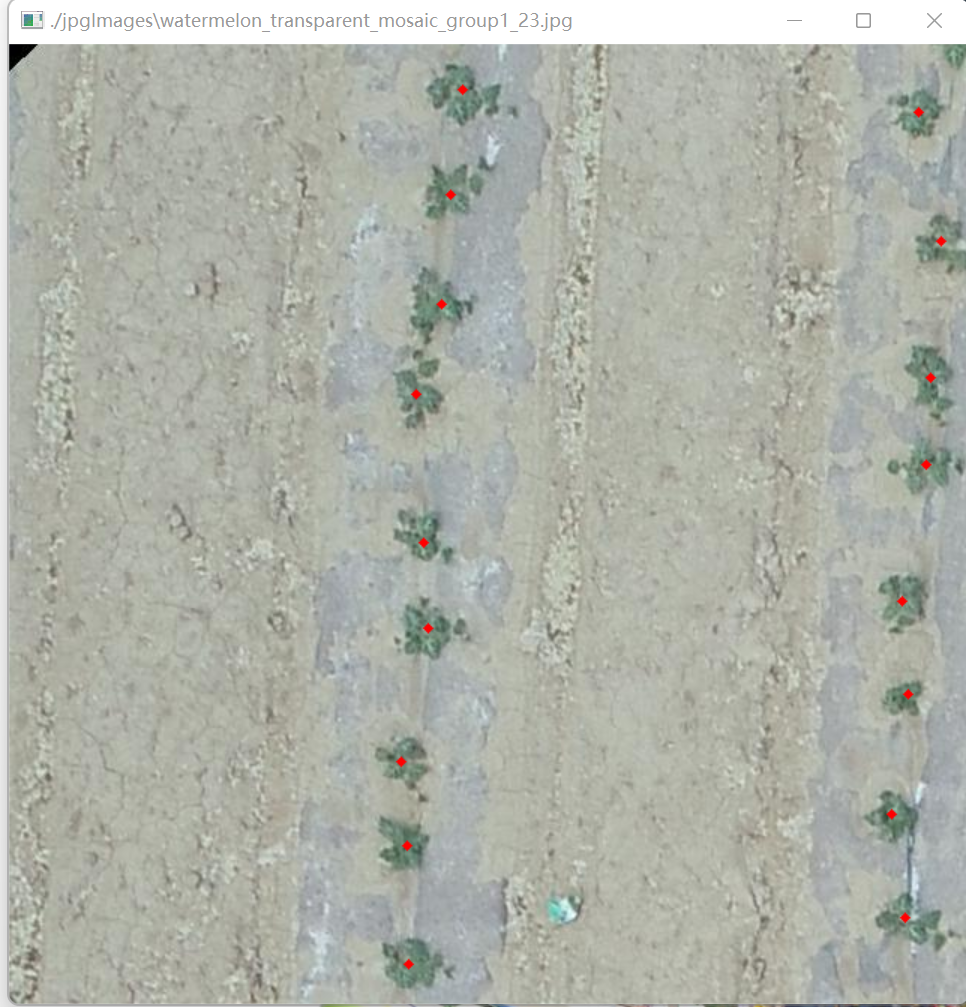
为了确认上述mat文件是否可用,这里做了一下mat文件可视化,并用ShanghaiTech数据集做了对比,代码如下
import json
import os, cv2
import scipy.io as io

def MatVisual(imgpath):
    matpath = imgpath.replace('.jpg', '.mat').replace('IMG_', 'GT_IMG_').replace('images', 'ground_truth')  # 图片文件对应mat文件路径
    mat = io.loadmat(matpath)  # 读取mat文件
    keypoints = mat["image_info"][0, 0][0, 0][0]  # 取出关键点坐标
    img = cv2.imread(imgpath, 1)  # 读取图片
    for keypont in keypoints:
        cv2.circle(img, (int(keypont[0]), int(keypont[1])), 1, (0, 0, 255), 4)  # 画点
    cv2.namedWindow(imgpath, 0)  # 创建窗口
    cv2.resizeWindow(imgpath, img.shape[1], img.shape[0])  # 创建窗口
    cv2.imshow(imgpath, img)
    cv2.waitKey(0)
def MatVisual1(imgpath):
    matpath = imgpath.replace('.jpg', '.mat').replace('jpgImages', 'label_mat')  # 图片文件对应mat文件路径
    mat = io.loadmat(matpath)  # 读取mat文件
    keypoints = mat["image_info"][0, 0][0, 0][0]  # 取出关键点坐标
    img = cv2.imread(imgpath, 1)  # 读取图片
    for keypont in keypoints:
        cv2.circle(img, (int(keypont[0]), int(keypont[1])), 1, (0, 0, 255), 4)  # 画点
    cv2.namedWindow(imgpath, 0)  # 创建窗口
    cv2.resizeWindow(imgpath, img.shape[1], img.shape[0])  # 创建窗口
    cv2.imshow(imgpath, img)
    cv2.waitKey(0)


if __name__ == "__main__":
    rootPath = r'./shanghai_train_data/images'  # 图片所在路径
    imgName = 'IMG_11.jpg'  # 图片名
    rootPath1 = r'./jpgImages'  # 图片所在路径
    imgName1 = 'watermelon_transparent_mosaic_group1_23.jpg'  # 图片名
    MatVisual(os.path.join(rootPath, imgName))
    MatVisual1(os.path.join(rootPath1, imgName1))
输出结果对比图如下
(5)作物计数生成密度图的方法
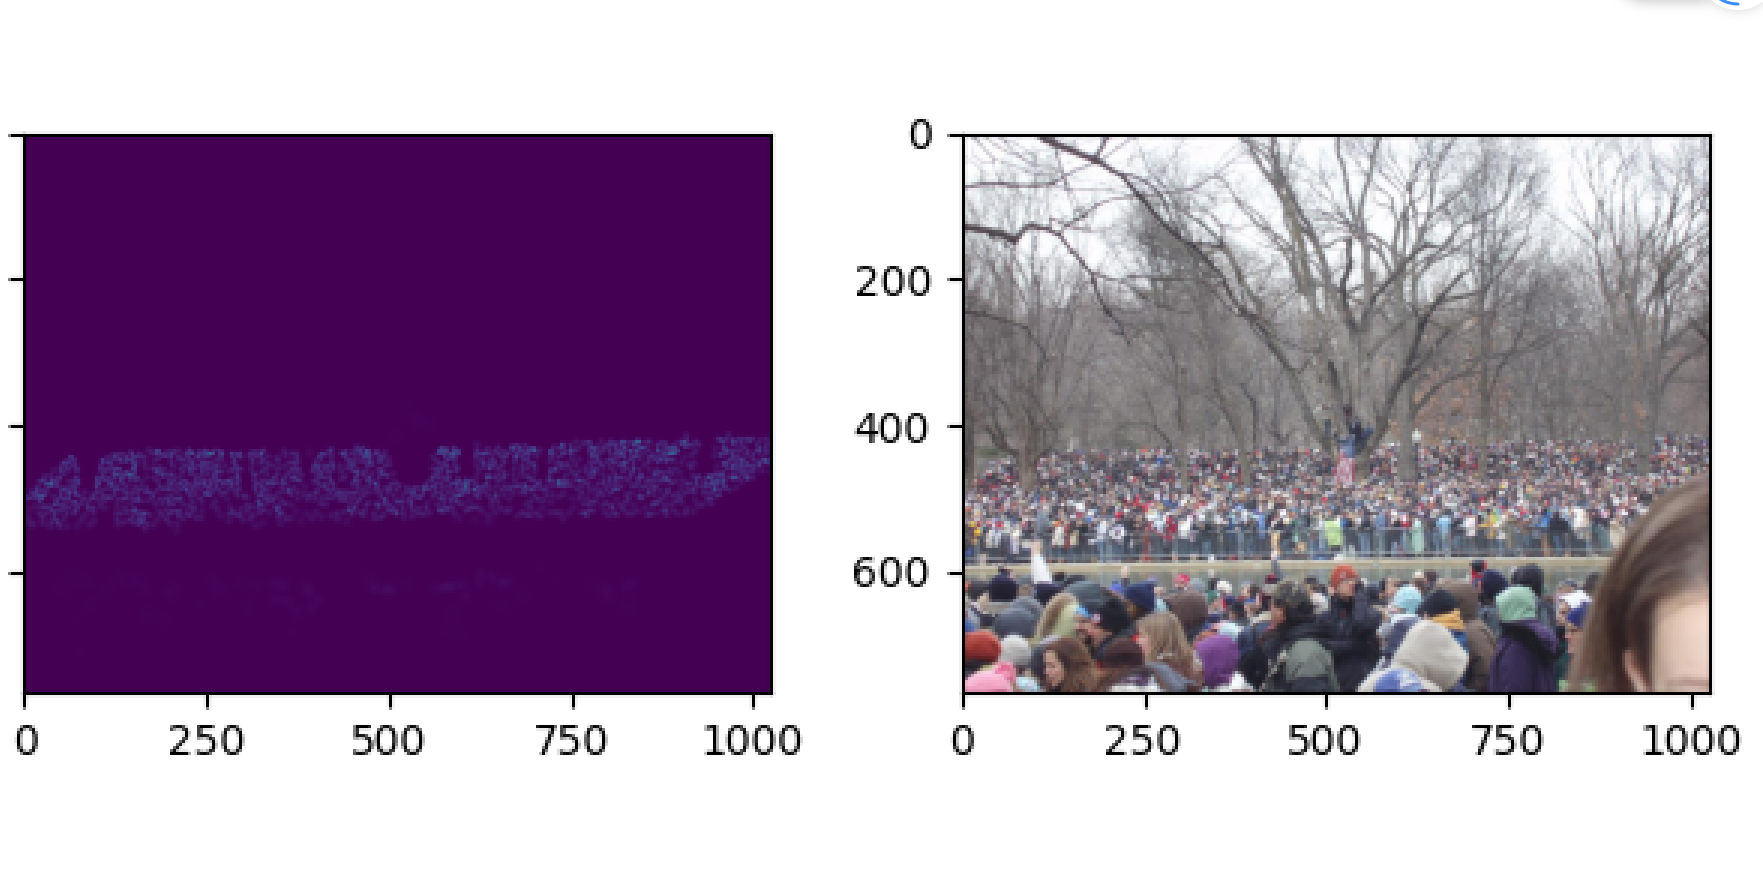
抛砖引玉,这里复现一下ShanghaiTech数据集生成人群密度图
源代码链接:Object counting——生成密度图density map_点PY的博客-CSDN博客
import h5py
import scipy.io as io
import PIL.Image as Image
import numpy as np
import os
import glob
from matplotlib import pyplot as plt
from scipy.ndimage.filters import gaussian_filter
from scipy.spatial import KDTree
import scipy
from matplotlib import cm as CM

#this is borrowed from https://github.com/davideverona/deep-crowd-counting_crowdnet
def gaussian_filter_density(gt):
    print(gt.shape)
    density = np.zeros(gt.shape, dtype=np.float32)
    gt_count = np.count_nonzero(gt)
    if gt_count == 0:
        return density

    pts = np.array(list(zip(np.nonzero(gt)[1], np.nonzero(gt)[0])))
    leafsize = 2048
    # build kdtree
    tree = KDTree(pts.copy(), leafsize=leafsize)
    # query kdtree
    distances, locations = tree.query(pts, k=4)

    print('generate density...')
    for i, pt in enumerate(pts):
        pt2d = np.zeros(gt.shape, dtype=np.float32)
        pt2d[pt[1],pt[0]] = 1.
        if gt_count > 1:
            sigma = (distances[i][1]+distances[i][2]+distances[i][3])*0.1
        else:
            sigma = np.average(np.array(gt.shape))/2./2. #case: 1 point
        density += scipy.ndimage.filters.gaussian_filter(pt2d, sigma, mode='constant')
    print('done.')
    return density

if __name__ == "__main__":
    #set the root to the Shanghai dataset you download
    root = r'D:\苏大研究生生活\2023项目\遥感\栅格图分割'
    #now generate the ShanghaiA's ground truth
    part_A_train = os.path.join(root,'shanghai_train_data','images')
    part_A_test = os.path.join(root,'shanghai_test_data','images')
    part_B_train = os.path.join(root,'part_B_final/train_data','images')
    part_B_test = os.path.join(root,'part_B_final/test_data','images')
    path_sets = [part_A_train, part_A_test]
    # print('标记', path_sets)  # 标记 ['D:\\苏大研究生生活\\2023项目\\遥感\\栅格图分割\\shanghai_train_data\\images', 'D:\\苏大研究生生活\\2023项目\\遥感\\栅格图分割\\shanghai_test_data\\images']
    img_paths = []
    for path in path_sets:
        for img_path in glob.glob(os.path.join(path, '*.jpg')):
            # print('标记', img_path)
            img_paths.append(img_path)
            # print('标记', img_paths)

    for img_path in img_paths:
        print(img_path)
        mat = io.loadmat(img_path.replace('.jpg','.mat').replace('images','ground_truth').replace('IMG_','GT_IMG_'))
        img= plt.imread(img_path)
        k = np.zeros((img.shape[0], img.shape[1]))
        gt = mat["image_info"][0, 0][0, 0][0]
        for i in range(0,len(gt)):
            if int(gt[i][1])<img.shape[0] and int(gt[i][0])<img.shape[1]:
                k[int(gt[i][1]),int(gt[i][0])]=1
        k = gaussian_filter_density(k)
        plt.subplot(121)
        plt.imshow(k)
        plt.subplot(122)
        plt.imshow(img)
        plt.show()

        with h5py.File(img_path.replace('.jpg','.h5').replace('images','ground_truth'), 'w') as hf:
            hf['density'] = k
            # now see a sample
    plt.imshow(Image.open(img_paths[0]))
    gt_file = h5py.File(img_paths[0].replace('.jpg','.h5').replace('images',  'ground_truth'), 'r')
    groundtruth = np.asarray(gt_file['density'])
    plt.imshow(groundtruth,cmap=CM.jet)
展示结果如下
下面利用前文提到的mat标签图和切片的jpg格式原图生成密度图
import h5py
import scipy.io as io
import PIL.Image as Image
import numpy as np
import os
import glob
from matplotlib import pyplot as plt
from scipy.ndimage.filters import gaussian_filter
from scipy.spatial import KDTree
import scipy
from matplotlib import cm as cm
import warnings
warnings.filterwarnings('ignore')
# this is borrowed from https://blog.csdn.net/weixin_42990464/article/details/131478925?spm=1001.2014.3001.5501
def gaussian_filter_density(gt):
    print(gt.shape)
    density = np.zeros(gt.shape, dtype=np.float32)
    gt_count = np.count_nonzero(gt)
    if gt_count == 0:
        return density
    pts = np.array(list(zip(np.nonzero(gt)[1], np.nonzero(gt)[0])))
    leafsize = 2048
    # build kdtree寻找相邻目标的位置
    #  构造KDTree调用的是scipy包中封装好的函数,其中leafsize表示的是最大叶子数,如果图片中目标数量过多,可以自行修改其数值。
    tree = KDTree(pts.copy(), leafsize=leafsize)
    # query kdtree
    # tree.query()中参数k=4查询的是与当前结点相邻三个结点的位置信息,因为distances[i][0]表示的是当前结点。
    # distances, locations = tree.query(pts, k=4)
    # 这里把源码的k = 4改成k = 3是因为目标作物的幼苗左右两侧只有两株植物
    distances, locations = tree.query(pts, k=3)
    print('generate density...')
    for i, pt in enumerate(pts):
        pt2d = np.zeros(gt.shape, dtype=np.float32)
        pt2d[pt[1], pt[0]] = 1.
        # 图像中目标比较稀疏,要重新设置高斯核
        if gt_count > 1:
            # sigma = (distances[i][1]+distances[i][2]+distances[i][3])*0.1
            sigma = (distances[i][1] + distances[i][2]) * 0.05   # 根据作物图修改的sigma
        else:
            sigma = np.average(np.array(gt.shape))/2./2.     # case: 1 point
        density += scipy.ndimage.filters.gaussian_filter(pt2d, sigma, mode='constant')
    print('done.')
    return density
if __name__ == "__main__":
    #  set the root to the dataset
    root = r'D:\苏大研究生生活\2023项目\遥感\栅格图分割'
    path_sets = os.path.join(root, 'jpgImages-part')
    # print(path_sets)   # D:\苏大研究生生活\2023项目\遥感\栅格图分割\jpgImages-part
    img_paths = []
    for img_path in glob.glob(os.path.join(path_sets, '*.jpg')):
        img_paths.append(img_path)
        # print('标记', img_paths)
        # 这里为了循环保存生成的子图,将源代码的循环小小的改了一下采用enumerate()
    for p, img_path in enumerate(img_paths):
        print(p)
        print(img_path)
        mat = io.loadmat(img_path.replace('.jpg', '.mat').replace('jpgImages-part', 'label_mat'))
        img= plt.imread(img_path)
        k = np.zeros((img.shape[0], img.shape[1]))
        gt = mat["image_info"][0, 0][0, 0][0]
        for i in range(0, len(gt)):
            # print(i)
            if int(gt[i][1])<img.shape[0] and int(gt[i][0])<img.shape[1]:
                k[int(gt[i][1]), int(gt[i][0])]=1
        k = gaussian_filter_density(k)
        plt.subplot(121)  # 一行两列,位置为1
        plt.imshow(k)
        plt.subplot(122)  # 一行两列,位置为2
        plt.imshow(img)
        plt.savefig("D:\\苏大研究生生活\\2023项目\\遥感\\栅格图分割\\density_map\\tem{}.jpg".format(p))
        plt.show()
        with h5py.File(img_path.replace('.jpg',  '.h5').replace('jpgImages-part', 'label_mat'), 'w') as hf:
            hf['density'] = k
    plt.clf()
    # now see a sample
    plt.imshow(Image.open(img_paths[0]))
    gt_file = h5py.File(img_paths[0].replace('.jpg', '.h5').replace('jpgImages-part', 'label_mat'), 'r')
    groundtruth = np.asarray(gt_file['density'])
    plt.imshow(groundtruth, cmap=cm.jet)
其中的代码相比人群密度图源代码做了一点修改,以满足作物比较稀疏情况下生成边界比较清楚的密度图并逐一保存下来
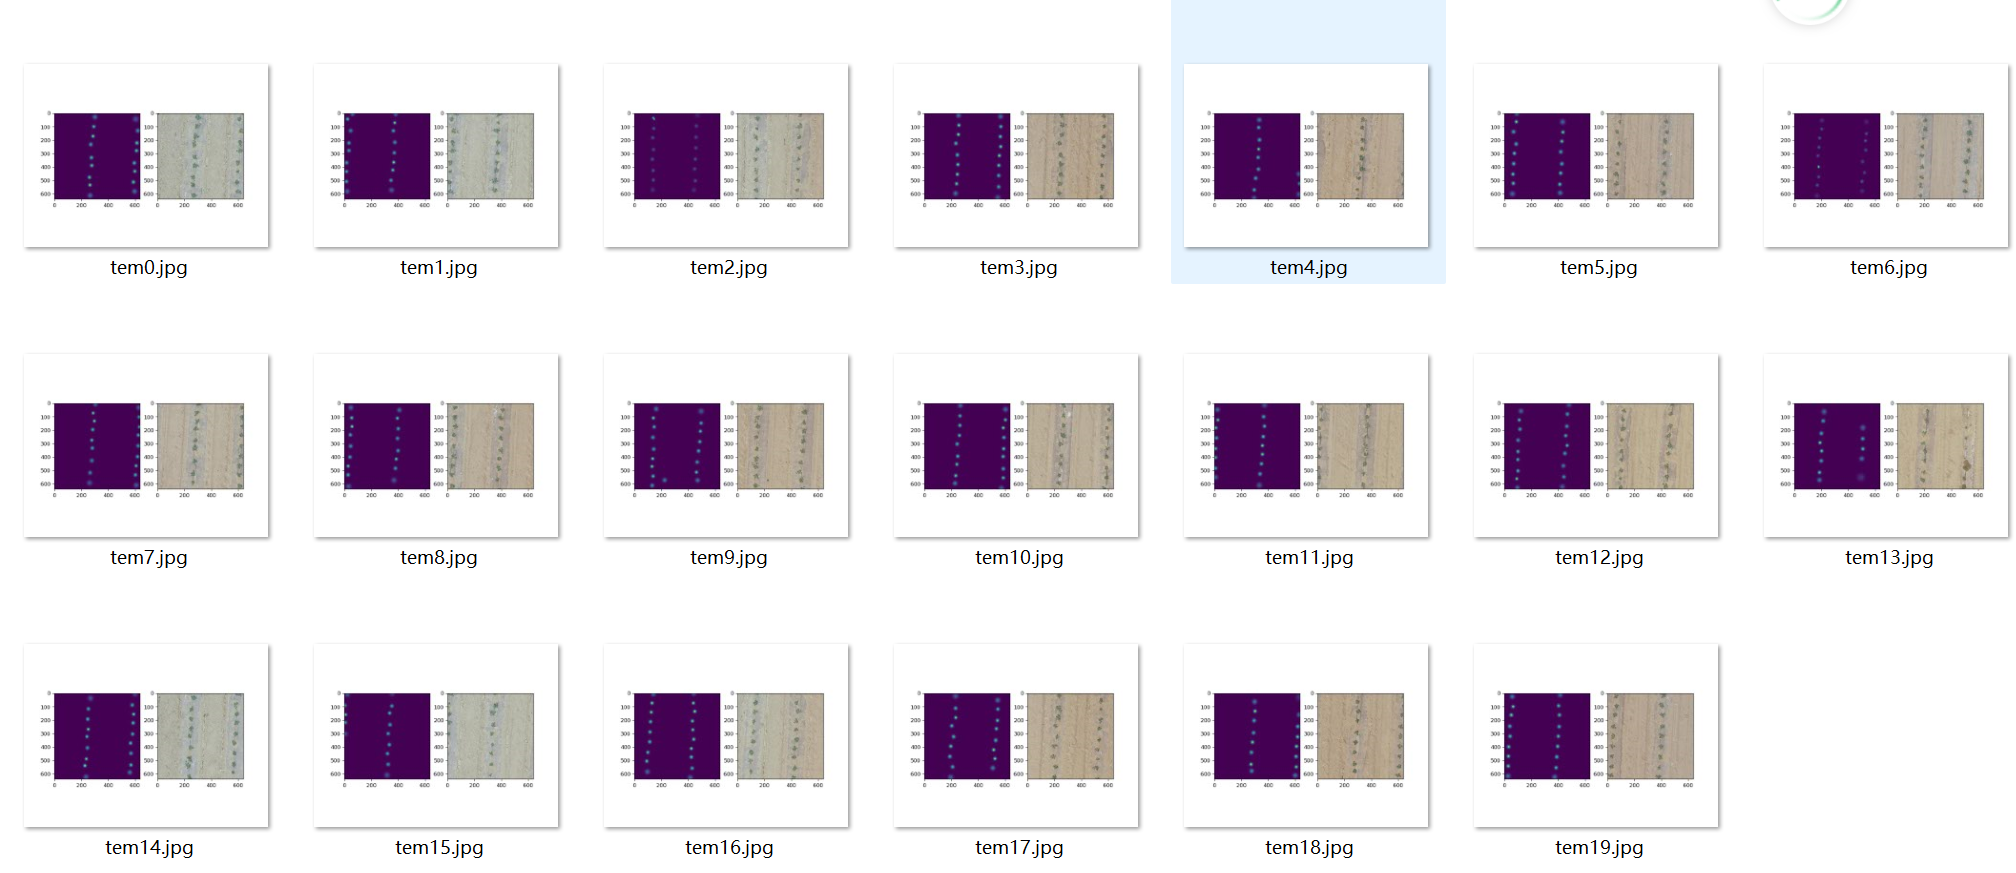
密度图示例展示
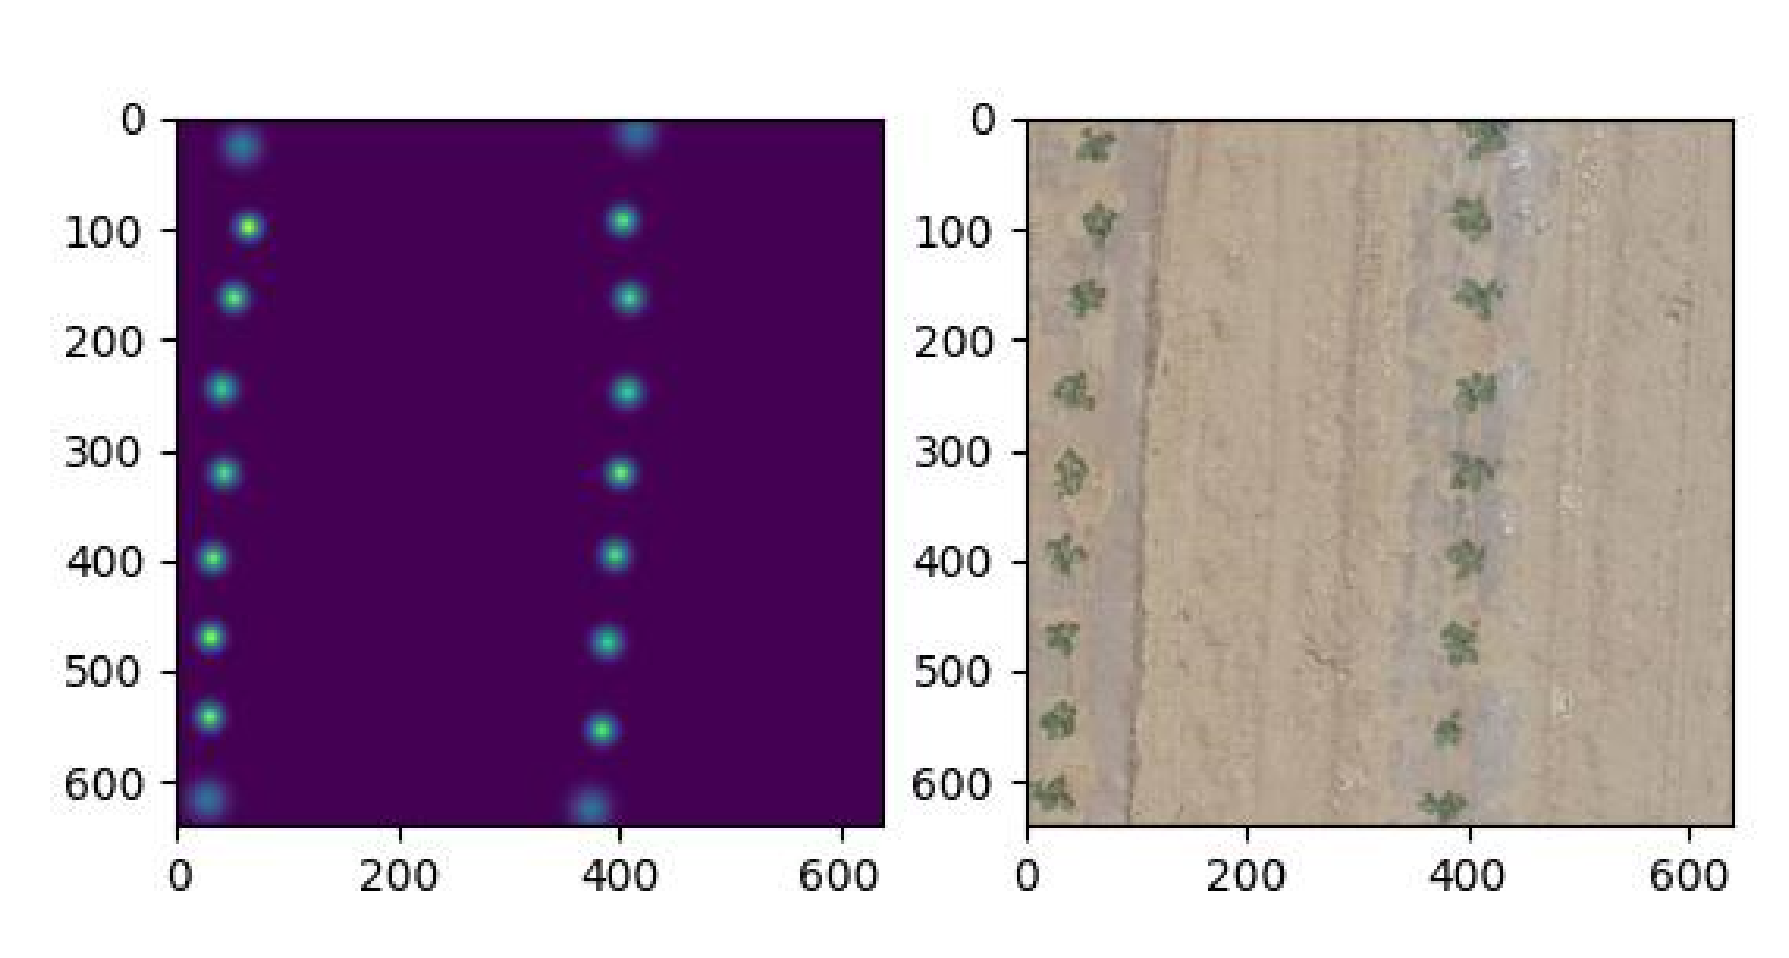
到这里由tif图片完整生成密度图的流程完毕。
以上方法未经本人允许,不得搬运,谢谢
