目录
1-男女比例【柱状图】
1.1-大屏男女比例原型需求
1.2-结构样式逻辑开发
2-年龄比例-饼图
2.1-原型需求分析
2.2-结构样式逻辑开发
3-中国地图和运行轨迹
3.1-地图组件需求原型
3.2-结构样式逻辑开发
4-未来7天游客数量趋势图-折线图
5-右侧的相关图
6-总结
1-男女比例【柱状图】
1.1-大屏男女比例原型需求
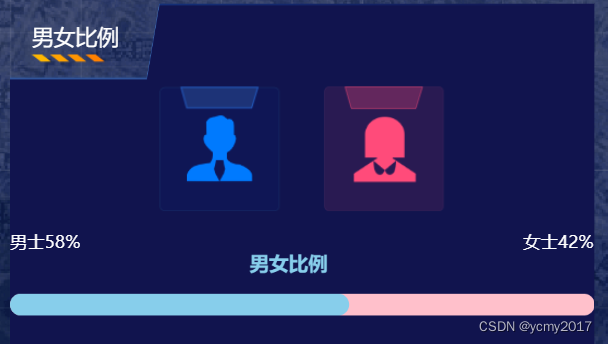
这里主要是用到echart的横向柱状图,需求还是比较简单。

1.2-结构样式逻辑开发
文件src\views\screen\components\sex\index.vue结构如下:
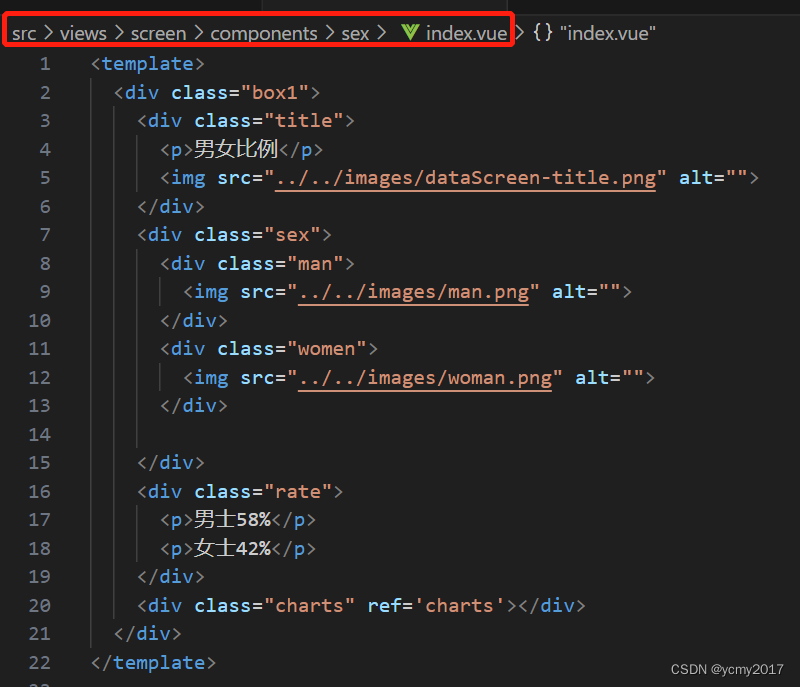
文件src\views\screen\components\sex\index.vue核心业务逻辑如下:
当页面挂载完成,需要初始化echarts实例,然后进行相关的项设置。这里男女比例是58%和42%;其实是两个横向的柱状图,我们在男性数据设置为58,女性数据设置为100;然后调整女性柱状图位置barGap为-100%;这样我们就把男性的遮住了,这里我们使用属性z将男性的数据比例展示出来。
import { ref, onMounted } from 'vue';
import * as echarts from 'echarts';
//获取图形图标的DOM节点
let charts = ref();
onMounted(() => {
  //初始化echarts实例
  let mycharts = echarts.init(charts.value);
  //设置配置项
  mycharts.setOption({
    //组件标题
    title: {
      text: '男女比例',//主标题
      textStyle: {//主标题颜色
        color: 'skyblue'
      },
      left: '40%'
    },
    //x|y
    xAxis: {
      show: false,
      min: 0,
      max: 100
    },
    yAxis: {
      show: false,
      type: 'category'
    },
    series: [
      {
        type: 'bar',
        data: [58],
        barWidth: 20,
        z: 100,
        itemStyle: {
          color: 'skyblue',
          borderRadius: 20
        }
      }
      ,
      {
        type: 'bar',
        data: [100],
        barWidth: 20,
        //调整女士柱条位置
        barGap: '-100%',
        itemStyle: {
          color: 'pink',
          borderRadius: 20
        }
      }
    ],
    grid: {
      left: 0,
      top: 0,
      right: 0,
      bottom: 0
    }
  });
})
文件src\views\screen\components\sex\index.vue样式如下:
<style scoped lang="scss">
.box1 {
  width: 100%;
  height: 100%;
  background: url(../../images/dataScreen-main-cb.png) no-repeat;
  background-size: 100% 100%;
  margin: 20px 0px;

  .title {
    margin-left: 20px;
    margin-top: 20px;

    p {
      color: white;
      font-size: 20px;
    }
  }

  .sex {
    display: flex;
    justify-content: center;

    .man {
      margin: 20px;
      width: 111px;
      height: 115px;
      background: url(../../images/man-bg.png) no-repeat;
      display: flex;
      justify-content: center;
      align-items: center;
    }

    .women {
      margin: 20px;
      width: 111px;
      height: 115px;
      background: url(../../images/woman-bg.png) no-repeat;
      display: flex;
      justify-content: center;
      align-items: center;
    }

  }

  .rate {
    display: flex;
    justify-content: space-between;
    color: white;
  }

  .charts {
    height: 100px;
  }
}
</style>
2-年龄比例-饼图
2.1-原型需求分析

看到这个原型需求跟上面的性别的结构类似,只不过这里是饼图,我们需要使用到echarts里面的饼图。
2.2-结构样式逻辑开发
由于本章节的处理和上章节差不多,结构类似,echarts处理简单,所以这里不做过多的分析和处理,直接贴出代码。
<template>
    <div class="box2">
        <div class="title">
            <p>年龄比例</p>
            <img src="../../images/dataScreen-title.png" alt="">
        </div>
        <!-- 图形图标的容器 -->
        <div class="charts" ref="charts"></div>
    </div>
</template>

<script setup lang="ts">
import { ref, onMounted } from 'vue';
//引入echarts
import * as echarts from 'echarts';
let charts = ref();
//组件挂载完毕初始化图形图标
onMounted(() => {
    let mychart = echarts.init(charts.value);
    //设置配置项
    let option = {
        tooltip: {
            trigger: 'item'
        },
        legend: {
            right: 30,
            top: 40,
            orient: 'vertical',//图例组件方向的设置
            textStyle: {
                color: 'white',
                fontSize: 14
            }
        },
        series: [
            {
                name: 'Access From',
                type: 'pie',
                radius: ['40%', '70%'],
                avoidLabelOverlap: false,
                itemStyle: {
                    borderRadius: 10,
                    borderColor: '#fff',
                    borderWidth: 2
                },
                label: {
                    show: true,
                    position: 'inside',
                    color:'white'
                },

                labelLine: {
                    show: false
                },
                data: [
                    { value: 1048, name: '军事' },
                    { value: 735, name: '新闻' },
                    { value: 580, name: '直播' },
                    { value: 484, name: '娱乐' },
                    { value: 300, name: '财经' }
                ]
            }
        ],
        //调整图形图标的位置
        grid: {
            left: 0,
            top: 0,
            right: 0,
            bottom: 0
        }
    };
    mychart.setOption(option);
});
</script>
<script lang="ts">
export default {
  name: 'Age',
}
</script>

<style scoped lang="scss">
.box2 {
    width: 100%;
    height: 100%;
    background: url(../../images/dataScreen-main-cb.png) no-repeat;
    background-size: 100% 100%;

    .title {
        margin-left: 20px;
        // margin-top: 20px;

        p {
            color: white;
            font-size: 20px;
        }
    }

    .charts {
        height: 260px;
    }

}
</style>
3-中国地图和运行轨迹
3.1-地图组件需求原型
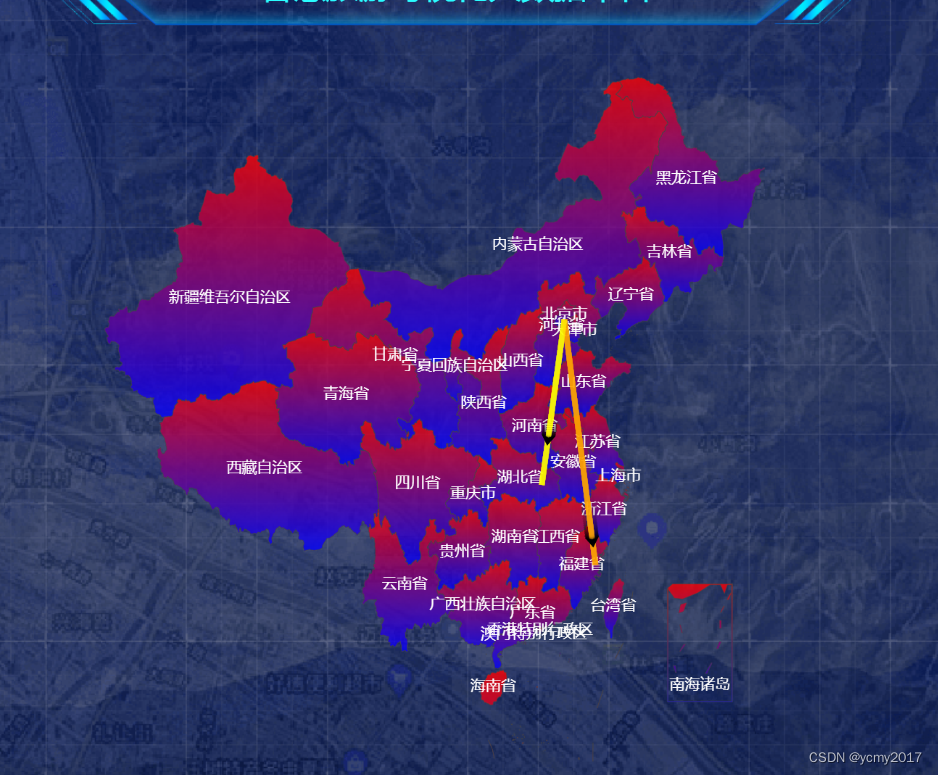
在大屏中间的上面是地图组件,我们单独将这部分抽取为一个组件。首先,我们要获取到中国地图的经纬度坐标系,这个数据我们可以从网站DataV.GeoAtlas地理小工具系列中获取到相关的json数据。
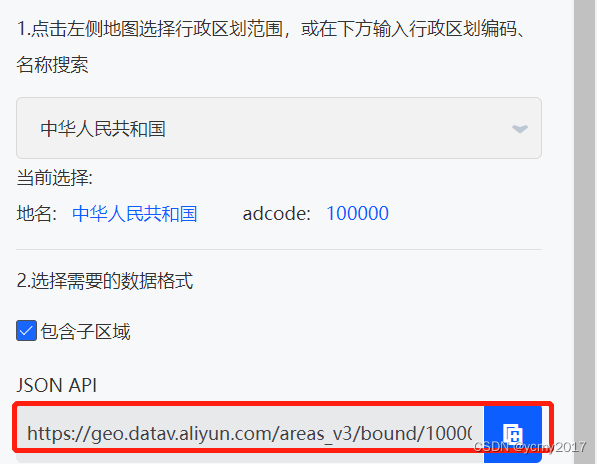
ps:由于echarts官方网站是国外网站,打开速度很慢,我们可以使用网址来打开,这个打开速度快,而且社区里面有很多已经设置好的demo,到时候直接获取就行。

由于需要制定轨迹,我们需要使用的到地图中的一个系列 type: 'lines',//航线的系列。
3.2-结构样式逻辑开发
文件src\views\screen\components\map\china.json中的json是从我们上面的阿里云获取,存放在本地。
文件:src\views\screen\components\map\index.vue是地图组件的内容。
<template>
    <div class="box4" ref="map">

    </div>
</template>

<script setup lang="ts">
import { ref, onMounted } from 'vue';
import * as echarts from 'echarts';
//引入中国地图的JSON数据
import chinaJSON from './china.json'
//获取DOM元素
let map = ref();
//注册中国地图
echarts.registerMap('china', chinaJSON as any)
onMounted(() => {
    let mychart = echarts.init(map.value);
    //设置配置项
    mychart.setOption({
        //地图组件
        geo: {
            map: 'china',//中国地图
            roam: true,//鼠标缩放的效果
            //地图的位置调试
            left: 150,
            top: 150,
            right: 150,
            zoom:1.2,
            bottom: 0,
            //地图上的文字的设置
            label: {
                show: true,//文字显示出来
                color: 'white',
                fontSize: 14
            },

            itemStyle: {
                //每一个多边形的样式
                color: {
                    type: 'linear',
                    x: 0,
                    y: 0,
                    x2: 0,
                    y2: 1,
                    colorStops: [{
                        offset: 0, color: 'red' // 0% 处的颜色
                    }, {
                        offset: 1, color: 'blue' // 100% 处的颜色
                    }],
                    global: false // 缺省为 false
                },
                opacity: .8
            },
            //地图高亮的效果
            emphasis: {
                itemStyle: {
                    color: 'red'
                },
                label: {
                    fontSize: 40
                }
            }
        },
        //布局位置
        grid: {
            left: 0,
            top: 0,
            right: 0,
            bottom: 0
        },
        series: [
            {
                type: 'lines',//航线的系列
                data: [
                    {
                        coords: [
                            [116.405285, 39.904989],  // 起点
                            [119.306239, 26.075302]   // 终点

                        ],
                        // 统一的样式设置
                        lineStyle: {
                            color: 'orange',
                            width: 5
                        }
                    },
                    {
                        coords: [
                            [116.405285, 39.904989],  // 起点
                            [114.298572,30.584355]   // 终点

                        ],
                        // 统一的样式设置
                        lineStyle: {
                            color: 'yellow',
                            width: 5
                        }
                    }
                ],
                //开启动画特效
                effect: {
                    show: true,
                    symbol: 'arrow',
                    color: 'black',
                    symbolSize: 10
                }
            }
        ]
    })

});
</script>
<script lang="ts">
export default {
  name: 'Map',
}
</script>

<style scoped></style>
4-未来7天游客数量趋势图-折线图

我们看到需求原型是一个折线图,需要用到echarts里面的折线图type: 'line'系列,我们主要要对配置项进行设置。标题设置,x轴的均匀分布,两侧不留白,折线圆润以及填充图的颜色等。文件src\views\screen\components\line\index.vue完整内容如下:
<template>
    <div class="box5">
        <div class="title">
            <p>未来七天游客数量趋势图</p>
            <img src="../../images/dataScreen-title.png" alt="">
        </div>
        <div class="charts" ref='line'></div>
    </div>
</template>

<script setup lang="ts">
import * as echarts from 'echarts';
import { ref, onMounted } from 'vue';
//获取图形图标的节点
let line = ref();
onMounted(() => {
    let mycharts = echarts.init(line.value);
    //设置配置项
    mycharts.setOption({
        //标题组件
        title: {
            text: '访问量'
        },
        //x|y轴
        xAxis: {
            type: 'category',//x轴均匀分布
            boundaryGap: false,//两侧不留白
            //分割线不要
            splitLine: {
                show: false
            },
            data: ['周一', '周二', '周三', '周四', '周五', '周六', '周日'],
            //轴线的设置
            axisLine: {
                show: true
            },
            //刻度
            axisTick: {
                show: true
            }
        },
        yAxis: {
            splitLine: {
                show: false
            },
            //轴线的设置
            axisLine: {
                show: true
            },
            //刻度
            axisTick: {
                show: true
            }
        },
        grid: {
            left: 40,
            top: 0,
            right: 20,
            bottom: 20
        },
        //系列
        series: [
            {
                type: 'line',
                data: [120, 1240, 66, 2299, 321, 890, 1200],
                smooth: true,//平滑曲线的设置
                //区域填充样式
                areaStyle: {
                    color: {
                        type: 'linear',
                        x: 0,
                        y: 0,
                        x2: 0,
                        y2: 1,
                        colorStops: [{
                            offset: 0, color: 'red' // 0% 处的颜色
                        }, {
                            offset: 1, color: 'blue' // 100% 处的颜色
                        }],
                        global: false // 缺省为 false
                    }
                }
            }
        ]
    })
})
</script>
<script lang="ts">
export default {
  name: 'Line',
}
</script>

<style scoped lang="scss">
.box5 {
    width: 100%;
    height: 100%;
    background: url(../../images/dataScreen-main-cb.png) no-repeat;
    background-size: 100% 100%;
    margin: 0px 20px;

    .title {
        margin-left: 10px;

        p {
            color: white;
            font-size: 20px;
        }
    }

    .charts {
        height: calc(100% - 40px);
    }

}
</style>
5-右侧的相关图
右侧的一些图,开发的方式和逻辑和前面的差不多,这里我们不再进行开发和阐述,大家可以参考echarts官网去查看相关的配置进行开发。
6-总结
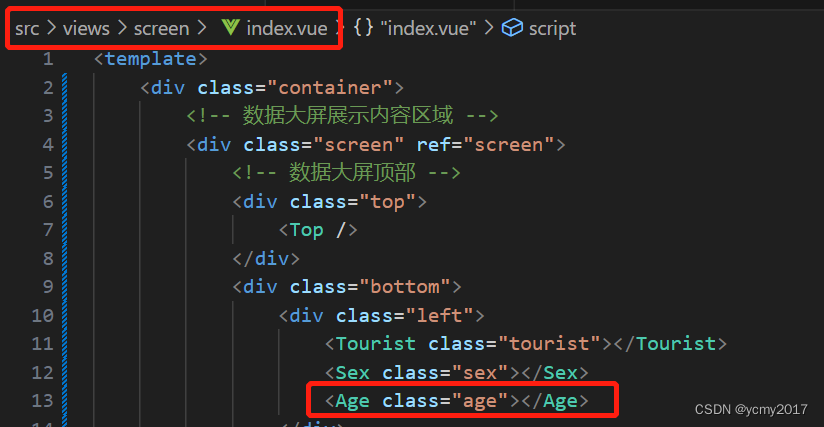
在开发的工程中,我们先从宏观在父组件中对当前页面进行拆分各种组件,定义好布局和格式,父组件中基本不涉及到echarts各种系列,图形图表的操作;只是对页面的大小和缩放进行相关处理,其他的具体工作我们在每个子组件中开发,然后我们就专注于我们各种子组件开发,这样最后在父组件中引入各种子组件,我们的数据大屏工作才可以完整展示。文件src\views\screen\index.vue父组件的内容如下:
<template>
    <div class="container">
        <!-- 数据大屏展示内容区域 -->
        <div class="screen" ref="screen">
            <!-- 数据大屏顶部 -->
            <div class="top">
                <Top />
            </div>
            <div class="bottom">
                <div class="left">
                    <Tourist class="tourist"></Tourist>
                    <Sex class="sex"></Sex>
                    <Age class="age"></Age>
                </div>
                <div class="center">
                    <Map class="map"></Map>
                    <Line class="line"></Line>
                </div>
                <div class="right">
                    <Rank class="rank"></Rank>
                    <Year class="year"></Year>
                    <Counter class="count"></Counter>
                </div>
            </div>
        </div>
    </div>
</template>

<script setup lang="ts">
import { ref, onMounted } from "vue";
//引入顶部的子组件
import Top from './components/top/index.vue';
//引入左侧三个子组件
import Tourist from './components/tourist/index.vue';
import Sex from './components/sex/index.vue';
import Age from './components/age/index.vue'

//引入中间两个子组件
import Map from './components/map/index.vue';
import Line from './components/line/index.vue';

//引入右侧三个子组件
import Rank from './components/rank/index.vue';
import Year from './components/year/index.vue';
import Counter from './components/couter/index.vue'
//获取数据大屏展示内容盒子的DOM元素
let screen = ref();
onMounted(() => {
    screen.value.style.transform = `scale(${getScale()}) translate(-50%,-50%)`
});
//定义大屏缩放比例
function getScale(w = 1920, h = 1080) {
    const ww = window.innerWidth / w;
    const wh = window.innerHeight / h;
    return ww < wh ? ww : wh;
}
//监听视口变化
window.onresize = () => {
    screen.value.style.transform = `scale(${getScale()}) translate(-50%,-50%)`
}


</script>

<style scoped lang="scss">
.container {
    width: 100vw;
    height: 100vh;
    background: url(./images/bg.png) no-repeat;
    background-size: cover;

    .screen {
        position: fixed;
        width: 1920px;
        height: 1080px;
        left: 50%;
        top: 50%;
        transform-origin: left top;

        .top {
            width: 100%;
            height: 40px;
        }

        .bottom {
            display: flex;

            .right {
                flex: 1;
                display: flex;
                flex-direction: column;
                margin-left: 40px;

                .rank {
                    flex: 1.5;
                }

                .year {
                    flex: 1;

                }

                .count {
                    flex: 1;
                }
            }

            .left {
                flex: 1;
                height: 1040px;
                display: flex;
                flex-direction: column;

                .tourist {
                    flex: 1.2;
                }

                .sex {
                    flex: 1;

                }

                .age {
                    flex: 1;
                }
            }

            .center {
                flex: 1.5;
                display: flex;
                flex-direction: column;

                .map {
                    flex: 3;
                }

                .line {
                    flex: 1;
                }
            }
        }
    }
}
</style>

