还是老规矩先来看效果: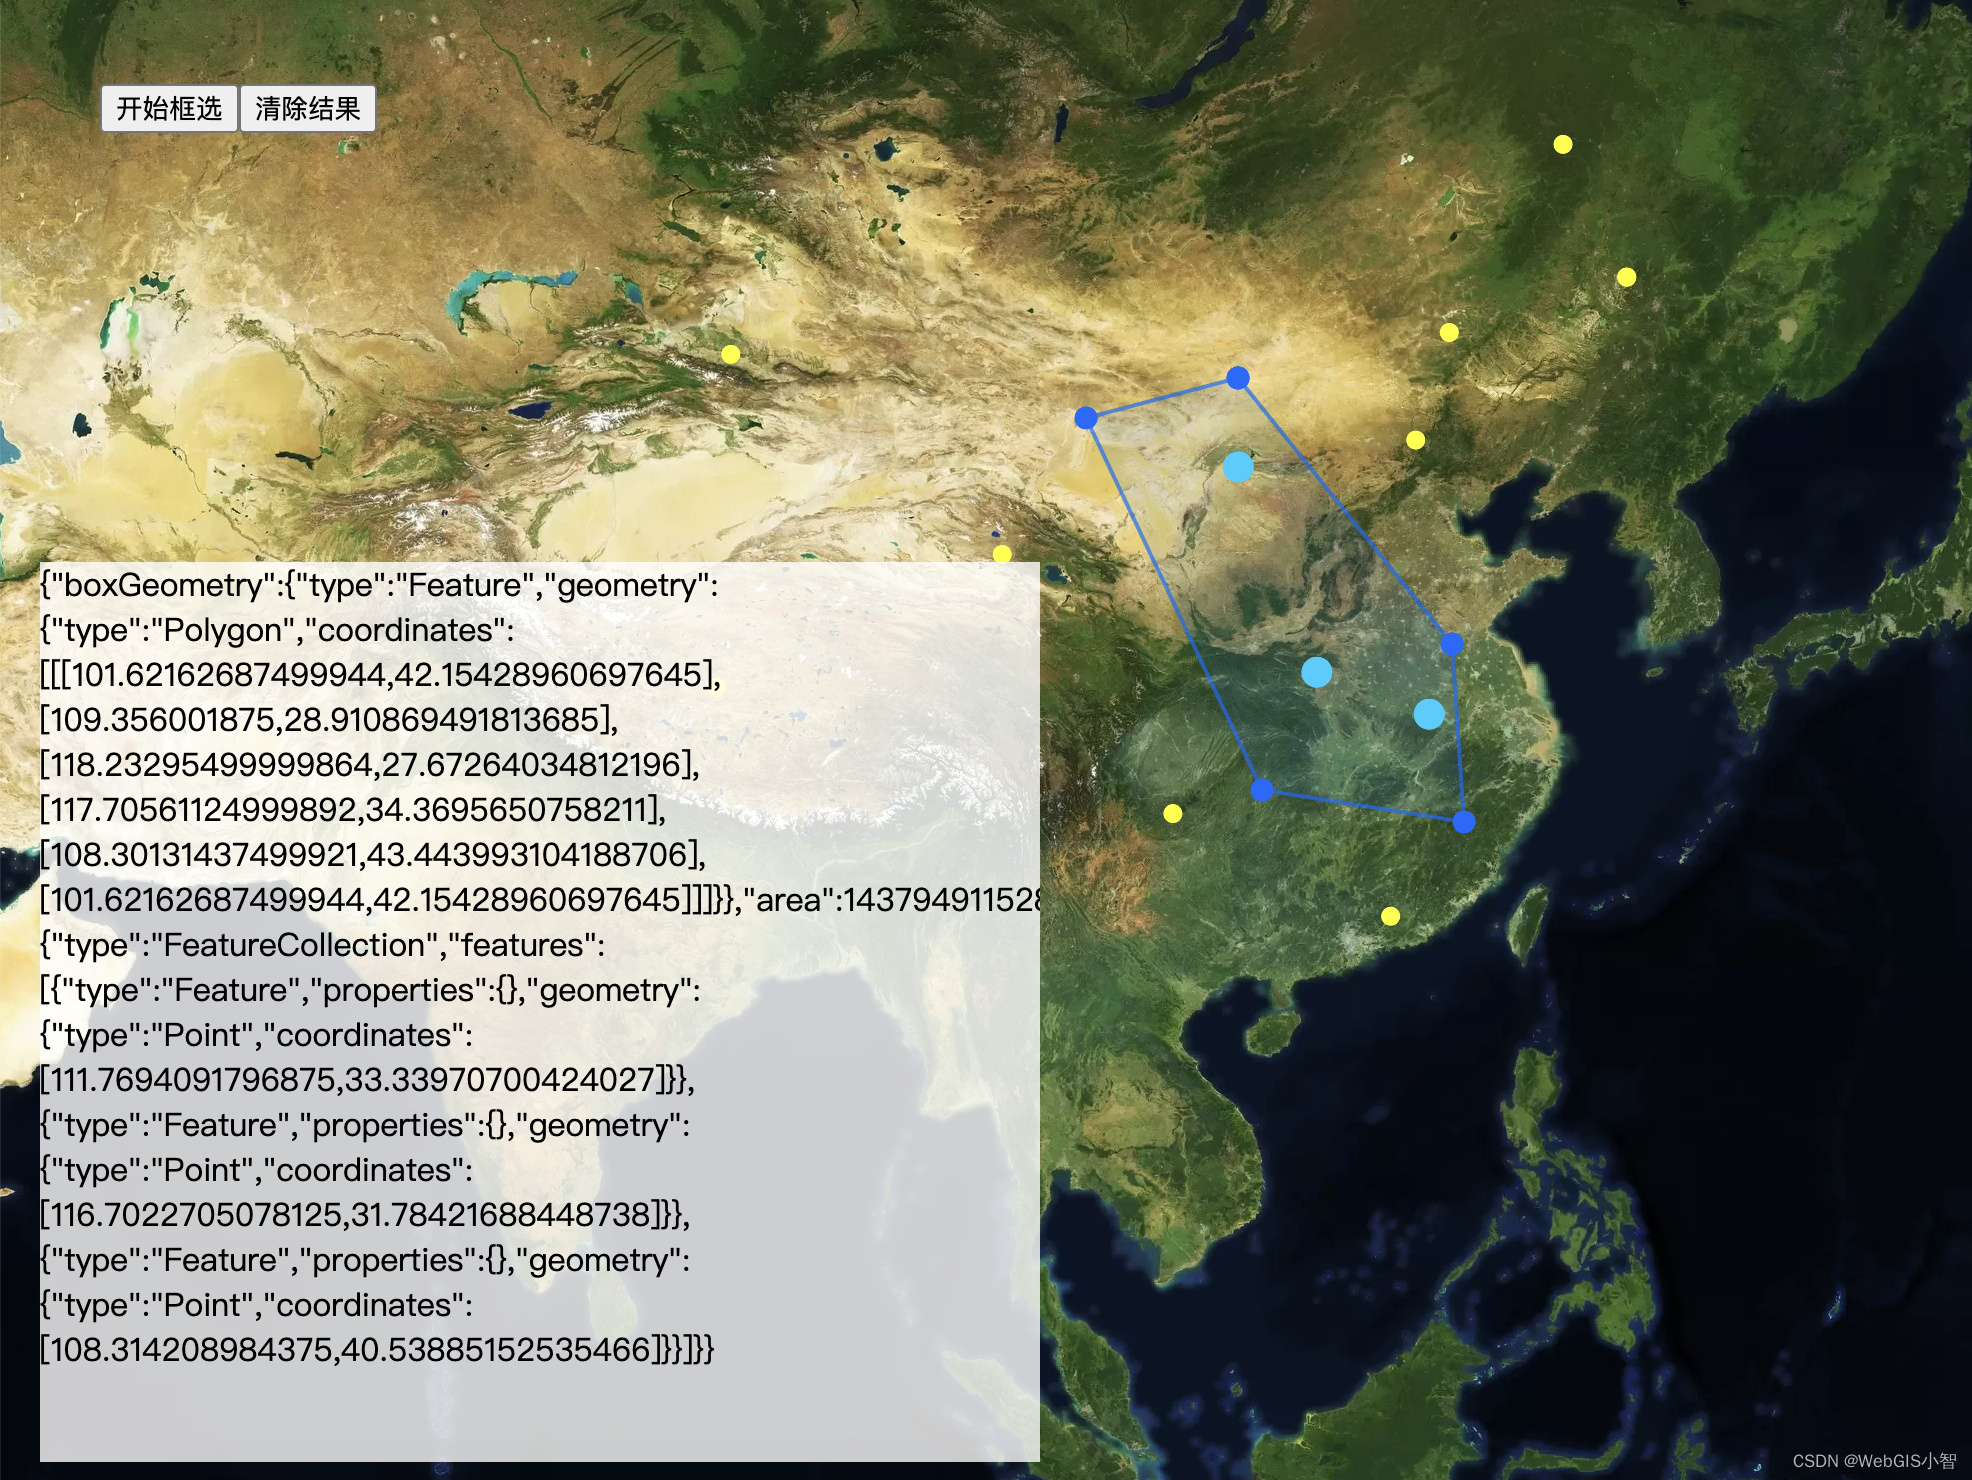
mapbox官方没有为我们提供框选查询的案例,所以这个功能需要我们自己写。在openlayers框架中是有一个矩形范围查询的例子,但是在maobox没有。
那么我们就来说一下如何来做这个效果吧,首先这个效果可以分为两个部分,第一个部分是绘制图形,第二部分是利用绘制的图形去查询指定的图层数据。
绘制图形在mapbox中也没有固定的案例,因此也需要我们自己写。
绘制一个图形的思路其实是通过一个关键的函数setData()这个函数的作用是为图层源source设置数据。在mapbox中我们通常可以这样操作。先建立一个空的source和layer,然后后续再为这个图层指定数据。就像下面这样的写法:
map.addSource("selected-source", {
        type: "geojson",
        data: {
          type: "FeatureCollection",
          features: [],
        },
      });
      map.addLayer({
        id: "selected-layer",
        type: "circle",
        source: "selected-source",
        paint: {
          "circle-radius": 8,
          "circle-color": color,
        },
      });
      map.getSource("selected-source").setData(features);
因此顺着这个思路我们可以先建立图层,后更新数据。如何来更新数据?我们可以监听地图的“onmousemove”事件,初始状态我们可以鼠标点击确定多边形的起点,然后鼠标移动的时候,我们让鼠标当前的位置和第一次点下的位置进行连线,这样就画成了一条线,顺着这个思路我们就可以不断的使用点击和鼠标移动的方式来绘制多边形。当然如果你是矩形或者圆形 的话思路是一样的,只不过画线的数学计算不一样,例如圆形的第一次点击是确定圆心的位置,鼠标的移动是为了确定圆的半径,第二次鼠标落下圆就画好了。
绘制多边形的核心代码如下:
function boxSelect(targetLayer) {
      return new Promise((resolve, reject) => {
        var Selected = true;
        map.doubleClickZoom.disable();
        map.getCanvas().style.cursor = "default";
        clearSelect();
        var jsonPoint = {
          type: "FeatureCollection",
          features: [],
        };
        var jsonLine = {
          type: "FeatureCollection",
          features: [],
        };
        var points = [];
        var ele = document.createElement("div");
        ele.setAttribute("class", "measure-result");
        const option = {
          element: ele,
          anchor: "left",
          offset: [8, 0],
        };
        var markers = [];
        var tooltip = new mapboxgl.Marker(option).setLngLat([0, 0]).addTo(map);
        markers.push(tooltip);
        var source = map.getSource("points-area");
        if (source) {
          map.getSource("points-area").setData(jsonPoint);
          map.getSource("line-area").setData(jsonLine);
        } else {
          map.addSource("points-area", {
            type: "geojson",
            data: jsonPoint,
          });
          map.addSource("line-area", {
            type: "geojson",
            data: jsonLine,
          });
          map.addLayer({
            id: "line-area",
            type: "fill",
            source: "line-area",
            paint: {
              "fill-color": "#006aff",
              "fill-opacity": 0.1,
            },
          });
          map.addLayer({
            id: "line-area-stroke",
            type: "line",
            source: "line-area",
            paint: {
              "line-color": "#006aff",
              "line-width": 2,
              "line-opacity": 0.65,
            },
          });
          map.addLayer({
            id: "points-area",
            type: "circle",
            source: "points-area",
            paint: {
              "circle-color": "#006aff",
              "circle-radius": 6,
            },
          });
        }

        function addPoint(coords) {
          jsonPoint.features.push({
            type: "Feature",
            geometry: {
              type: "Point",
              coordinates: coords,
            },
          });
          map.getSource("points-area").setData(jsonPoint);
        }

        map.on("click", function (_e) {
          if (Selected) {
            var coords = [_e.lngLat.lng, _e.lngLat.lat];
            points.push(coords);
            addPoint(coords);
          }
        });
        var boxResult = {};
        map.on("dblclick", function (_e) {
          if (Selected) {
            var coords = [_e.lngLat.lng, _e.lngLat.lat];
            points.push(coords);
            Selected = false;
            markers.forEach((f) => {
              f.remove();
            });
            boxResult.boxGeometry = map.getSource("line-area")["_data"];
            boxResult.area = turf.area(boxResult.boxGeometry);
            boxResult.selectedFeatures = execSelect(
              boxResult.boxGeometry,
              targetLayer
            );
            hightLightFeature(boxResult.selectedFeatures);
            resolve(boxResult);
          }
        });

        map.on("mousemove", function (_e) {
          if (Selected) {
            var coords = [_e.lngLat.lng, _e.lngLat.lat];
            var len = jsonPoint.features.length;
            if (len === 0) {
              ele.innerHTML = "点击绘制多边形";
            } else if (len === 1) {
              ele.innerHTML = "点击继续绘制";
            } else {
              var pts = points.concat([coords]);
              pts = pts.concat([points[0]]);
              var json = {
                type: "Feature",
                geometry: {
                  type: "Polygon",
                  coordinates: [pts],
                },
              };
              map.getSource("line-area").setData(json);
            }
            tooltip.setLngLat(coords);
          }
        });
      });
    }
画完多边形之后,就要进入查询的阶段了,查询的方式有很多,第一种你可以把画完的多边形的经纬度边界范围提交到服务端(自己的数据服务或者geoserver)进行查询,然后把结果返回到前端,第二种方式你可以采用turf.js直接在前端做查询,其实mapbox官方虽然没有提供范围查询的示例但是却提供了范围查询的api: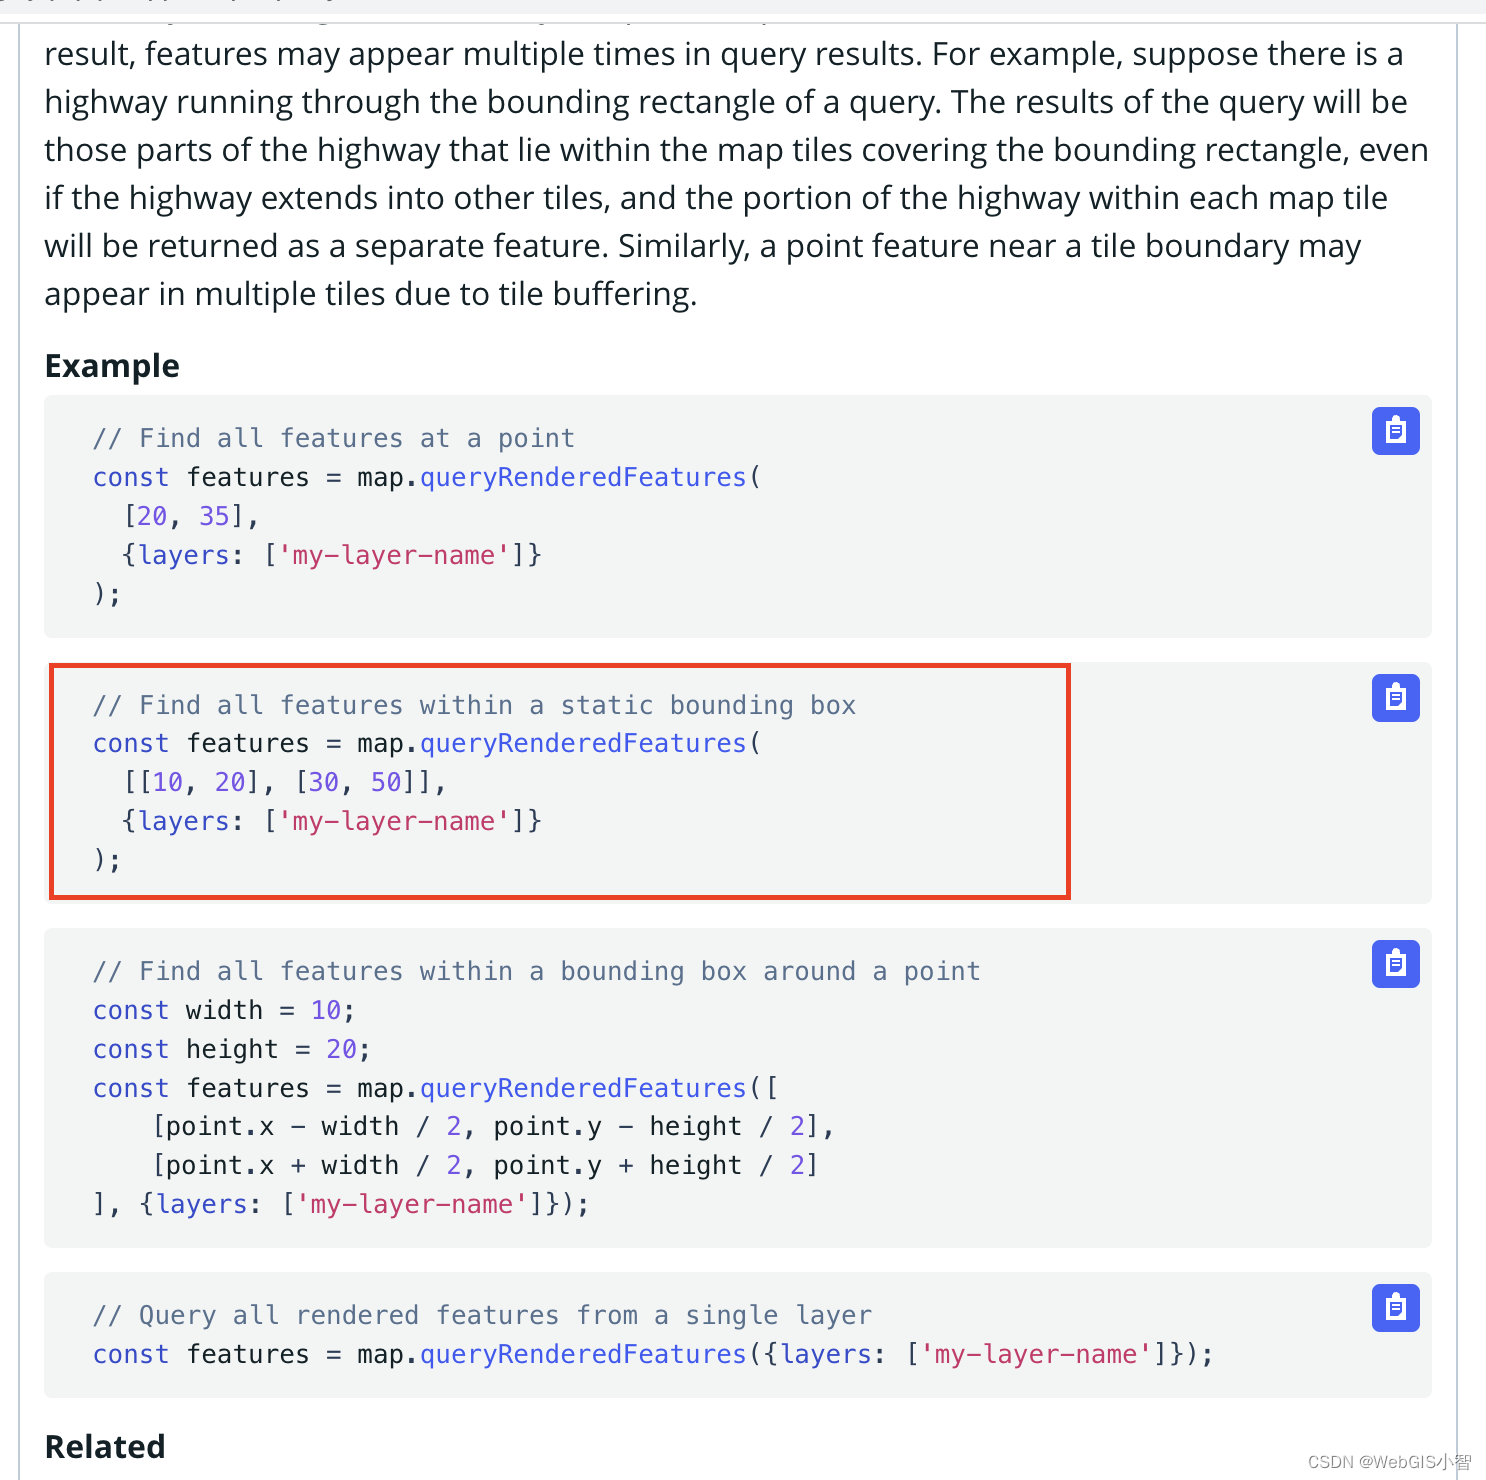
只需要传入一个边界范围就可以进行查询。不过这个api是有两个坑的地方。
第一是这个api你传入的边界范围坐标必须是canvas坐标。经纬度是不行的。因此在传递范围的时候要这样写:
  var extent = turf.bbox(polygon);
      const features = map.queryRenderedFeatures(
        [
          map.project([extent[0], extent[1]]),
          map.project([extent[2], extent[3]]),
        ],
        { layers: [targetLayer] }
      );
第二个比较坑的地方是按照这个接口查询出来的结果并不准确,因为他选择的是外部边界的范围。就像下图的情况是很容易发生的:
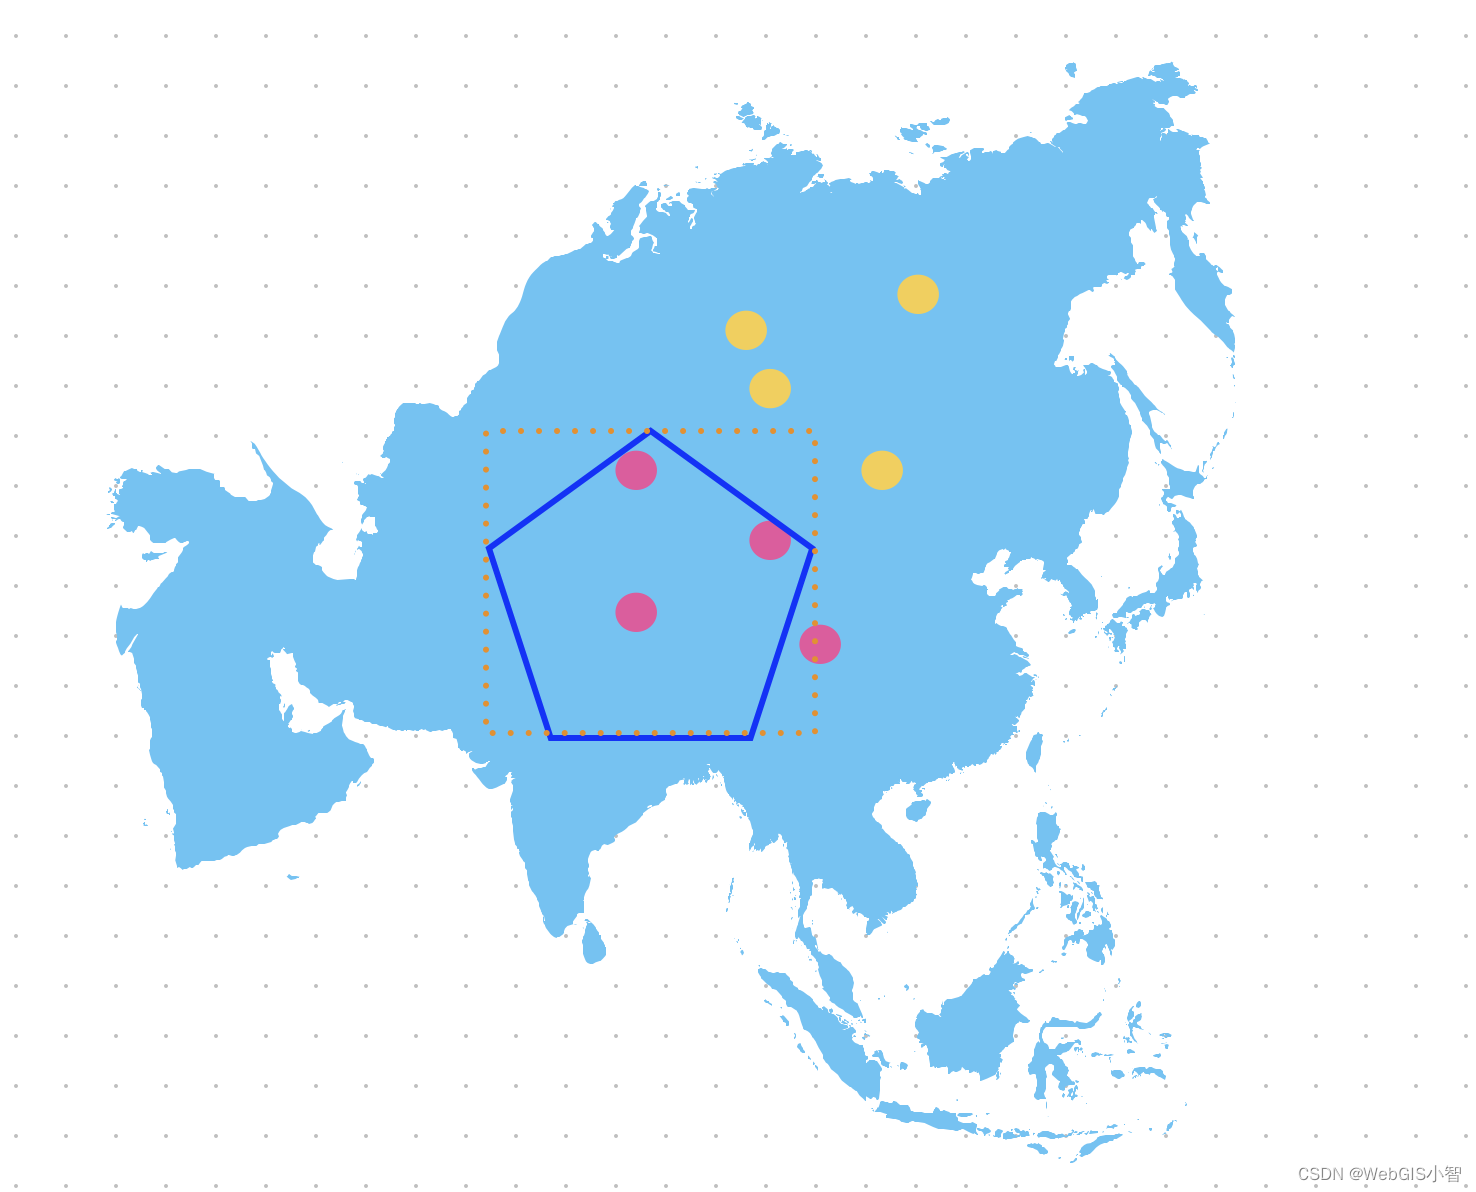
可以看到五边形之外的点也能够被选中高亮,因为这个接口他是按照多变形的外接矩形(图中橙色虚线)来选择的。外接矩形范围内的点都能够被选中。所以为了准确的计算结果,我们最好是接入turf.js的一个函数,叫做:pointsWithinPolygon。这个函数能够准确的获取多边形内部的点。所以我们可以采用这个函数来查询,也可以采用mapbox 的接口第一次检索一批结果。然后再使用这个函数进行过滤。看个人设计。
最后为大家附上框选范围查询的源码,大家只需要配置自己的mapbox的token就可以直接使用:
<!DOCTYPE html>
<html lang="en">
  <head>
    <meta charset="UTF-8" />
    <meta http-equiv="X-UA-Compatible" content="IE=edge" />
    <meta name="viewport" content="width=device-width, initial-scale=1.0" />
    <title>框选查询</title>
    <link
      href="https://api.mapbox.com/mapbox-gl-js/v2.10.0/mapbox-gl.css"
      rel="stylesheet"
    />
    <script src="https://api.mapbox.com/mapbox-gl-js/v2.10.0/mapbox-gl.js"></script>
    <script src="./turf.min.js"></script>
    <script src="./token.js"></script>
    <script src="./poi.js"></script>
    <style>
      body {
        padding: 0;
        margin: 0;
      }
      .mapboxgl-ctrl-bottom-left {
        display: none !important;
      }
      #map {
        width: 100%;
        height: 100vh;
        top: 0;
        left: 0;
        position: absolute;
        z-index: 2;
      }
      #result {
        width: 500px;
        height: 450px;
        position: absolute;
        left: 20px;
        bottom: 30px;
        z-index: 10;
        background: rgba(255, 255, 255, 0.8);
        overflow: auto;
      }
      .btns {
        position: absolute;
        top: 50px;
        left: 50px;
        z-index: 10;
      }
      .measure-result {
        background-color: white;
        border-radius: 3px;
        height: 16px;
        line-height: 16px;
        padding: 0 3px;
        font-size: 12px;
        box-shadow: 0 0 0 1px #ccc;
        &.close {
          cursor: pointer;
          width: 20px;
          height: 20px;
          display: flex;
          align-items: center;
          justify-content: center;
        }
      }
    </style>
  </head>

  <body>
    <div id="map"></div>
    <div id="result"></div>
    <div class="btns">
      <button onclick="test()">开始框选</button
      ><button onclick="clearSelect()">清除结果</button>
    </div>
  </body>
  <script>
    mapboxgl.accessToken = token;
    const map = new mapboxgl.Map({
      center: [120.34233, 30.324342],
      attributionControl: false,
      style: "mapbox://styles/mapbox/satellite-v9",
      container: "map",
      zoom: 3,
    });
    map.on("load", (e) => {
      map.addSource("poi", { type: "geojson", data: poi });
      map.addLayer({
        id: "poi-layer",
        source: "poi",
        type: "circle",
        paint: { "circle-radius": 5, "circle-color": "yellow" },
      });
    });
    async function test() {
      let re = await boxSelect("poi-layer");
      document.getElementById("result").innerText = JSON.stringify(re, 2, null);
    }
    function boxSelect(targetLayer) {
      return new Promise((resolve, reject) => {
        var Selected = true;
        map.doubleClickZoom.disable();
        map.getCanvas().style.cursor = "default";
        clearSelect();
        var jsonPoint = {
          type: "FeatureCollection",
          features: [],
        };
        var jsonLine = {
          type: "FeatureCollection",
          features: [],
        };
        var points = [];
        var ele = document.createElement("div");
        ele.setAttribute("class", "measure-result");
        const option = {
          element: ele,
          anchor: "left",
          offset: [8, 0],
        };
        var markers = [];
        var tooltip = new mapboxgl.Marker(option).setLngLat([0, 0]).addTo(map);
        markers.push(tooltip);
        var source = map.getSource("points-area");
        if (source) {
          map.getSource("points-area").setData(jsonPoint);
          map.getSource("line-area").setData(jsonLine);
        } else {
          map.addSource("points-area", {
            type: "geojson",
            data: jsonPoint,
          });
          map.addSource("line-area", {
            type: "geojson",
            data: jsonLine,
          });
          map.addLayer({
            id: "line-area",
            type: "fill",
            source: "line-area",
            paint: {
              "fill-color": "#006aff",
              "fill-opacity": 0.1,
            },
          });
          map.addLayer({
            id: "line-area-stroke",
            type: "line",
            source: "line-area",
            paint: {
              "line-color": "#006aff",
              "line-width": 2,
              "line-opacity": 0.65,
            },
          });
          map.addLayer({
            id: "points-area",
            type: "circle",
            source: "points-area",
            paint: {
              "circle-color": "#006aff",
              "circle-radius": 6,
            },
          });
        }

        function addPoint(coords) {
          jsonPoint.features.push({
            type: "Feature",
            geometry: {
              type: "Point",
              coordinates: coords,
            },
          });
          map.getSource("points-area").setData(jsonPoint);
        }

        map.on("click", function (_e) {
          if (Selected) {
            var coords = [_e.lngLat.lng, _e.lngLat.lat];
            points.push(coords);
            addPoint(coords);
          }
        });
        var boxResult = {};
        map.on("dblclick", function (_e) {
          if (Selected) {
            var coords = [_e.lngLat.lng, _e.lngLat.lat];
            points.push(coords);
            Selected = false;
            markers.forEach((f) => {
              f.remove();
            });
            boxResult.boxGeometry = map.getSource("line-area")["_data"];
            boxResult.area = turf.area(boxResult.boxGeometry);
            boxResult.selectedFeatures = execSelect(
              boxResult.boxGeometry,
              targetLayer
            );
            hightLightFeature(boxResult.selectedFeatures);
            resolve(boxResult);
          }
        });

        map.on("mousemove", function (_e) {
          if (Selected) {
            var coords = [_e.lngLat.lng, _e.lngLat.lat];
            var len = jsonPoint.features.length;
            if (len === 0) {
              ele.innerHTML = "点击绘制多边形";
            } else if (len === 1) {
              ele.innerHTML = "点击继续绘制";
            } else {
              var pts = points.concat([coords]);
              pts = pts.concat([points[0]]);
              var json = {
                type: "Feature",
                geometry: {
                  type: "Polygon",
                  coordinates: [pts],
                },
              };
              map.getSource("line-area").setData(json);
            }
            tooltip.setLngLat(coords);
          }
        });
      });
    }
    function hightLightFeature(features, color = "#06ceff") {
      map.addSource("selected-source", {
        type: "geojson",
        data: {
          type: "FeatureCollection",
          features: [],
        },
      });
      map.addLayer({
        id: "selected-layer",
        type: "circle",
        source: "selected-source",
        paint: {
          "circle-radius": 8,
          "circle-color": color,
        },
      });
      map.getSource("selected-source").setData(features);
    }
    function execSelect(polygon, targetLayer) {
      var extent = turf.bbox(polygon);
      const features = map.queryRenderedFeatures(
        [
          map.project([extent[0], extent[1]]),
          map.project([extent[2], extent[3]]),
        ],
        { layers: [targetLayer] }
      );
      //优化一下,因为有的点不在多边形内,但是还是被选上了;
      const points = features.map((f) => f.geometry.coordinates);
      let withinFeature = turf.pointsWithinPolygon(
        turf.points(points),
        polygon
      );
      return withinFeature;
    }
    function clearSelect() {
      const dom = document.getElementsByClassName("measure-result");
      if (dom.length > 0) {
        for (let index = dom.length - 1; index > -1; index--) {
          dom[index].parentNode.removeChild(dom[index]);
        }
      }
      var source = map.getSource("points");
      var json = {
        type: "FeatureCollection",
        features: [],
      };
      if (source) {
        map.getSource("points").setData(json);
        map.getSource("line-move").setData(json);
        map.getSource("line").setData(json);
      }
      var sourceArea = map.getSource("points-area");
      if (sourceArea) {
        map.getSource("points-area").setData(json);
        map.getSource("line-area").setData(json);
      }
      if (map.getLayer("selected-layer")) {
        map.removeLayer("selected-layer");
        map.removeSource("selected-source");
      }
    }
  </script>
</html>
测试数据:
var poi = {
  type: "FeatureCollection",
  features: [
    {
      type: "Feature",
      properties: { type: "school", name: "susu学校" },
      geometry: {
        type: "Point",
        coordinates: [125.384449, 46.578032],
      },
    },
    {
      type: "Feature",
      properties: { type: "school", name: "混过你学校" },
      geometry: {
        type: "Point",
        coordinates: [122.58806, 50.438486],
      },
    },
    {
      type: "Feature",
      properties: { type: "hospital", name: "司机医院" },
      geometry: {
        type: "Point",
        coordinates: [117.583995, 44.877376],
      },
    },
    {
      type: "Feature",
      properties: { type: "school", name: "损害学校" },
      geometry: {
        type: "Point",
        coordinates: [125.384449, 46.578032],
      },
    },
    {
      type: "Feature",
      properties: { type: "hospital", name: "同样是医院" },
      geometry: {
        type: "Point",
        coordinates: [116.112212, 41.430537],
      },
    },
    {
      type: "Feature",
      properties: { type: "hospital", name: "输液医院" },
      geometry: {
        type: "Point",
        coordinates: [108.311758, 40.538283],
      },
    },
    {
      type: "Feature",
      properties: { type: "school", name: "USB学校" },
      geometry: {
        type: "Point",
        coordinates: [116.700925, 31.783546],
      },
    },
    {
      type: "Feature",
      properties: { type: "market", name: "哈哈超市" },
      geometry: {
        type: "Point",
        coordinates: [97.935682, 37.554957],
      },
    },
    {
      type: "Feature",
      properties: { type: "market", name: "低估超市" },
      geometry: {
        type: "Point",
        coordinates: [86.014234, 44.193101],
      },
    },
    {
      type: "Feature",
      properties: { type: "school", name: "嘎哈学校" },
      geometry: {
        type: "Point",
        coordinates: [85.351931, 32.783785],
      },
    },
    {
      type: "Feature",
      properties: { type: "hospital", name: "六医院" },
      geometry: {
        type: "Point",
        coordinates: [105.44178, 28.00127],
      },
    },
    {
      type: "Feature",
      properties: { type: "market", name: "超市不过" },
      geometry: {
        type: "Point",
        coordinates: [115.008374, 23.944745],
      },
    },
    {
      type: "Feature",
      properties: { type: "hospital", name: "玉兔医院" },
      geometry: {
        type: "Point",
        coordinates: [111.77045, 33.341497],
      },
    },
  ],
};
