Lightning-fast, interactive & responsive 2D & 3D
JavaScript charts.
Next Generation, World’s Fastest JS Charts
Getting Started with LightningChart JS
There’s multiple ways to get started with our JS charting library. You can install the package from NPM or use IIFE bundle. You can use any of our Examples as a seed project and we’ve also created framework templates for you to utilize.

JS Interactive examples
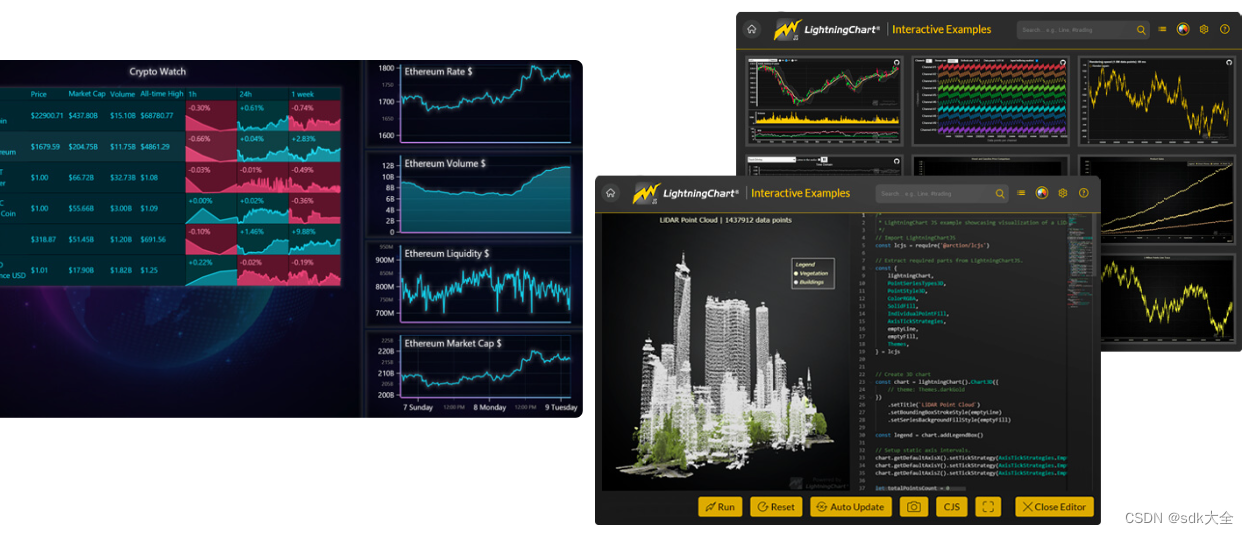
Interactive Examples is an easy-to-use exploration tool to help you get started quickly with the most important concepts. In here you can search, view and edit charts on-the-fly.
API-links can be found conveniently right next to each example and below the chart example there is a link to the example’s GitHub page.
JS Interactive examples API Documentation
arrow icon
lightningchart js interactive examples
high-performance-charts
High-Performance JS Charts
The WebGL-based, cross-platform charting toolkit LightningChart JS was created to provide the greatest performance possible.
The most recent performance statistics show that LightningChart JS can display heatmaps with over 1.2 billion data points, line charts with up to 500 million data points, and scatter charts with over 75 million data points.
Dashboard cell resizing is supported by LightningChart JS for presenting more than 100 charts at once. For the most demanding industries, such as engineering, medicine, vibration analysis, and more, this is ideal.
See more about Performance
Unmatched performance level
LightningChart JS comes with an unmatched execution performance. GPU acceleration & WebGL rendering ensure that your device’s graphics processor is utilized efficiently, which results in high refresh rates and smooth animations.
This charting library combines incredible speed with sturdy load capacity. Find out what world’s highest performance in JavaScript charts really means.
Learn more about LightningChart JS performance levels by running our performance demo. It allows running the online test with any device, and instructions are included.

Introducing DataGrid
DataGrid cryptowatch
An additional grid control compatible with all library visualizations for LightningChart JS V.4.0 or higher.
In dashboards or as a standalone application, the DataGrid component can be utilized for sophisticated real-time status monitoring.
All forms of contents are supported by Data-Grid, along with features like cell merging, in-cell spark charts, user interactions, and dynamic cell coloring.
Leran more about DataGrid
More Chart Types
XY Charts
realtime-OHLC
lightningchart js realtime OHLC
XY Charts
Series types: Line and point series, area series, area range series, OHLC series, rectangles, ellipses, box-whisker and line segment series.
Linear axes can be placed left/right/top/bottom and possibility to have several X and Y axes per chart.
Scaling modes include fitting, Expansion, Progressive/ Regressive and Manual.
Markers and data cursors have customizable shape and styles.
Logarithmic Axes
Can be used with Numeric TickStrategies as well as DateTime TickStrategies.
Base number can be set per Axis by users.
Available with XY charts, supported series types: Line, Point, PointLine, Step, Spline, Area, AreaRange, Rectangle, Segment and OHLC.
Open Example
Advanced 3D Charts
lightningchart js 3D Simple Surface
lightningchart js 3D Simple Surface
Advanced 3D Charts
Series types: Line series, Point series, PointLine series, PointCloud series, Box series, Surface series.
Customize the shape of the Bounding Box of the 3D Chart.
Linear Axes for X, Y and Z planes around Bounding Box of the 3D Chart.
Use Numeric and DateTime format with Axis ticks.
Camera can be controlled to rotate around and zoom in / out of the Chart area.
3D box series
Customizable with value based coloring, solid coloring for all boxes, individual box colors, and the roundness of the Box Shape edges.
Supports dynamic coloring by x, y or z coordinates.
3D surface series
Customizable with: value based coloring, solid coloring, Data-Point based coloring.
Comes with customizable wireframe.
Open Example
Heatmaps
lightningchart js Scrolling Heatmap
lightningchart js Scrolling Heatmap
Heatmaps
Usable in XY Charts.
Create a 2D rectangular heatmap using the IntensityGrid option.
Create a 2D mesh Heatmap using the IntensityMesh option.
Use Heatmaps to create Spectrograms.
Open Example
Zoom Band Charts
lightningchart js Zoom Band Chart
lightningchart js Zoom Band Chart
Zoom Band Charts
Add a customizable, easy-to-use Zoom Band Chart to your XY Charts inside a Dashboard.
Shows an overview of detailed data of the attached charts.
Quick zooming with a band.
Automatically adds all Series inside the Axis it attaches to.
Open Example
Polar Charts
lightningchart js Polar charts
lightningchart js Polar charts
Polar Charts
Series Types (all stylable with familiar API): Line series, Point series, PointLine series, Polygon series and Area series.
Polar Sectors (easily stylable with familiar API). Highlight a section of the Polar Chart with ease.
Can be rotated via API.
AutoCursor is available for Polar Charts.
Can be used as a stand-alone Chart, or in a Dashboard.
Open Example
Pie / Donut charts
pie-chart
pie-chart
Pie / Donut charts
Slices can be styled using different fill and border-styles.
Fully customizable sorting and formatting of Slices.
Slice value transitions as well as disposing/restoring are animated.
Two designs:
Labels on side with connector-lines
Labels inside Slices
Slices can be “exploded” programmatically or by mouse/touch.
Open Example
Funnel Charts
funnel-chart
funnel-chart
Funnel Charts
Slices can be styled using different fill and stroke styles.
Slices can have empty gaps in between.
Fully customizable sorting and formatting of slices.
Labels can be set on side with connector lines or inside slices.
Two different ways to show the slices based on their values: Variable width and Variable height.
Slices can be animated. Changing values of slices, adding and removing slices support animations.
User can enable or disable animations for all slices.
Open Example
Gauge Charts
lightningchart js solid gauge chart
lightningchart js solid gauge chart
Gauge Charts
Gauge can be styled using different fill and stroke styles.
Set the thickness of the Gauge.
Gauge Slice can be styled using different fill styles.
Fully customizable formatting and styling of slices.
Customize the start and end angles of the gauge.
Customize the value interval of the gauge.
Gauge value change, interval and angle transitions and gauge dispose/restore are animated.
Open Example
Pyramid Charts
lightningchart js pyramid chart
lightningchart js pyramid chart
Pyramid Charts
Slices can be styled using different fill and stroke styles.
Slices can have empty gaps in between.
Fully customizable sorting and formatting of slices.
Labels can be set on side with connector lines or inside slices.
Slices can be animated. Changing values of slices, adding and removing slices support animations.
User can enable or disable animations for all slices.
Open Example
Radar / Spider charts
lightningchart js Spider Static
spider-static-chart
Radar / Spider charts
Categorical automatically generated axes.
Round and lines grid.
Line, point and filled area series.
Scaling modes include fitting, expansion and manual.
Data cursors have customizable shape and styles.
Open Example
Map Charts
map chart
lightningchart JS map charts
Map Charts
Can be used as a stand-alone Chart component or placed inside a Dashboard.
Supports following views: World, USA, North America, South America, Canada, Europe, Asia, Africa and Australia.
Supports Auto Cursor feature for displaying region data with mouse.
Can be colored with solid color for entire map, or with dynamic color per region.
Supports LUT UI element for visualizing dynamic color table.
Supports real-time updates.
Open Example
Intuitive User Experience
dashboards
Dashboard
Easy and convenient to manage dozens of charts, legend boxes, buttons, check boxes and other UI elements. Resource-efficient rendering of all charts in one GPU scene also makes resizing columns and rows very fast.
interactive-charts
Interactive Charts
JavaScript Charts with smooth animations exceeding all industry standards in amount of data per chart. Intuitive touch screen interactivity with zooming, panning, moving data cursors etc.
webGl-rendering
WebGL rendering
GPU acceleration & WebGL rendering ensure that your device’s graphics processor is utilized efficiently, which results in outstanding execution performance.
npm
Server side rendering
LightningChart JS supports Server side rendering. It can be used with our headless package available in npm. Use our charts in a server application to produce high-quality chart images.

