文章说明:
1)参考资料:PYG官方文档。超链。
2)博主水平不高,如有错误还望批评指正。
文章目录
- 自定义数据集动手实现图神经网络
- 自定义数据集
- 训验测集拆分,创建Data的数据结构,观察Data的基本信息,可视化图网络
- 搭建模型,训练前的准备,训练模型得出结果并可视化
- 结果分析
- 完整代码
- 后记
自定义数据集动手实现图神经网络
自定义数据集
导库
from random import randint,sample
数据背景描述:这段代码生成北京化工大学三个学院(国际教育学院(100个学生),数理学院(300个学生),信息学院(500个学生))共计900个学生社交网络。每个学生,学院内部随机认识随机个人;学院外部随机认识随机个人,从而搭建边的关系。具体如何随机只能请看代码,鉴于篇幅原因不再过多赘述。
class dataset:

    def __init__(self):
        self.data_x=[];self.data_y=[]
        for i in range(100):
            lt=[0 for i in range(900)]
            lt[i]=1
            self.data_x.append(lt)
            self.data_y.append(0)
        for i in range(100,400):
            lt=[0 for i in range(900)]
            lt[i]=1
            self.data_x.append(lt)
            self.data_y.append(1)
        for i in range(400,900):
            lt=[0 for i in range(900)]
            lt[i]=1
            self.data_x.append(lt)
            self.data_y.append(2)
        self.data_edge=[[],[]]
        lt1=[i for i in range(100)];lt2=[i for i in range(100,400)];lt3=[i for i in range(400,900)]
        lt4=lt2+lt3;lt5=lt1+lt3;lt6=lt1+lt2;lt7=lt1+lt2+lt3
        for i in range(100):
            j=randint(30,70)
            for k in range(j):
                self.data_edge[0].append(i)
            self.data_edge[1].extend(sample(lt7[:i]+lt7[i+1:100],j))
            j=randint(0,10)
            for k in range(j):
                self.data_edge[0].append(i)
            self.data_edge[1].extend(sample(lt4,j))
        for i in range(100,400):
            j=randint(50,100)
            for k in range(j):
                self.data_edge[0].append(i)
            self.data_edge[1].extend(sample(lt7[100:i]+lt7[i+1:400],j))
            j=randint(0,10)
            for k in range(j):
                self.data_edge[0].append(i)
            self.data_edge[1].extend(sample(lt5,j))
        for i in range(400,900):
            j=randint(75,125)
            for k in range(j):
                self.data_edge[0].append(i)
            self.data_edge[1].extend(sample(lt7[400:i]+lt7[i+1:],j))
            j=randint(0,10)
            for k in range(j):
                self.data_edge[0].append(i)
            self.data_edge[1].extend(sample(lt6,j))

    def x(self):
        return self.data_x

    def edge(self):
        return self.data_edge

    def y(self):
        return self.data_y
训验测集拆分,创建Data的数据结构,观察Data的基本信息,可视化图网络
导库
from torch_geometric.data import Data
import torch
训验测集拆分:对数据集随机拆分。train_val_test_split中,a代表训练集比例,b代表验证集比例,所以测试集比例为1-a-b啦。c代表了至少保证训练集中每个类别至少c个,否则一直循环随机去构建训练集,直到满足每个类别至少c个。最后返回三个长度为900的布尔列表吧。
def caozuo(lt):
    lt_new=[False for i in range(900)]
    for i in lt:
        lt_new[i]=True
    return lt_new

def T_or_F(lt,d):
    a,b,c=0,0,0
    for i in lt:
        if i<100:
            a+=1
        elif i<400:
            b+=1
        elif i<900:
            c+=1
        if a>=d and b>=d and c>=d:
            return True
    return False

def train_val_test_split(a,b,c):
    while True:
        lt=sample([i for i in range(900)],900)
        train_index=lt[:int(900*a)];val_index=lt[int(900*a):int(900*a+900*b)];test_index=lt[int(900*a+900*b):]
        if T_or_F(train_index,c)==False:
            continue
        else:
            return caozuo(train_index),caozuo(val_index),caozuo(test_index)
data=dataset();x=torch.Tensor(data.x());edge=torch.LongTensor(data.edge());y=torch.LongTensor(data.y());lt1,lt2,lt3=train_val_test_split(0.1,0.3,5)
创建Data的数据结构,观察Data的基本信息:简单说明一下 x x x 吧 , x : 900 × 900 x:900 \times 900 x:900×900 单位阵,表示第i个节点在第i维度。这个特征矩阵不算是通常意义上特征矩阵,信息有限。
data=Data(x=x,edge_index=edge,y=y,train_mask=torch.BoolTensor(lt1),val_mask=torch.BoolTensor(lt2),test_mask=torch.BoolTensor(lt3));print(data)
#输出:Data(x=[900, 900], edge_index=[2, 81246], y=[900], train_mask=[900], val_mask=[900], test_mask=[900])
导库
from torch_geometric.utils import to_networkx
import matplotlib.pyplot as plt
import networkx as nx
可视化图网络
def visualize_graph(G,color):
    plt.style.use("seaborn");plt.rcParams['font.family']='SimHei';plt.rcParams['font.sans-serif']=['SimHei']
    plt.figure(figsize=(16,9));plt.title("国教,数理,信息学院学生社交网络",size=20);plt.xticks([]);plt.yticks([])
    nx.draw_networkx(G,pos=nx.spring_layout(G),with_labels=False,node_size=3,node_color=color,width=0.01,edge_color="black",cmap="Set2")
    legend_dict={"red":"国教","blue": "数理","green":"信息"};plt.legend(handles=[plt.Line2D([],[],color=c,label=l,linestyle='None',marker='o') for c, l in zip(legend_dict.keys(),legend_dict.values())],loc='upper right')
    plt.savefig("figure",dpi=1000)
G=to_networkx(data,to_undirected=True);visualize_graph(G,color=["red"]*100+["blue"]*300+["green"]*500)

搭建模型,训练前的准备,训练模型得出结果并可视化
导库
from torch_geometric.nn import GCNConv
import torch.nn.functional as F
搭建模型
class GCN(torch.nn.Module):
    def __init__(self,hidden_channels):
        super().__init__()
        self.conv1=GCNConv(900,hidden_channels)
        self.conv2=GCNConv(hidden_channels,3)
    def forward(self,x,edge_index):
        x=self.conv1(x,edge_index)
        x=x.relu()
        x=F.dropout(x,p=0.5,training=self.training)
        x=self.conv2(x,edge_index)
        return x
训练前的准备
model=GCN(9);optimizer=torch.optim.Adam(model.parameters(),lr=0.01,weight_decay=5e-4);criterion=torch.nn.CrossEntropyLoss()
训练模型得出结果并可视化
def train():
    model.train()
    optimizer.zero_grad()
    out=model(data.x,data.edge_index)
    loss=criterion(out[data.train_mask],data.y[data.train_mask])
    loss.backward()
    optimizer.step()
    return loss

def test():
    model.eval()
    out=model(data.x,data.edge_index)
    pred=out.argmax(dim=1)
    test_correct=pred[data.test_mask]==data.y[data.test_mask]
    test_acc=int(test_correct.sum())/int(data.test_mask.sum())
    return test_acc
for epoch in range(1,101):
    loss=train()
    print(f'Epoch: {epoch:03d}, Loss: {loss:.4f}')
test_acc=test()
print(f'Test Accuracy: {test_acc:.4f}')
#这里就只展示测试集的结果
#输出:1.00
损失函数下降曲线

T-SNE可视化
模型未训练只经过一次正向传播

训练好后
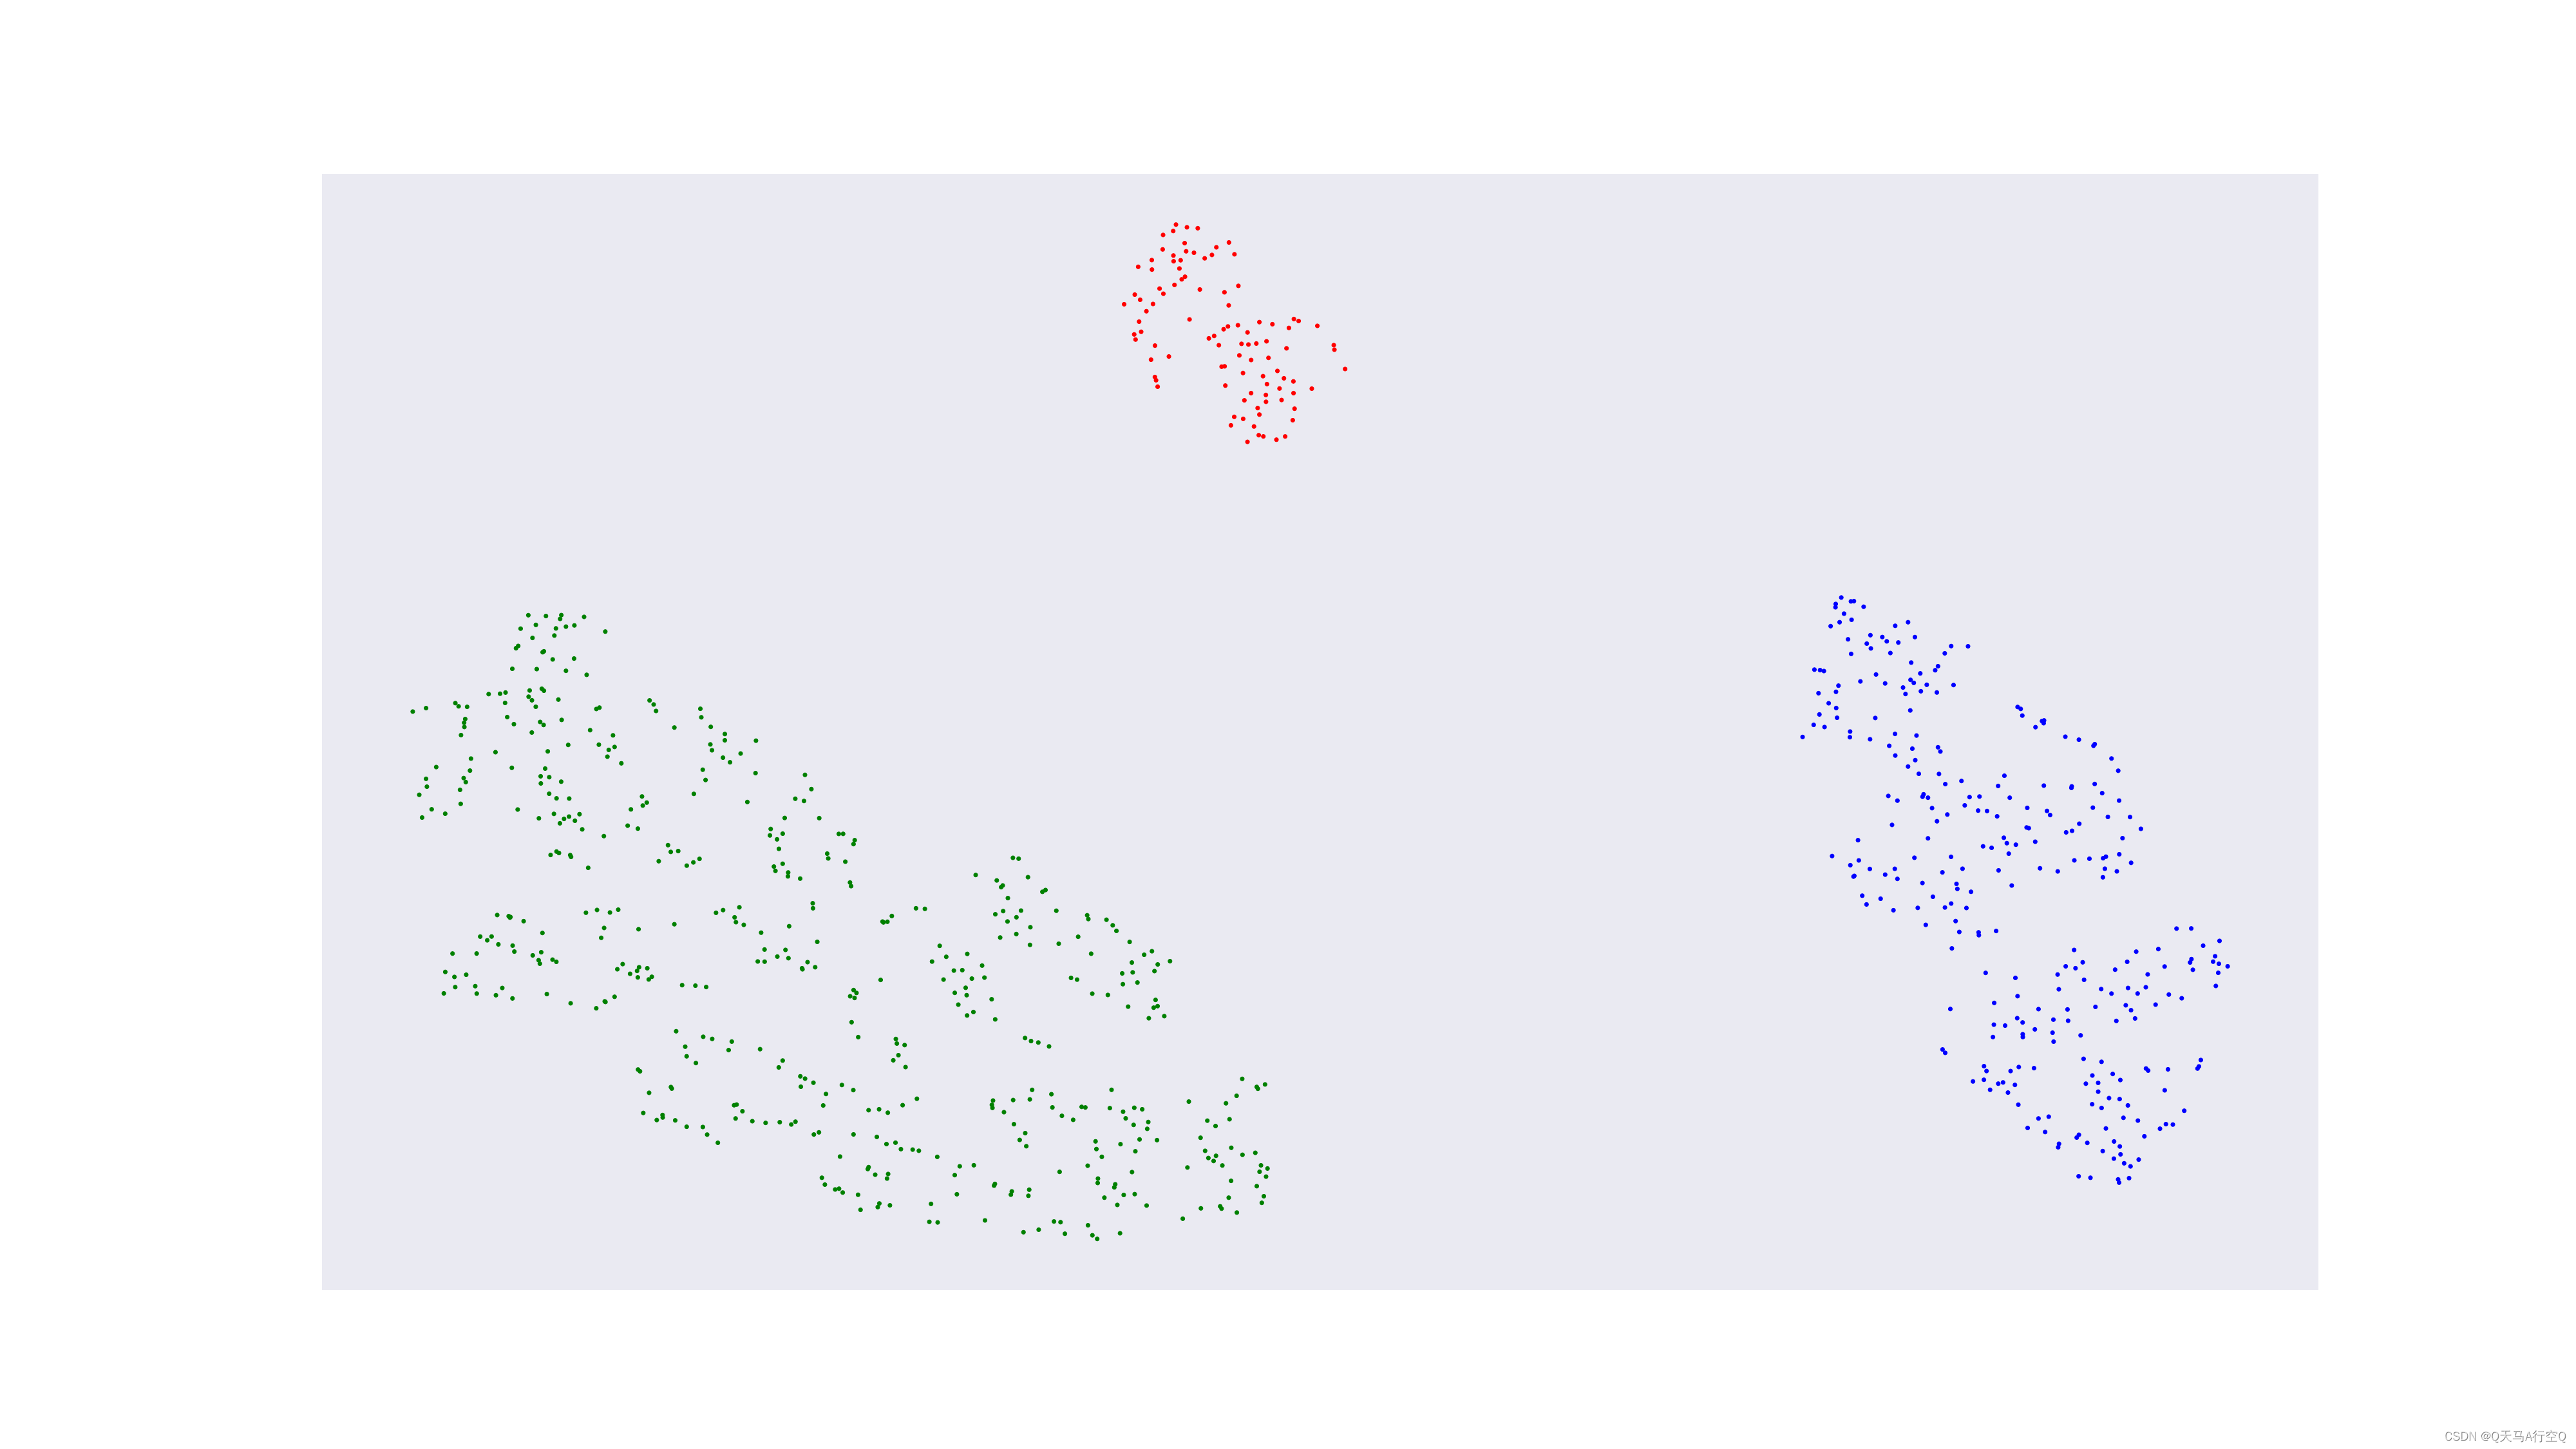
结果分析
模型在测试集表现很好为1,那么效果为什么会这么好呢。数据集就很好,创建数据集的时候忽略了很多的现实因素,比如,有的同学它是社交恐怖分子认识全校80%的人,或者有的同学刚刚转院等等现实情况,所以这里创建的数据集十分理想,加之模型本身很好,最终导致了很好的结果。我们可以在数据集构建几个转院同学看看结果但是我就不做了吧。
完整代码
from torch_geometric.utils import to_networkx
from torch_geometric.nn import GCNConv
from torch_geometric.data import Data
from random import randint,sample
from sklearn.manifold import TSNE
import matplotlib.pyplot as plt
import torch.nn.functional as F
import networkx as nx
import numpy as np
import torch

def train():
    model.train()
    optimizer.zero_grad()
    out=model(data.x,data.edge_index)
    loss=criterion(out[data.train_mask],data.y[data.train_mask])
    loss.backward()
    optimizer.step()
    return loss

def test():
    model.eval()
    out=model(data.x,data.edge_index)
    pred=out.argmax(dim=1)
    test_correct=pred[data.test_mask]==data.y[data.test_mask]
    test_acc=int(test_correct.sum())/int(data.test_mask.sum())
    return test_acc

def visualize(h,color,s):
    z=TSNE(n_components=2).fit_transform(h.detach().cpu().numpy())
    plt.style.use("seaborn");plt.figure(figsize=(16,9));plt.xticks([]);plt.yticks([])
    plt.scatter(z[:,0],z[:,1],s=3,c=color)
    plt.savefig("figure"+str(s),dpi=1000)

class GCN(torch.nn.Module):
    def __init__(self,hidden_channels):
        super().__init__()
        self.conv1=GCNConv(900,hidden_channels)
        self.conv2=GCNConv(hidden_channels,3)
    def forward(self,x,edge_index):
        x=self.conv1(x,edge_index)
        x=x.relu()
        x=F.dropout(x,p=0.5,training=self.training)
        x=self.conv2(x,edge_index)
        return x

def visualize_graph(G,color):
    plt.style.use("seaborn");plt.rcParams['font.family']='SimHei';plt.rcParams['font.sans-serif']=['SimHei']
    plt.figure(figsize=(16,9));plt.title("国教,数理,信息学院学生社交网络",size=20);plt.xticks([]);plt.yticks([])
    nx.draw_networkx(G,pos=nx.spring_layout(G),with_labels=False,node_size=3,node_color=color,width=0.01,edge_color="black",cmap="Set2")
    legend_dict={"red":"国教","blue": "数理","green":"信息"};plt.legend(handles=[plt.Line2D([],[],color=c,label=l,linestyle='None',marker='o') for c, l in zip(legend_dict.keys(),legend_dict.values())],loc='upper right')
    plt.savefig("figure1",dpi=1000)

def caozuo(lt):
    lt_new=[False for i in range(900)]
    for i in lt:
        lt_new[i]=True
    return lt_new

def T_or_F(lt,d):
    a,b,c=0,0,0
    for i in lt:
        if i<100:
            a+=1
        elif i<400:
            b+=1
        elif i<900:
            c+=1
        if a>=d and b>=d and c>=d:
            return True
    return False

def train_val_test_split(a,b,c):
    while True:
        lt=sample([i for i in range(900)],900)
        train_index=lt[:int(900*a)];val_index=lt[int(900*a):int(900*a+900*b)];test_index=lt[int(900*a+900*b):]
        if T_or_F(train_index,c)==False:
            continue
        else:
            return caozuo(train_index),caozuo(val_index),caozuo(test_index)

class dataset:

    def __init__(self):
        self.data_x=[];self.data_y=[]
        for i in range(100):
            lt=[0 for i in range(900)]
            lt[i]=1
            self.data_x.append(lt)
            self.data_y.append(0)
        for i in range(100,400):
            lt=[0 for i in range(900)]
            lt[i]=1
            self.data_x.append(lt)
            self.data_y.append(1)
        for i in range(400,900):
            lt=[0 for i in range(900)]
            lt[i]=1
            self.data_x.append(lt)
            self.data_y.append(2)
        self.data_edge=[[],[]]
        lt1=[i for i in range(100)];lt2=[i for i in range(100,400)];lt3=[i for i in range(400,900)]
        lt4=lt2+lt3;lt5=lt1+lt3;lt6=lt1+lt2;lt7=lt1+lt2+lt3
        for i in range(100):
            j=randint(30,70)
            for k in range(j):
                self.data_edge[0].append(i)
            self.data_edge[1].extend(sample(lt7[:i]+lt7[i+1:100],j))
            j=randint(0,10)
            for k in range(j):
                self.data_edge[0].append(i)
            self.data_edge[1].extend(sample(lt4,j))
        for i in range(100,400):
            j=randint(50,100)
            for k in range(j):
                self.data_edge[0].append(i)
            self.data_edge[1].extend(sample(lt7[100:i]+lt7[i+1:400],j))
            j=randint(0,10)
            for k in range(j):
                self.data_edge[0].append(i)
            self.data_edge[1].extend(sample(lt5,j))
        for i in range(400,900):
            j=randint(75,125)
            for k in range(j):
                self.data_edge[0].append(i)
            self.data_edge[1].extend(sample(lt7[400:i]+lt7[i+1:],j))
            j=randint(0,10)
            for k in range(j):
                self.data_edge[0].append(i)
            self.data_edge[1].extend(sample(lt6,j))

    def x(self):
        return self.data_x

    def edge(self):
        return self.data_edge

    def y(self):
        return self.data_y

if __name__=="__main__":
    data=dataset();x=torch.Tensor(data.x());edge=torch.LongTensor(data.edge());y=torch.LongTensor(data.y());lt1,lt2,lt3=train_val_test_split(0.1,0.3,5)
    data=Data(x=x,edge_index=edge,y=y,train_mask=torch.BoolTensor(lt1),val_mask=torch.BoolTensor(lt2),test_mask=torch.BoolTensor(lt3));print(data)
    G=to_networkx(data,to_undirected=True);visualize_graph(G,color=["red"]*100+["blue"]*300+["green"]*500)
    model=GCN(9);optimizer=torch.optim.Adam(model.parameters(),lr=0.01,weight_decay=5e-4);criterion=torch.nn.CrossEntropyLoss()
    model.eval();out=model(data.x,data.edge_index);visualize(out,color=["red"]*100+["blue"]*300+["green"]*500,s=2)
    lt=[]
    for epoch in range(1,101):
        loss=train();lt.append(loss.item())
        print(f'Epoch: {epoch:03d}, Loss: {loss:.4f}')
    test_acc=test()
    print(f'Test Accuracy: {test_acc:.4f}')
    plt.style.use("seaborn");plt.rcParams['font.family']='SimHei';plt.rcParams['font.sans-serif']=['SimHei']
    plt.figure(figsize=(16,9));plt.title("损失函数下降曲线",size=20)
    plt.plot([i for i in range(len(lt))],lt,marker="o",ms=3,color="red",linewidth=1,label="交叉熵")
    plt.xticks([i for i in range(0,len(lt),10)],[i+1 for i in range(0,len(lt),10)]);plt.legend();plt.savefig("figure3",dpi=1000)
    model.eval();out=model(data.x,data.edge_index);visualize(out,color=["red"]*100+["blue"]*300+["green"]*500,s=4)
后记
应该会再写一篇文章吧,我们从底层实现PYG,就不导库了吧,然后具体讲讲GCN是怎么操作。然后,我们结束图神经网络在无向图中节点分类这个话题。


