Title
题目
CLANet: A comprehensive framework for cross-batch cell line identificationusing brightfield images
CLANet:基于明场图像的跨批次细胞系识别综合框架
01
文献速递介绍
细胞系鉴定(Cell Line Authentication,CLA)是验证科学研究中所用细胞系身份的关键过程。这一验证至关重要,因为细胞系可能会被误标、受到污染或随着时间的推移发生变化,进而可能影响研究结果的可靠性和可重复性(Ioannidis, 2005; Boonstra et al., 2010)。目前,短串联重复(STR)分析是鉴定细胞系身份的金标准,通常用于确认细胞系的身份。然而,这种方法也存在一定的局限性(Masters et al., 2001; Freedman et al., 2015)。长期培养、亚克隆和选择过程可能引发微卫星不稳定性和杂合性丧失,尤其是在癌细胞系中,这可能导致传统STR方法难以检测的遗传漂移(Parson et al., 2005)。此外,同基因细胞系在这种方法下也面临鉴定的挑战(Reid et al., 2013)。同时,由于时间和成本的限制,通常的做法是在细胞完全扩增并冷冻后进行测试。然而,如果样本未通过STR分析,可能导致浪费时间和资源。
机器学习(Machine Learning,ML)技术的进步显著推动了基于图像的细胞分析(Image-based Cell Profiling,ICP)的发展,使其成为一种快速、经济有效的分析方法,同时也有可能检测出细胞形态发生变化的情况,这些变化可能表明不良特性,例如遗传漂移或细胞衰老。ICP的典型工作流程包括通过显微镜技术捕捉细胞图像,接着从图像中提取形态特征,最后使用针对特定目标应用的计算模型进行分析(Caicedo et al., 2016)。现有的研究已经成功地通过荧光图像或从细胞绘画检测中获得的多通道图像检测基因干扰(Caicedo et al., 2017; Chandrasekaran et al., 2021; Cross-Zamirski et al., 2022)。
Aastract
摘要
Cell line authentication plays a crucial role in the biomedical field, ensuring researchers work with accuratelyidentified cells. Supervised deep learning has made remarkable strides in cell line identification by studyingcell morphological features through cell imaging. However, biological batch (bio-batch) effects, a significantissue stemming from the different times at which data is generated, lead to substantial shifts in the underlyingdata distribution, thus complicating reliable differentiation between cell lines from distinct batch cultures. Toaddress this challenge, we introduce CLANet, a pioneering framework for cross-batch cell line identificationusing brightfield images, specifically designed to tackle three distinct bio-batch effects. We propose a cellcluster-level selection method to efficiently capture cell density variations, and a self-supervised learningstrategy to manage image quality variations, thus producing reliable patch representations. Additionally,we adopt multiple instance learning(MIL) for effective aggregation of instance-level features for cell lineidentification. Our innovative time-series segment sampling module further enhances MIL’s feature-learningcapabilities, mitigating biases from varying incubation times across batches. We validate CLANet using datafrom 32 cell lines across 93 experimental bio-batches from the AstraZeneca Global Cell Bank. Our results showthat CLANet outperforms related approaches (e.g. domain adaptation, MIL), demonstrating its effectiveness inaddressing bio-batch effects in cell line identification.
细胞系鉴定在生物医学领域中起着至关重要的作用,确保研究人员使用的是准确鉴定的细胞。通过细胞成像研究细胞形态特征,监督式深度学习在细胞系鉴定方面取得了显著进展。然而,由于数据生成时间的不同,生物批次(bio-batch)效应导致底层数据分布发生显著变化,给不同批次培养的细胞系之间的可靠区分带来了困难。为了解决这一挑战,我们提出了CLANet,这是一种基于明场图像的跨批次细胞系识别的开创性框架,专门设计用于应对三种不同的生物批次效应。我们提出了一种细胞簇级别的选择方法,以高效捕捉细胞密度变化,并通过自监督学习策略来应对图像质量变化,从而生成可靠的图像块表示。此外,我们采用了多实例学习(MIL)来有效聚合实例级别的特征用于细胞系鉴定。我们的创新性时间序列片段采样模块进一步增强了MIL的特征学习能力,缓解了不同批次培养时间变化带来的偏差。我们使用来自阿斯利康全球细胞库的32种细胞系和93个实验生物批次的数据验证了CLANet。结果显示,CLANet在处理细胞系鉴定中的生物批次效应方面表现优于相关方法(如领域适应、多实例学习),证明了其有效性。
Method
方法
Our proposed framework comprises three stages (Fig. 3): (1) extracting significant cell patches from the time-series image sequence; (2)self-supervised learning to learn and extract feature embeddings fromthe extracted patches; (3) feature fusion using the MIL aggregator forpredicting cell line identity.In this section, we identify three special forms of bio-batch effectsand introduce our proposed tailored solutions for each challenge. Toformulate our algorithm, we define our dataset as { (X𝑠 , Y𝑠 ) }𝑆𝑠=1, whereX𝑠represents an image sequence obtained from a single microscopylocation within a flask, and Y𝑠* ∈ (1, 𝐶) denotes the class label, with Cbeing the total number of classes. The image sequence X𝑠 = { 𝑋**𝑛 }𝑁𝑛=1comprises 𝑁 cell images, each have a fixed size 𝑊 × 𝐻. An incubationtimestamp set is defined as T𝑠 = { 𝑇𝑛 }𝑁𝑛=1, corresponding to each cellimage.
我们提出的框架由三个阶段组成(图3):(1) 从时间序列图像中提取重要的细胞图像块;(2) 通过自监督学习来学习和提取这些图像块的特征嵌入;(3) 使用多实例学习(MIL)聚合器进行特征融合,以预测细胞系的身份。在本节中,我们识别出三种特殊形式的生物批次效应,并针对每个挑战提出了定制的解决方案。为了构建我们的算法,我们将数据集定义为 { (X𝑠 , Y𝑠 ) }𝑆𝑠=1,其中 X𝑠 表示从培养瓶内某一显微镜位置获取的图像序列,Y𝑠 ∈ (1, 𝐶) 表示类别标签,C 为类别总数。图像序列 X𝑠 = { 𝑋𝑛 }𝑁𝑛=1 包含 𝑁 张细胞图像,每张图像的尺寸固定为 𝑊 × 𝐻。定义一个培养时间戳集合 T𝑠 = { 𝑇𝑛 }𝑁𝑛=1,对应每张细胞图像。
Conclusion
结论
In this study, we present a novel framework specifically tailoredfor cross-batch cell line identification using brightfield images. Wepostulate three distinct forms of bio-batch effects and propose targeted solutions for each, marking a pioneering effort in addressingcross-batch cell line identification based on brightfield images.Our framework incorporates a cell-cluster level selection strategyto capture representative cell patches, accounting for the impact of celldensity on cell images. To mitigate the risk of bio-batch effect inducedbiased predictions and to generate robust patch embeddings, we introduce a self-supervised learning strategy. Further, we adopt multipleinstance learning to fuse patch embeddings for cell line identificationand propose a novel time-series segment sampling module designed toaddress the bias introduced by varying incubation times among cellbio-batches.To support our research, we have amassed a large-scale datasetfrom AstraZeneca Global Cell Bank. Through comprehensive analysisand ablation studies, we demonstrate the effectiveness of our proposed framework in handling batch-separated tasks. Each componentof our framework contributes significantly to the overall performance,showcasing its effectiveness in tackling the challenges inherent incross-batch cell line identification based on brightfield images.
在本研究中,我们提出了一个专门为基于明场图像的跨批次细胞系识别设计的新框架。我们假设存在三种不同形式的生物批次效应,并为每种效应提出了针对性的解决方案,这是首次在明场图像基础上解决跨批次细胞系识别问题的创新尝试。
我们的框架结合了细胞簇级别选择策略,以捕捉具有代表性的细胞图像块,考虑了细胞密度对细胞图像的影响。为了减少生物批次效应导致的偏差预测风险,并生成鲁棒的图像块嵌入,我们引入了自监督学习策略。此外,我们采用了多实例学习来融合图像块嵌入以进行细胞系识别,并提出了一个新颖的时间序列片段采样模块,旨在解决不同生物批次间培养时间变化引入的偏差。
为支持我们的研究,我们从阿斯利康全球细胞库收集了大规模数据集。通过综合分析和消融研究,我们证明了所提出框架在处理批次分离任务中的有效性。框架的每个组件对整体性能均作出了显著贡献,展示了其在基于明场图像的跨批次细胞系识别中应对相关挑战的有效性。
Results
结果
This section delineates the experimental results of our study. Initially, we quantitatively evaluate the performance of our proposedmethod on two distinct data splitting tasks, benchmarking it againstvarious related methodologies. Subsequently, we explore the efficacy ofindividual components within our framework via comprehensive ablation studies, focusing on the impact of critical parameters. Additionally,we perform a qualitative analysis coupled with an examination offailure cases to offer deeper insights into the nuances of our approach.Finally, we summarize the key contributions of our research.
本节详细阐述了我们研究的实验结果。首先,我们对提出的方法在两种不同的数据划分任务中的表现进行了定量评估,并与多种相关方法进行了对比。随后,通过全面的消融实验,探讨了框架中各个组件的有效性,重点分析了关键参数的影响。此外,我们还进行了定性分析,并对失败案例进行了详细的探讨,以更深入地了解我们方法的细微差别。最后,我们总结了本研究的主要贡献。
Figure
图
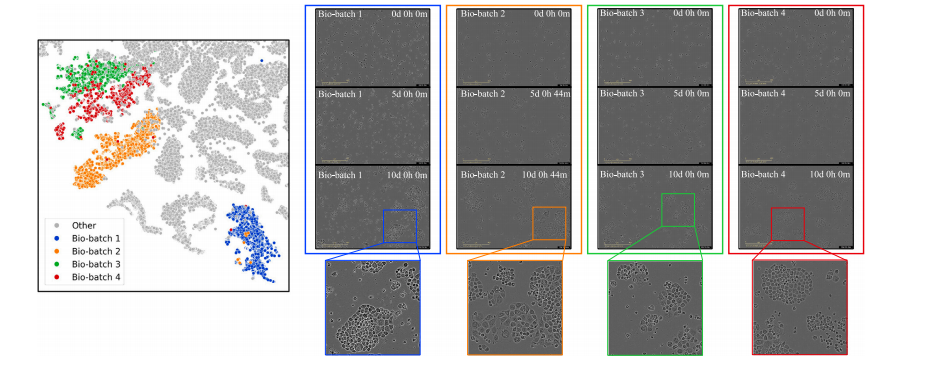
Fig. 1. Illustration of bio-batch effects in cell line image data. The t-SNE plot depicts cell images as points, with colorful points representing four distinct batches from CAMA1cell lines and gray points representing data from other cell lines. In the subsequent columns, 3 example images are provided for each bio-batch. The bio-batch ID and the timepoint of incubation are labeled with white text in each image.
图1. 细胞系图像数据中生物批次效应的示意图。t-SNE图将细胞图像表示为点,其中彩色点代表来自CAMA1细胞系的四个不同批次,灰色点代表来自其他细胞系的数据。在后续列中,为每个生物批次提供了3个示例图像。每张图像中以白色文字标注了生物批次ID和培养时间点。
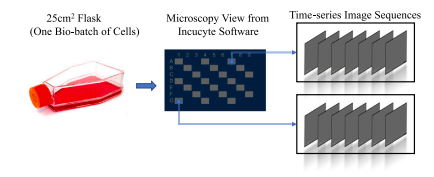
Fig. 2. The workflow of the data collection. Cells are seeded in a 25 cm2 flask. Themicroscopy view of the flask is captured by the Incucyte software. Time-series imagesequences can be eported from different locations (gray areas) across the flask.
图2. 数据采集的工作流程。细胞被接种在25 cm²的培养瓶中。通过Incucyte软件捕捉培养瓶的显微镜视图。可以从培养瓶的不同位置(灰色区域)导出时间序列图像。
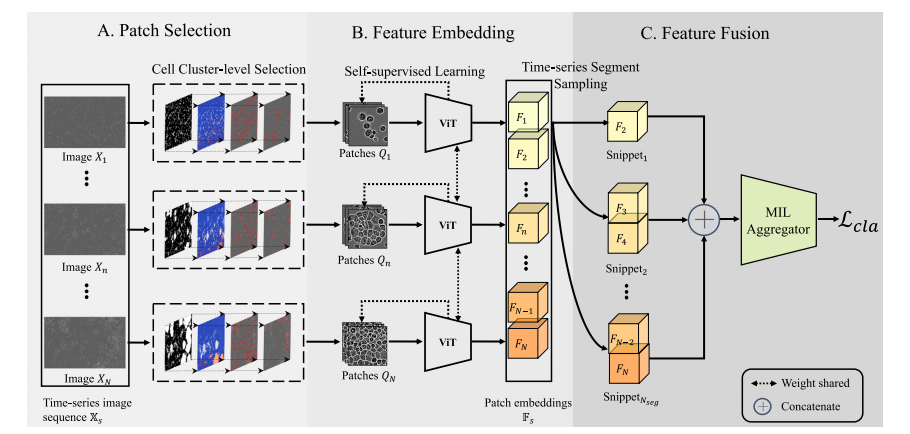
Fig. 3. Pipeline of our proposed CLANet. A time-series cell image sequence X𝑠 is obtained from a single microscopy location within a flask. Each cell image 𝑋**𝑛 undergoes theCell Cluster-level Selection to generate patches 𝑄**𝑛 . Patch embeddings are extracted from patches using self-supervised learning, forming the patch embedding sequence F𝑠 . Duringtraining, the Time-series Segment Sampling is applied to sample the patch embedding sequence into several snippets, which are then fed into a multiple instance learning (MIL)aggregator to compute the classification loss . During the inference stage, the complete embedding sequence is directly passed into the MIL aggregator to obtain the predictedlabel.
图3. 我们提出的CLANet流程。时间序列细胞图像序列X𝑠 是从培养瓶内某一显微镜位置获取的。每张细胞图像 𝑋𝑛 经过细胞簇级别的选择生成图像块 𝑄𝑛。通过自监督学习从图像块中提取嵌入,形成图像块嵌入序列 F𝑠。在训练过程中,应用时间序列片段采样,将图像块嵌入序列划分为多个片段,然后将这些片段输入多实例学习(MIL)聚合器以计算分类损失 𝑎。在推理阶段,完整的嵌入序列将直接传入MIL聚合器以获得预测标签。
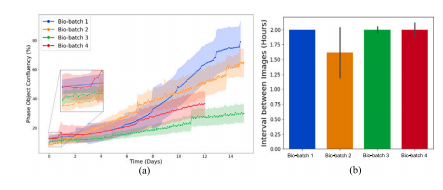
Fig. 4. Batch-to-batch Variations in four bio-batches of data from the CAMA1 cellline. (a) Variations in cell confluency over time. This figure illustrates the changes incell confluency over time for four distinct bio-batches. Each curve, accompanied by ashaded band, represents the mean and standard deviation of cell confluency values forimage sequences within the same bio-batch. (b) Variations in the average time interval(± standard deviation) between cell images in the four bio-batches.
图4. CAMA1细胞系四个生物批次数据中的批次间变化。(a) 随时间变化的细胞汇合度差异。该图展示了四个不同生物批次中细胞汇合度随时间的变化。每条曲线及其伴随的阴影带表示同一生物批次中图像序列的细胞汇合度均值和标准差。(b) 四个生物批次中细胞图像间平均时间间隔(±标准差)的差异。
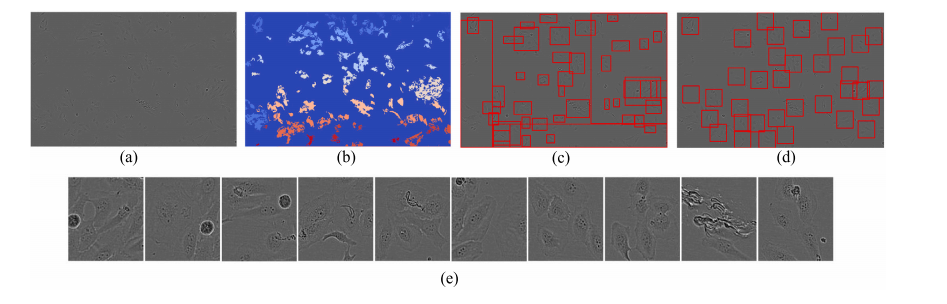
Fig. 5. Outlines of the proposed Cell Cluster-level Selection (CCS). (a) a cell image. (b) connected region map. (c) initial bboxes. (d) candidate patches. (e) top 10 patches withthe highest cell densities.
图5. 所提出的细胞簇级别选择(CCS)流程示意图。(a) 细胞图像。(b) 连通区域图。(c) 初始边界框。(d) 候选图像块。(e) 细胞密度最高的前10个图像块。
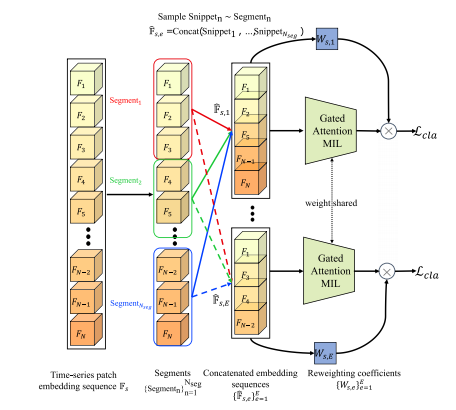
Fig. 6. Illustration of the proposed Time-series Segment Sampling (TSS) for MultipleInstance Learning (MIL). A complete time-series patch embedding sequence F𝑠 willbe partitioned into non-overlapping segments { Segment𝑛 }𝑁seg𝑛=1 . A Snippet𝑛 is uniformlysampled from Segment𝑛 . In each training epoch 𝑒, a constructed embedding sequencêF𝑠,𝑒 will to fed into the gated Attention MIL and compute a classification loss 𝑐𝑙𝑎 withthe weight coefficient 𝑊𝑠,𝑒 .
图6. 所提出的多实例学习(MIL)时间序列片段采样(TSS)示意图。完整的时间序列图像块嵌入序列 F𝑠 将被划分为不重叠的片段 { Segment𝑛 }𝑁seg𝑛=1 。从每个 Segment𝑛 中均匀采样出 Snippet𝑛 。在每个训练周期 𝑒 中,构建的嵌入序列 ̂F𝑠,𝑒 将被输入带门控注意力的MIL模型,并使用权重系数 𝑊𝑠,𝑒 计算分类损失 。
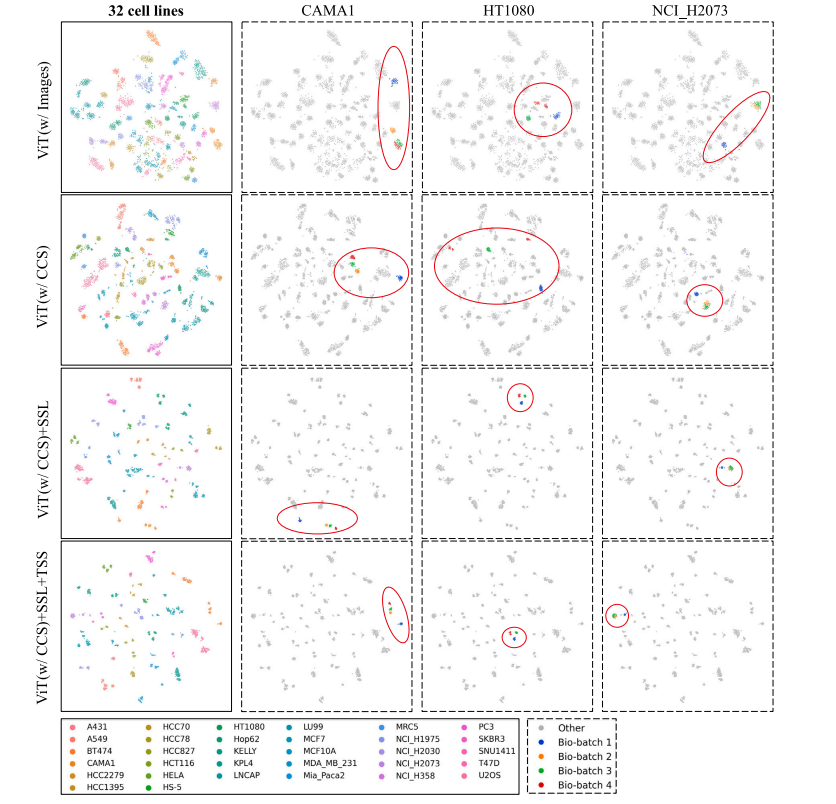
Fig. 7. TSNE embeddings of the dataset. Each point represents an image sequence, with the corresponding feature vector captured from the GAMIL aggregator. The first column’sfigures illustrate the global distribution of 32 cell lines, while columns 2–4 showcase three example cell lines colored by their bio-batch ID.
图7. 数据集的TSNE嵌入图。每个点代表一个图像序列,其对应的特征向量由GAMIL聚合器提取。第一列的图展示了32个细胞系的全局分布,而第2至第4列的图则展示了三个示例细胞系,按生物批次ID进行颜色标注。
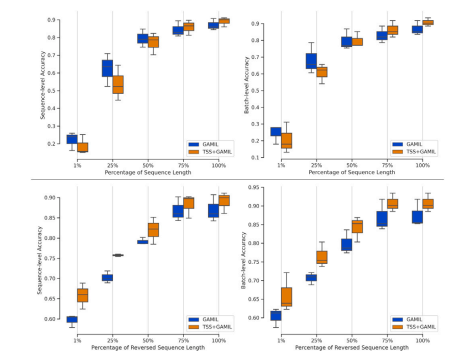
Fig. 8. Classification performance against the percentage of sequence length utilizedin the test set. The first row represents the sequences arranged in their natural order(i.e., from day 0 to day 12), while the second row illustrates the results for sequencesarranged in reverse order.
图8. 测试集中使用的序列长度百分比与分类性能的关系。第一行表示按自然顺序排列的序列(即从第0天到第12天),第二行展示了按反向顺序排列的序列结果。
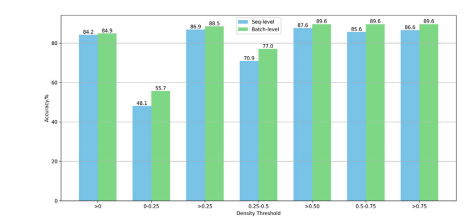
Fig. 9. Performance Evaluation Based on Various Density Thresholds for Patch Selection. For example, ‘‘>0’’ indicates the inclusion of all patches with a cell density greaterthan 0% for model training and testing. ‘‘0-0.25’’ denotes that only patches with a celldensity ranging from 0% to 25% are utilized in the training and testing phases.
图9. 基于不同密度阈值的图像块选择性能评估。例如,“>0”表示包含所有细胞密度大于0%的图像块进行模型训练和测试。“0-0.25”表示仅使用细胞密度在0%至25%范围内的图像块进行训练和测试。
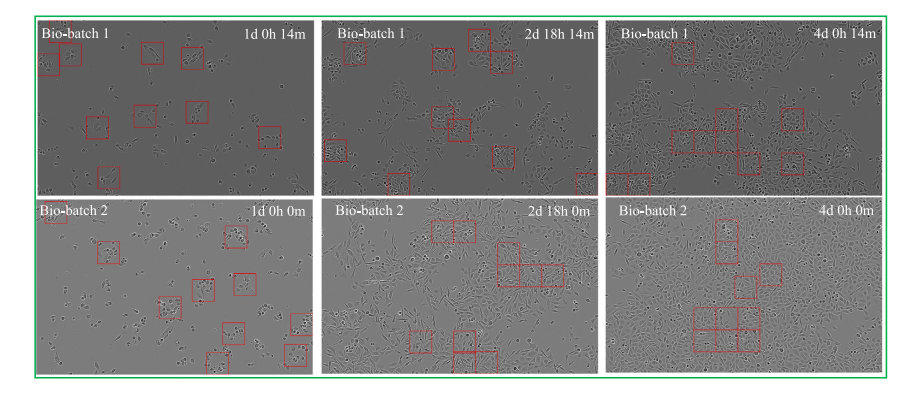
Fig. 10. Visualization of the successful cases from the PC3 cell line. Red bounding boxes highlight the corresponding cell patches selected via the Cell Cluster-Level Selection(CCS) method.
图10. 来自PC3细胞系的成功案例可视化。红色边界框突出显示了通过细胞簇级别选择(CCS)方法选取的相应细胞图像块。
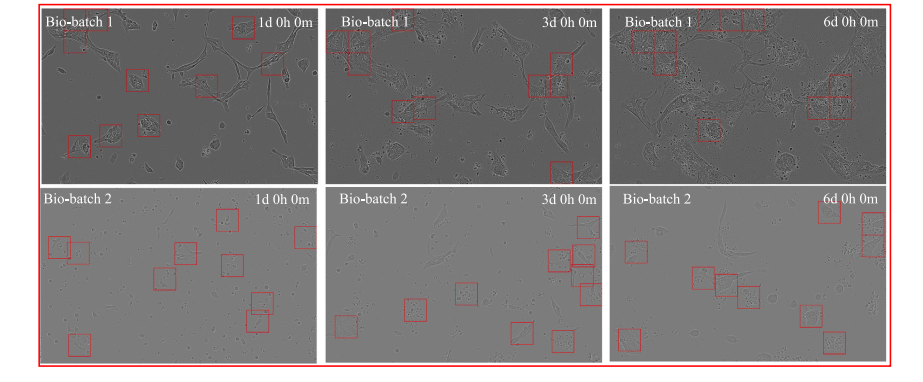
Fig. 11. Visualization of the failure cases from the HCC70 cell line. Red bounding boxes highlight the corresponding cell patches selected via the Cell Cluster-Level Selection (CCS)method.
图11. 来自HCC70细胞系的失败案例可视化。红色边界框突出显示了通过细胞簇级别选择(CCS)方法选取的相应细胞图像块。
Table
表
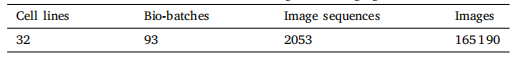
Table 1Statistics of the AstraZeneca Global Cell Bank-Brightfield Imaging Dataset (AZGCB-BFID)
表1 阿斯利康全球细胞库-明场成像数据集(AZGCB-BFID)的统计数据
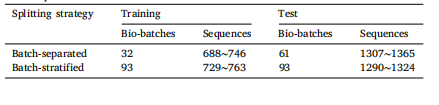
Table 2Statistics of the data splitting on the AZGCB-BFID dataset. The number of sequencesmay vary slightly during the random data split, as the sequence count in each bio-batchis not equal.
表2 AZGCB-BFID数据集的数据划分统计。由于每个生物批次的序列数量不相等,在随机数据划分过程中,序列数量可能会略有不同。
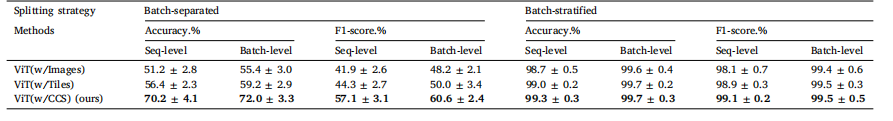
Table 3Performance comparison of various input types in the standard supervised training of Vision Transformer (ViT) for cell line classification on the AZGCB-BFID dataset. Results arepresented as [mean value ± standard deviation]. Each model was trained three times on both batch-separated and batch-stratified splits.
表3 各种输入类型在阿斯利康全球细胞库-明场成像数据集(AZGCB-BFID)上使用视觉变换器(ViT)进行细胞系分类的标准监督训练中的性能比较。结果以 [平均值 ± 标准差] 形式呈现。每个模型在批次分离和批次分层的划分方式下均进行了三次训练。
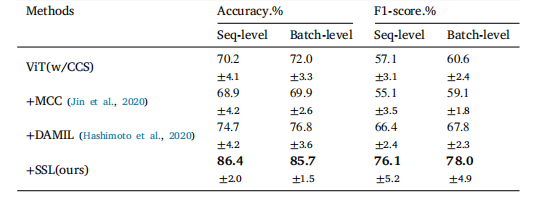
Table 4Performance comparison of various training methods including domain adaptation onthe batch-separated task using Vision Transformer (ViT) with Cell Cluster-level Selection(CCS). The notation ‘+’ indicates the integration of components.
表4 各种训练方法在批次分离任务中的性能比较,包括使用视觉变换器(ViT)与细胞簇级别选择(CCS)相结合的领域适应方法。符号‘+’表示组件的集成。
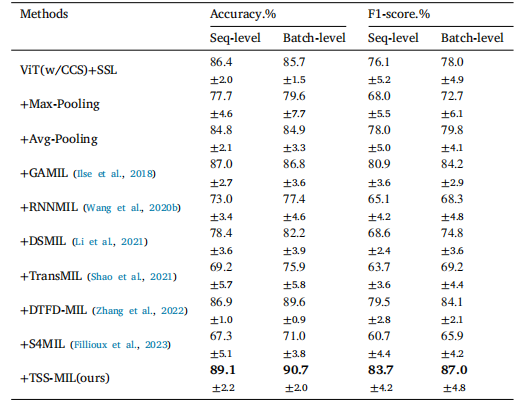
Table 5Performance comparison of Multiple Instance Learning (MIL) aggregators on batchseparated tasks utilizing Cell Cluster-level Selection (CCS) embeddings derivedfrom Self-Supervised Learning (SSL). The notation ‘+’ indicates the integration ofcomponents.
表5 多实例学习(MIL)聚合器在批次分离任务中的性能比较,使用通过自监督学习(SSL)获得的细胞簇级别选择(CCS)嵌入。符号‘+’表示组件的集成。
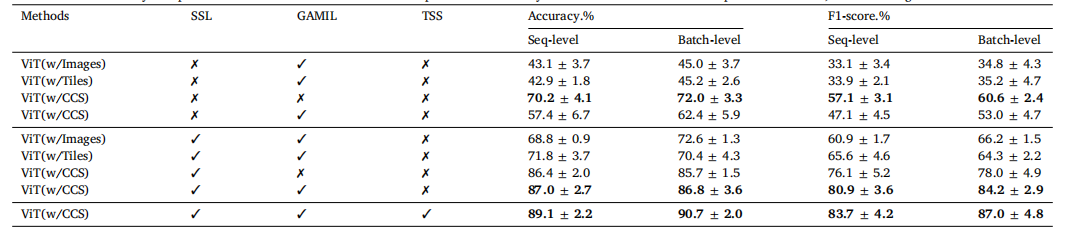
Table 6Ablation studies on key components of the framework for the batch-separated task. The symbol ‘‘✓’’ indicates that a component is utilized, while ‘‘✗’’ signifies its exclusion.
表6 针对批次分离任务的框架关键组件消融研究。符号“✓”表示使用该组件,符号“✗”表示未使用该组件。
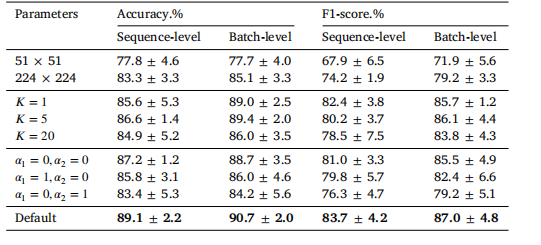
Table 7Results of varying parameters on the batch-separated task. Default parameter settingsare as follows: patch size (112 × 112), patch number 𝐾 = 10, reweighting coefficients(𝛼1 = 1, 𝛼2 = 1). In each experiment, only one parameter is modified while the othersremain consistent. It is important to note that when 𝛼1 = 0, the non-sampled embeddingsequence will be unweighted to avoid assigning it a zero weight.
表7 不同参数设置在批次分离任务中的结果。默认参数设置如下:图像块大小为 (112 × 112),图像块数量 𝐾 = 10,重加权系数 (𝛼1 = 1, 𝛼2 = 1)。在每次实验中,仅修改一个参数,其他参数保持不变。需要注意的是,当 𝛼1 = 0 时,未采样的嵌入序列将不会被赋予权重为零,以避免其权重为零。
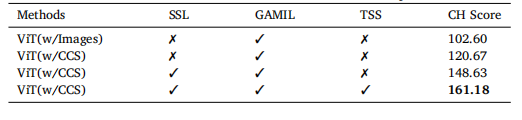
Table 8Calinski–Harabasz (CH) score of extracted features for the batch-separated task.
表8 批次分离任务中提取特征的Calinski–Harabasz(CH)分数。