目录
效果图如下,代码见下方
代码可以直接复制,图片和css也要复制
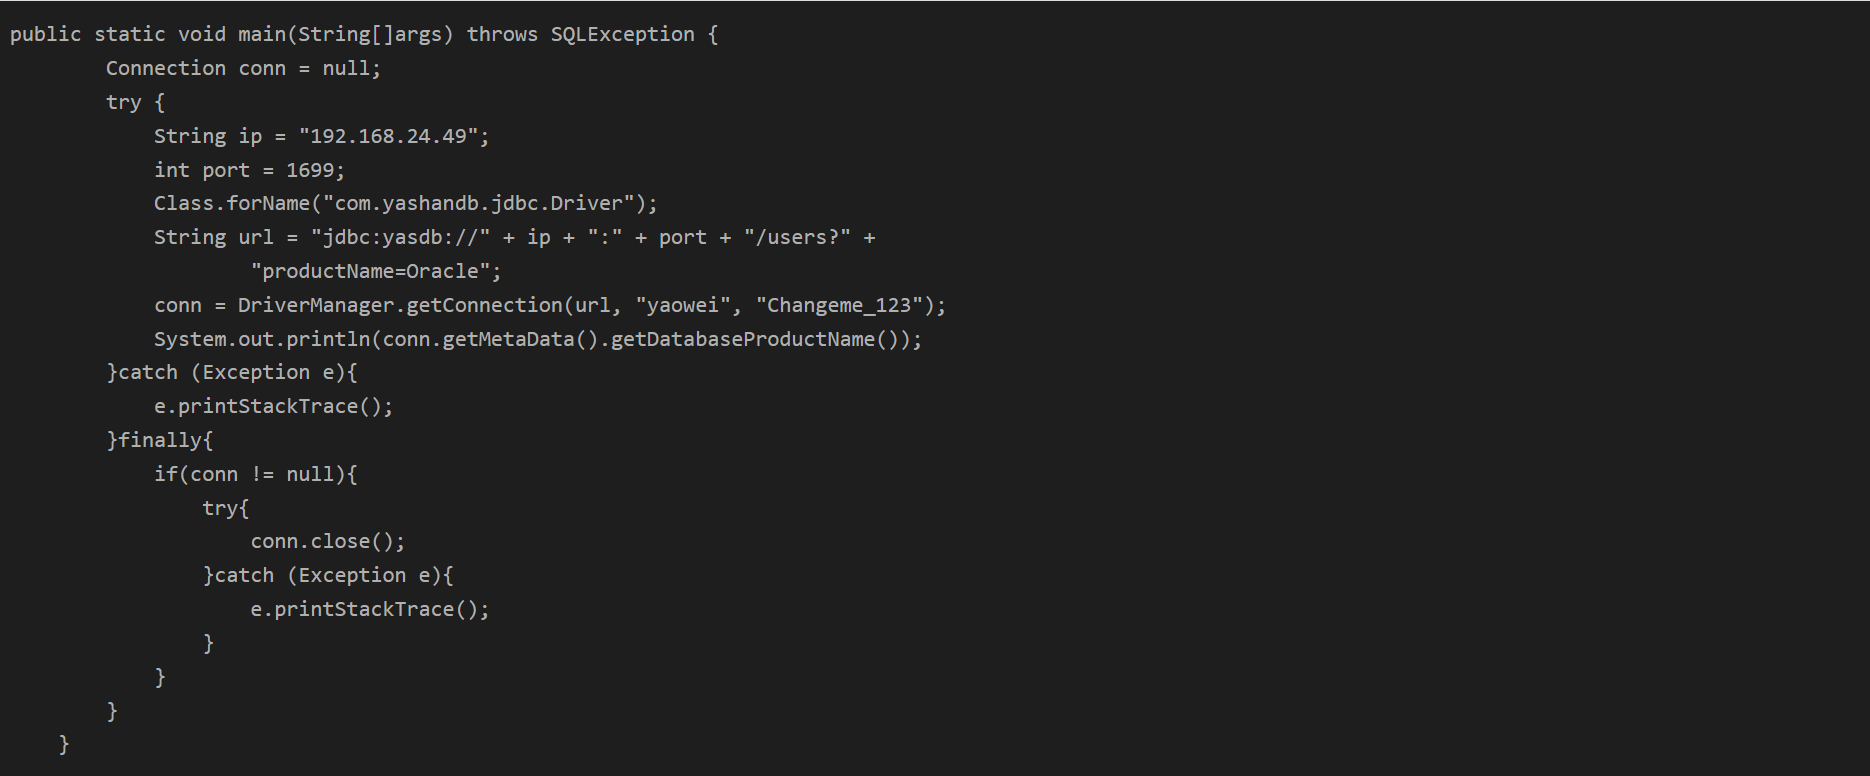
tsx代码
css代码
代码里用到的图片,可以换成自己项目的图
效果图如下,代码见下方


代码可以直接复制,图片和css也要复制
tsx代码
import React, { useEffect, useRef, useState } from "react";
import styles from "./index.module.less";
import listItemImg from "@/assets/images/biz/list-item-bg.png";
import barTopImg from "@/assets/images/biz/bar-top.png";
import * as echarts from "echarts";

const dataZoomDefaultShowNum = 5; // 默认显示的数据条数

const DataContent: React.FC<any> = (props) => {
  const chartDom: any = useRef(null);
  const chartResizeTimer: any = useRef(null);
  const chart: any = useRef(null);
  const scrollTimer: any = useRef(null);
  const [echartsOptions, setEchartsOptions] = useState<any>();

  const [data] = useState<any[]>([
    {
      name: "扬州市",
      num: "100",
      target: "500",
    },
    {
      name: "常州市",
      num: "200",
      target: "300",
    },
    {
      name: "南京市",
      num: "150",
      target: "300",
    },
    {
      name: "苏州市",
      num: "80",
      target: "100",
    },
    {
      name: "无锡市",
      num: "90",
      target: "150",
    },
    {
      name: "盐城",
      num: "110",
      target: "150",
    },
    {
      name: "淮安",
      num: "120",
      target: "150",
    },
    {
      name: "宿迁",
      num: "130",
      target: "150",
    },
  ]);

  useEffect(() => {
    if (!chartDom || !data || !data.length) {
      return;
    }
    if (!chart.current) {
      chart.current = echarts.init(chartDom.current as HTMLElement);
    }
    const fun = () => {
      // 绘制图表
      const barWidth = Math.floor(
        (8 * document.documentElement.clientWidth) / 1920
      );
      const symbolHeight = Math.floor(
        (14 * document.documentElement.clientWidth) / 1920
      );
      const axisFontSize = Math.floor(
        (16 * document.documentElement.clientWidth) / 1920
      );
      const axisY2FontSize = Math.floor(
        (20 * document.documentElement.clientWidth) / 1920
      );
      const axisY2UnitFontSize = Math.floor(
        (12 * document.documentElement.clientWidth) / 1920
      );
      const axisYImageSize = Math.floor(
        (16 * document.documentElement.clientWidth) / 1920
      );

      let yData: any[] = [];
      let sData: any[] = [];
      let dataDict: any = {};
      data.forEach((item) => {
        let currentPercent =
          Number(((Number(item.num) / Number(item.target)) * 100).toFixed(0)) >
          100
            ? 100
            : Number(
                ((Number(item.num) / Number(item.target)) * 100).toFixed(0)
              );
        dataDict[item.name] = { ...item, progress: currentPercent };
        yData.push(item.name);
        sData.push(currentPercent);
      });
      const echartsOption = {
        grid: {
          top: 0,
          left: 0,
          right: 0,
          bottom: 0,
          containLabel: true,
        },
        xAxis: {
          axisLabel: {
            show: false,
          },
          splitLine: {
            show: false,
          },
          max: 100,
        },
        yAxis: [
          {
            type: "category",
            axisLabel: {
              textStyle: {
                rich: {
                  image: {
                    backgroundColor: {
                      image: listItemImg,
                      width: axisYImageSize,
                      height: axisYImageSize,
                    },
                  },
                  name: {
                    color: "#C9EEFF",
                    fontSize: axisFontSize,
                  },
                },
              },
              formatter: function (v: any) {
                return `{image|}{name|${v}}`;
              },
            },
            axisLine: {
              show: false,
            },
            axisTick: {
              show: false,
            },
            data: yData,
          },
          {
            axisTick: "none",
            axisLine: "none",
            show: true,
            axisLabel: {
              inside: false,
              textStyle: {
                rich: {
                  value: {
                    color: "#C9EEFF",
                    fontSize: axisY2FontSize,
                    fontFamily: "DinBold",
                  },
                  unit: {
                    color: "#7883A7",
                    fontSize: axisY2UnitFontSize,
                  },
                },
              },
              formatter: function (v: any) {
                return `{value|${v}}{unit|%}`;
              },
            },
            data: sData,
          },
        ],
        series: [
          {
            type: "bar",
            barWidth,
            showBackground: true,
            itemStyle: {
              color: new echarts.graphic.LinearGradient(0, 0, 1, 1, [
                { offset: 0, color: "#2D3A5C" },
                { offset: 0.78, color: "#2C86F0" },
                { offset: 1, color: "#DDECFD" },
              ]),
            },
            data: sData,
          },
          {
            name: "XXX",
            type: "pictorialBar",
            symbol: barTopImg,
            symbolSize: [2, symbolHeight],
            symbolOffset: [1, 0],
            itemStyle: {
              normal: {
                color: "#B8DAFF",
              },
            },
            symbolPosition: "end",
            data: sData,
          },
        ],
        dataZoom: [
          {
            yAxisIndex: 0,
            show: false,
            startValue: data.length - 1 - dataZoomDefaultShowNum,
            endValue: data.length - 2,
          },
          {
            yAxisIndex: 1,
            show: false,
            startValue: data.length - 1 - dataZoomDefaultShowNum,
            endValue: data.length - 2,
          },
        ],
      };
      chart && chart.current && chart.current.setOption(echartsOption);
      chart && chart.current && chart.current.resize();
      setEchartsOptions(echartsOption);
    };
    fun();

    window.addEventListener("resize", () => {
      if (chartResizeTimer && chartResizeTimer.current) {
        clearTimeout(chartResizeTimer.current);
        chartResizeTimer.current = null;
      }
      chartResizeTimer.current = setTimeout(() => {
        fun();
        clearTimeout(chartResizeTimer.current);
        chartResizeTimer.current = null;
      }, 100);
    });

    return () => {
      chart && chart.current && chart.current.clear();
      chart && chart.current && (chart.current = null);
    };
  }, [data]);

  // y轴自动滚动
  useEffect(() => {
    if (
      !echartsOptions ||
      !data ||
      !data.length ||
      data.length < dataZoomDefaultShowNum
    ) {
      return;
    }
    const setScrollTimer = () => {
      scrollTimer.current = setInterval(() => {
        if (echartsOptions.dataZoom[0].startValue < 1) {
          echartsOptions.dataZoom[0].startValue =
            data.length - 1 - dataZoomDefaultShowNum;
          echartsOptions.dataZoom[0].endValue = data.length - 2;
          echartsOptions.dataZoom[1].startValue =
            data.length - 1 - dataZoomDefaultShowNum;
          echartsOptions.dataZoom[1].endValue = data.length - 2;
        } else {
          echartsOptions.dataZoom[0].startValue =
            echartsOptions.dataZoom[0].startValue - 1;
          echartsOptions.dataZoom[0].endValue =
            echartsOptions.dataZoom[0].endValue - 1;
          echartsOptions.dataZoom[1].startValue =
            echartsOptions.dataZoom[1].startValue - 1;
          echartsOptions.dataZoom[1].endValue =
            echartsOptions.dataZoom[1].endValue - 1;
        }
        chart && chart.current && chart.current.setOption(echartsOptions, true);
      }, 1500);
    };
    const clearScrollTimer = () => {
      if (scrollTimer && scrollTimer.current) {
        clearInterval(scrollTimer.current);
        scrollTimer.current = null;
      }
    };
    setScrollTimer();
    const mouseOverFun = () => {
      clearScrollTimer();
    };
    const mouseOutFun = () => {
      setScrollTimer();
    };
    if (chartDom && chartDom.current) {
      chartDom.current.addEventListener("mouseover", mouseOverFun);
      chartDom.current.addEventListener("mouseout", mouseOutFun);
    }
    return () => {
      if (scrollTimer && scrollTimer.current) {
        clearInterval(scrollTimer.current);
        scrollTimer.current = null;
      }
      if (chartDom && chartDom.current) {
        chartDom.current.removeEventListener("mouseover", mouseOverFun);
        chartDom.current.removeEventListener("mouseout", mouseOutFun);
      }
    };
  }, [data, echartsOptions]);

  return (
    <div className={styles.content}>
      <div ref={chartDom} className={styles.chart} />
    </div>
  );
};

export default DataContent;
css代码
.content {
  width: 430px;
  height: 240px;

  .chart {
    height: 100%;
    width: 100%;
  }
}
代码里用到的图片,可以换成自己项目的图
listItemImg

barTopImg
![]()