曾老师发来了一个工具,BisqueRNA,这个工具也可以用于单细胞/bulk数据的反卷积~
因此本次就对这两个工具简单测评一下 ~
生信菜鸟团:https://mp.weixin.qq.com/s/3dZQxDdY6M1WwMMcus5Gkg
笔者也曾经写过一个推文简单的介绍过,有兴趣的朋友可以点进去瞧一瞧:
BayesPrism(贝叶斯棱镜法)可提取单细胞数据去卷积后将信息映射至bulkRNA数据对其进行细胞分群: https://mp.weixin.qq.com/s/Rj8PL6wJqwWhsmLG8tx89w
接下来介绍一下BisqueRNA,它的底层架构主要基于线性回归模型。

主要用两种使用方式
Reference-Based Deconvolution,如果使用者有单细胞和bulk配对的数据可以采用这种方式进行。
Marker-Based Deconvolution,也可以通过指定特定的细胞标记基因进行曲卷积。
研究者更加建议使用第一种,但第一种的方法有点苛刻,需要使用者有同一样本的两种不同测序数据。
BisqueRNA的主要特点:
-
单细胞 RNA-seq 数据作为参考,通过线性回归模型将bulk RNA-seq 数据去卷积为各个细胞类型的贡献。这种方法利用单细胞数据中各细胞类型的表达模式来推断混合样本中的细胞组成比例。
-
快速、直接使用单细胞数据作为参考,对各细胞类型的表达特征没有特别的假设;适用于基因表达数据较为均匀且细胞类型特征明显的情况。
BayesPrism的主要特点:
-
基于贝叶斯推断框架,将去卷积问题建模为一个概率问题,通过迭代的方法估计细胞类型的比例和表达特征。BayesPrism 在去卷积过程中,不仅估计细胞比例,还重新推断了各细胞类型的基因表达特征,同时考虑到不同细胞类型间的共享基因表达模式。
-
能够处理噪声数据和表达特征不确定性的情况,尤其擅长在异质性高且表达模式复杂的样本中准确去卷积。BayesPrism 强调对背景噪声的控制和对混合数据的全面描述。
Bisque分析步骤流程
1、导入
rm(list = ls())
library(Biobase)
library(BisqueRNA)
library(qs)
library(BiocParallel)
register(MulticoreParam(workers = 4, progressbar = TRUE))

#导入单细胞数据
scRNA = qread('sc_dataset.qs')
#导入bulkRNA数据
load("Data.Rdata")
2、数据预处理
Bulk RNA-seq 数据从表达矩阵(列是样本,行是基因)转换为 ExpressionSe 这里就跟贝叶斯反卷积的数据格式不一样了~
bulk.matrix <- 2^exprSet-1 # 逆转回TPM数据
bulk.eset <- Biobase::ExpressionSet(assayData = bulk.matrix)
单细胞数据需要在ExpressionSet中添加额外的信息,特别是细胞类型标签和个体标签。个体标签用于指示每个细胞来自哪个个体。为了添加这些信息,Biobase要求将其存储为数据框格式。假设我们有细胞类型标签(cell.type.labels)和个体标签(individual.labels)的字符向量
# 提取200个细胞
sub_scRNA <- subset(scRNA,downsample=200)
sc.counts.matrix <-  as.matrix(sub_scRNA@assays$RNA@counts)

sample.ids <- colnames(sc.counts.matrix) # 提取单细胞的counts
individual.labels <-sub_scRNA@meta.data$orig.ident # 提取个体信息赋值到individual
cell.type.labels <- sub_scRNA@meta.data$celltype # 提取细胞类型赋值到cell.type

# individual.ids和cell.types s的顺序要跟sample.ids的一样!!
sc.pheno <- data.frame(check.names=F, check.rows=F,
                       stringsAsFactors=F,
                       row.names=sample.ids,
                       SubjectName=individual.labels,
                       cellType=cell.type.labels)
sc.meta <- data.frame(labelDescription=c("SubjectName", # individual.labels
                                         "cellType"), # cell.type.labels
                      row.names=c("SubjectName",
                                  "cellType"))
sc.pdata <- new("AnnotatedDataFrame",
                data=sc.pheno,
                varMetadata=sc.meta)
sc.eset <- Biobase::ExpressionSet(assayData=sc.counts.matrix,
                                  phenoData=sc.pdata)
3、运行BisqueRNA
默认情况下,BisqueRNA使用所有基因进行分解。但是也可以提供一个基因列表进行分解
假设单细胞数据和bulk数据有来自同一样本的use.overlap设置为True
system.time({
res <- BisqueRNA::ReferenceBasedDecomposition(bulk.eset, sc.eset,
                                              markers=NULL, use.overlap=F)
})

 #   user  system elapsed
 # 42.291  96.513  11.910
超级快速!!!
4、保存结果
ref.based.estimates <- res$bulk.props
write.csv(ref.based.estimates,"ref.based.estimates.csv")
BayesPrism分析步骤流程
1、导入
rm(list = ls())
library(BayesPrism)
library(qs)
library(BiocParallel)
register(MulticoreParam(workers = 4, progressbar = TRUE))
#导入单细胞数据
sub_scRNA = qread('sub_scRNA.qs')  # 这里就跟上面Bisque法是相同数据了
#导入bulkRNA数据
load("Data.Rdata")
2、TCGA数据预处理
#请注意我们要做BayesPrism分析
#请确保使用一致的基因注释(TCGA RNA-seq 使用 GENCODE v22)。
#建议使用未规范化和未转换( unnormalized and untransformed)的count data。当原始计数不可用时,线性归一化(例如 TPM、RPM、RPKM、FPKM)也是可以接受的,因为 BayesPrism 对reference和mixture之间的线性乘法差异具有鲁棒性(换个单词 即Robust)。理想情况下,如果使用规范化数据,最好提供参考数据和通过相同方法转换的批量数据。应避免log转换。

exp <- 2^exprSet - 1 # 逆转回TPM
exp_pre <- t(exp)
3、scRNA数据预处理
sc_dataset <- sub_scRNA
sc_dat <- as.data.frame(sc_dataset@assays$RNA@counts)
sc_dat_pre <- t(sc_dat)
table(sc_dataset$celltype)

# 对细胞类型进行质量控制
plot.cor.phi (input=sc_dat_pre,
              input.labels=sc_dataset$celltype,
              title="cell type correlation",
              #specify pdf.prefix if need to output to pdf
              #pdf.prefix="gbm.cor.ct",
              cexRow=0.5, cexCol=0.5,
)
4、过滤离群基因-单细胞和bulk
#查看单细胞数据的离群基因
#sc.stat 显示每个基因的归一化平均表达(x 轴)和最大特异性(y 轴)的对数,以及每个基因是否属于一个潜在的异常值类别。Other _ Rb 是由核糖体假基因组成的一组精选基因。
sc.stat <- plot.scRNA.outlier(
  input=sc_dat_pre, #make sure the colnames are gene symbol or ENSMEBL ID
  cell.type.labels=sc_dataset$celltype,
  species="hs", #currently only human(hs) and mouse(mm) annotations are supported
  return.raw=TRUE #return the data used for plotting.
  #pdf.prefix="gbm.sc.stat" specify pdf.prefix if need to output to pdf
)
head(sc.stat)

#查看bulk细胞数据的离群基因
bk.stat <- plot.bulk.outlier(
  bulk.input=exp_pre,#make sure the colnames are gene symbol or ENSMEBL ID
  sc.input=sc_dat_pre, #make sure the colnames are gene symbol or ENSMEBL ID
  cell.type.labels=sc_dataset$celltype,
  species="hs", #currently only human(hs) and mouse(mm) annotations are supported
  return.raw=TRUE
  #pdf.prefix="gbm.bk.stat" specify pdf.prefix if need to output to pdf
)
head(bk.stat)

#过滤基因
sc.dat.filtered <- cleanup.genes (input=sc_dat_pre,
                                   input.type="count.matrix",
                                   species="hs",
                                   gene.group=c( "Rb","Mrp","other_Rb",
                                                 "chrM","MALAT1","chrX","chrY") ,
                                   exp.cells=5)
plot.bulk.vs.sc (sc.input = sc.dat.filtered,
                 bulk.input = exp_pre
                 #pdf.prefix="gbm.bk.vs.sc" specify pdf.prefix if need to output to pdf
)
5、根据 “蛋白编码基因”确定子集
sc.dat.filtered.pc <-  select.gene.type(sc.dat.filtered,
                                        gene.type = "protein_coding")
#根据‘signature gene’确定子集
#或者,在细胞类型被定义为其中一些显示非常相似的转录或存在严重的批次效应的情况下,例如,reference 和mixture 来自不同的测定手段,选择signature gene是可行的。这是因为特征基因的选择可以丰富用于反卷积的基因信息,同时减少技术批量效应造成的噪声影响。
6、构建BayesPrism模型
myPrism <- new.prism(
   reference=sc.dat.filtered.pc,
   mixture=exp_pre,
   input.type="count.matrix",
   cell.type.labels = sc_dataset$celltype,
   cell.state.labels =NULL, # 不同的细胞状态不能分配到同一细胞类型中
   key= Malignant cells,   #"Malignant cells",#key是 cell.type.label 中对应于恶性细胞类型的字符向量。如无恶性细胞,即设置为 NULL,此时,所有类型的细胞将被 treated equally。
   outlier.cut=0.01,
   outlier.fraction=0.1,
 )
7、运行BayesPrism
#后续即运行BayesPrism控制 Gibbs 采样和优化的参数可以使用 Gibbs.control 和 opt.control 指定。?run.prism获取details。这里建议使用默认参数
system.time({
bp.res <- run.prism(prism = myPrism, n.cores=20)
})
  #   user   system  elapsed
  # 75.387  248.935 3588.547

#qsave(sc_dataset,"sc_dataset.qs")
qsave(bp.res,file = "bp.res.qs")
额,运行了差不多1小时...
8、提取细胞型分数 θ 的后验平均值/变异分数(CV)/Z分数
bp.res <- qread("bp.res.qs")
# 提取细胞型分数 θ 的后验平均值
theta <- get.fraction (bp=bp.res,
            which.theta="final",
            state.or.type="type")

head(theta)
write.csv(theta,"theta.csv")
统计分析环节
1、简单的做个相关性分析
rm(list = ls())
Bisque_res <- read.csv("ref.based.estimates.csv",header = T,row.names = 1)
BayesPrism_res <- read.csv("theta.csv",header = T,row.names = 1)
identical(rownames(Bisque_res),rownames(BayesPrism_res))
colnames(Bisque_res) <- paste0(colnames(Bisque_res), "_Bisque")
colnames(BayesPrism_res) <- paste0(colnames(BayesPrism_res), "_Bayes")
colnames(Bisque_res)
colnames(BayesPrism_res)
dat <- cbind(Bisque_res,BayesPrism_res)

# 绘图相关性分析
# 加载所需的包
library(ggstatsplot)
library(patchwork) # 用于合并图像
# 创建空列表用于存储图像
plot_list <- list()
# 获取细胞类型的名称,确保它们的名称能够被列索引
cells_Bisque <- grep("_Bisque$", colnames(dat), value = TRUE)
cells_Bayes <- gsub("_Bisque$", "_Bayes", cells_Bisque)
# 循环生成每个细胞类型的散点图
for (i in seq_along(cells_Bisque)) {
  bisque_col <- cells_Bisque[i]
  bayes_col <- cells_Bayes[i]

  # 确保列名在数据集中存在
  if (bisque_col %in% colnames(dat) && bayes_col %in% colnames(dat)) {
    # 从数据集中提取x和y的列
    x_data <- dat[[bisque_col]]
    y_data <- dat[[bayes_col]]

    # 生成散点图并添加到列表中
    p <- ggscatterstats(
      data = data.frame(x = x_data, y = y_data),  # 创建新数据框
      x = x,
      y = y,
      xlab = bisque_col,
      ylab = bayes_col,
      bf.message = FALSE
    )
    # 将生成的图加入列表
    plot_list[[i]] <- p
  }
}

# 使用 patchwork 将所有图合并成一张图
combined_plot <- wrap_plots(plot_list, ncol = 3) # ncol 设置每行显示的图数

# 显示合并后的图
print(combined_plot)

# 保存合并后的图像
library(ggplot2)
ggsave(
  filename = "combined_plot.png", # 文件名,可以更改为你需要的名字和格式
  plot = combined_plot,           # 传入需要保存的图
  width = 12,                     # 图的宽度,根据需要调整
  height = 12,                     # 图的高度,根据需要调整
  units = "in",                   # 尺寸单位,可以是 "in"、"cm" 或 "mm"
  dpi = 300                       # 分辨率,适合打印的质量
)
两种不同工具得到的结果差异真的非常大!!相关性相对较好的是成纤维细胞和癌症细胞。

因此笔者在思考是不是因为模型设置的问题。
接下来在构建BayesPrism模型的时候把key设置为NULL。让函数对每一个细胞类型平等对待。
2、重新构建BayesPrism模型
myPrism <- new.prism(
   reference=sc.dat.filtered.pc,
   mixture=exp_pre,
   input.type="count.matrix",
   cell.type.labels = sc_dataset$celltype,
   cell.state.labels =NULL, # 不同的细胞状态不能分配到同一细胞类型中
   key= NULL,   #"Malignant cells",#key是 cell.type.label 中对应于恶性细胞类型的字符向量。如无恶性细胞,即设置为 NULL,此时,所有类型的细胞将被 treated equally。
   outlier.cut=0.01,
   outlier.fraction=0.1,
 )
相关性还是不咋地,结果倒是跟第一次的十分相似! 因此这就跟key值设定没有很大关系啦,应该是跟两种算法的底层逻辑有关。

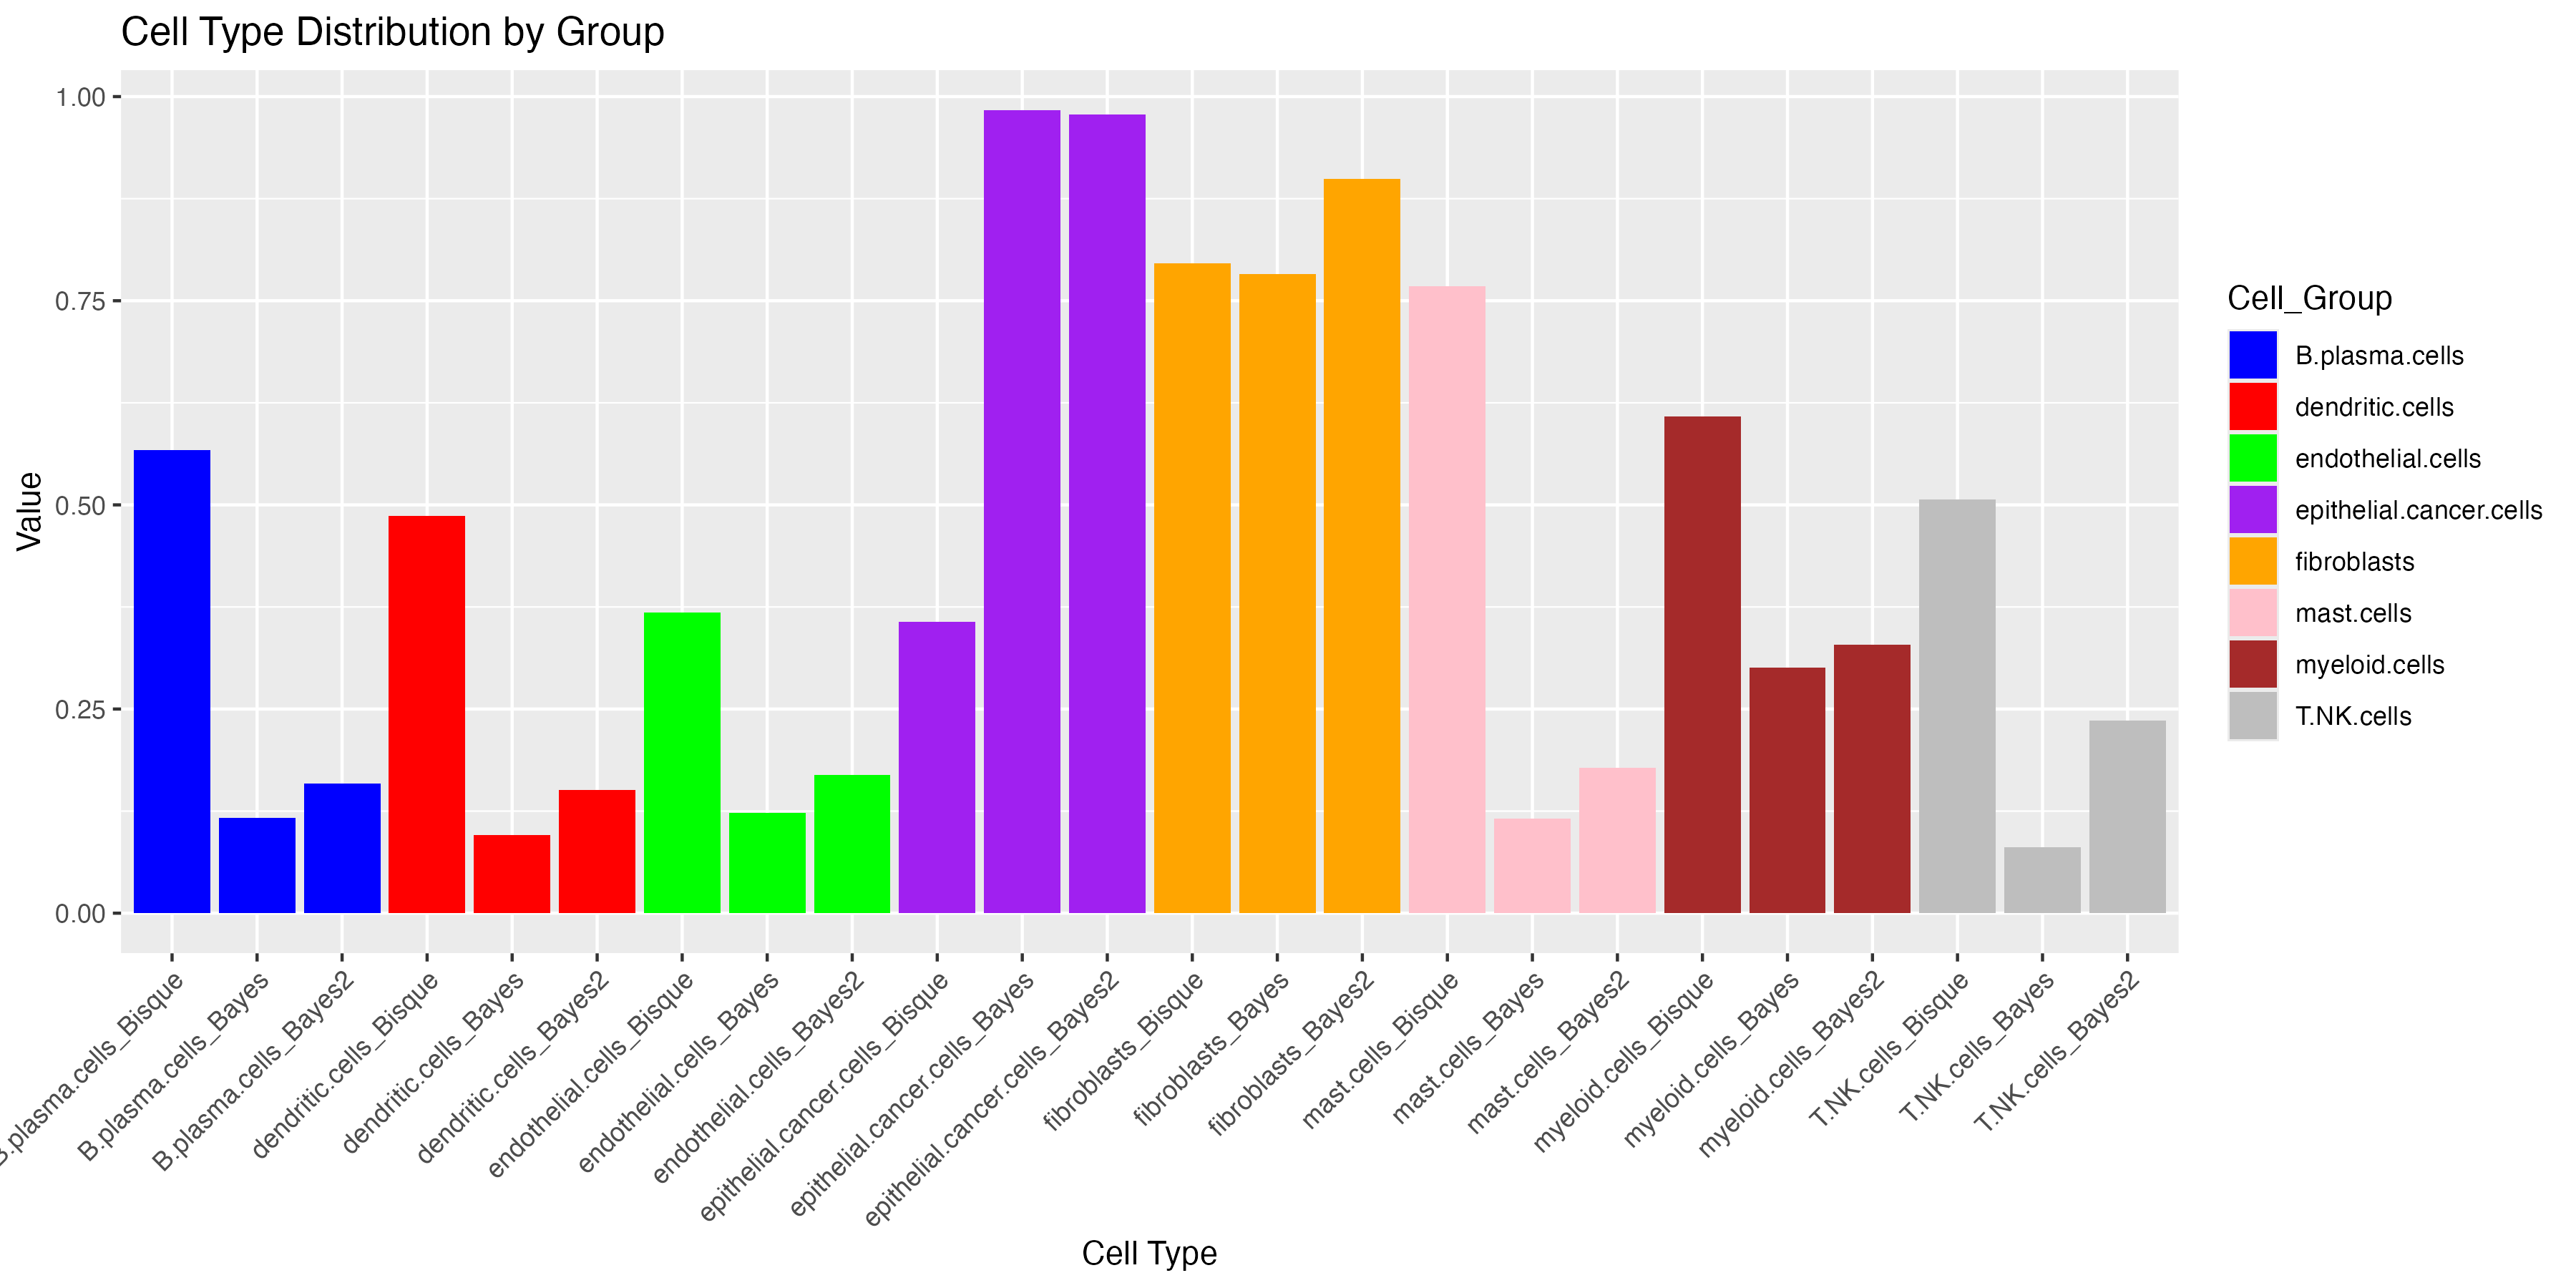
3、再画一个简单的柱状图
library(ggplot2)
library(reshape2)

# 将数据转换为长格式
dat_long <- melt(dat, variable.name = "Cell_Type", value.name = "Value")

# 提取细胞类型(去掉后面的_Bisque, _Bayes, _Bayes2)
dat_long$Cell_Group <- gsub("_Bisque$|_Bayes$|_Bayes2$", "", dat_long$Cell_Type)

# 按细胞类型排序
dat_long <- dat_long[order(dat_long$Cell_Group, dat_long$Cell_Type), ]

# 绘制柱状图,按细胞类型分组着色
ggplot(dat_long, aes(x = factor(Cell_Type, levels = unique(dat_long$Cell_Type)), y = Value, fill = Cell_Group)) +
  geom_bar(stat = "identity", position = "dodge") +
  labs(x = "Cell Type", y = "Value", title = "Cell Type Distribution by Group") +
  theme(axis.text.x = element_text(angle = 45, hjust = 1)) + # 旋转x轴标签
  scale_fill_manual(values = c("blue", "red", "green", "purple", "orange", "pink", "brown","grey")) # 根据需要调整颜色
直接在pubmed中搜索关键词 BisqueRNA 或者 BayesPrism,目前后者的文章略多一些。
至于该用哪个工具,大家就仁者见仁智者见智吧~
参考资料:
1、BisqueRNA: https://github.com/cran/BisqueRNA
2、BayesPrism:https://bayesprism.org/pages/tutorial_deconvolution
致谢:感谢曾老师以及生信技能树团队全体成员。
注:若对内容有疑惑或者有发现明确错误的朋友,请联系后台(欢迎交流)。
- END -


