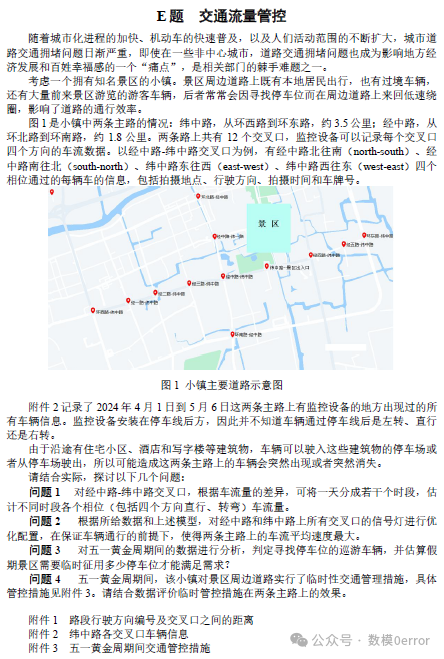
【题目分析】
问题1:舞龙队沿螺距为55 cm的等距螺线顺时针盘入,给出300秒内舞龙队每秒的位置和速度
分析思路:
· 螺线方程: 需要建立螺线方程,以便描述龙头及每节板凳的位置。螺线是基于极坐标系的,可以通过设置龙头的速度为1 m/s,确定螺线的参数。
· 龙头运动: 龙头的速度为已知定值,需通过对时间的积分求出龙头的运动轨迹。
· 龙身和龙尾: 龙身和龙尾的板凳通过把手连接,其运动需考虑整体的曲率变化,因此可以通过数值方法模拟整个龙队每节的速度和位置。
· 数值模拟: 通过离散化时间,编程计算每秒的各节板凳的位置和速度,并导出结果文件 result1.xlsx。
· 关键点: 在0s, 60s, 120s等时间点分别记录特定板凳(如第1、51、101、151、201节板凳)的运动状态,输出表格化的数据用于报告。
【解题思路】
1. 龙头的运动路径
龙头前把手沿着等距螺线顺时针盘入,螺线的极坐标方程为:
其中:
-
 是龙头前把手在角度
  时的径向距离;
 - r0是螺线的起始半径,已知龙头初始位于第16圈;
- p=0.55m 是螺距(55 cm);
-
 是极角,单位为弧度。
龙头前把手的行进速度恒定为 1 m/s,因此我们可以通过时间t计算出龙头的角速度![]() 和径向速度Vr:
和径向速度Vr:

2. 龙头的位置信息
利用螺线的极坐标方程,可以将龙头前把手的坐标从极坐标转换为直角坐标系下的 x和y 位置:

其中r(t)和![]() 是通过时间t计算出的螺线半径和极角。
是通过时间t计算出的螺线半径和极角。
3. 龙身和龙尾的位置信息
每节龙身的前把手和后把手都需要沿螺线上行进。由于各板凳的长度不同,每节龙身的后把手相对于前把手的偏移量由板凳的长度 li。通过以下公式修正:
前把手位置:![]()
后把手位置根据板凳长度li和宽度w进行调整:

4. 数值模拟
通过离散化时间 t=1,2,3...,300,可以逐步计算每节龙身和龙尾的位置和速度。对每个时间点 t,首先计算龙头位置,再根据龙头的位置推导出龙身和龙尾的位置。
每一节板凳的速度可以通过数值微分计算:

5. 结果导出
将每秒的位置信息和速度保存到文件 result1.xlsx 中,按照以下格式:
- 位置信息

速度信息![]()
【Python参考代码】
import numpy as np
import matplotlib.pyplot as plt

# 定义常量
p = 0.55  # 螺距 (m)
v_head = 1.0  # 龙头速度 (m/s)
t_total = 300  # 总时间 (s)
r_0 = 16 * p  # 螺线起始半径,假设起始在第16圈
num_sections = 223  # 总板凳节数
length_head = 3.41  # 龙头长度 (m)
length_body = 2.20  # 龙身和龙尾长度 (m)
section_lengths = [length_head] + [length_body] * (num_sections - 1)  # 各节板凳长度

# 初始化位置和速度列表
positions = np.zeros((t_total + 1, num_sections, 2))  # x, y 坐标
velocities = np.zeros((t_total + 1, num_sections))  # 每节板凳速度

# 计算角速度
def calculate_angular_velocity(v_head, r_head):
    return v_head / r_head

# 计算每节板凳在t时刻的位置
def calculate_position(t, section_index):
    r = r_0 + p * t / (2 * np.pi)  # 半径随时间变化
    theta = t / r  # 极角随时间变化
    # 计算每节板凳的前把手位置
    if section_index == 0:
        x = r * np.cos(theta)
        y = r * np.sin(theta)
    else:
        prev_x, prev_y = positions[t, section_index - 1]
        section_length = section_lengths[section_index]
        direction = np.arctan2(prev_y, prev_x) + np.pi  # 与前一节相反方向
        x = prev_x + section_length * np.cos(direction)
        y = prev_y + section_length * np.sin(direction)
    return x, y

# 计算每节板凳在t时刻的速度
def calculate_velocity(t, section_index):
    if t == 0:
        return 0  # 初始时刻速度为0
    prev_pos = positions[t - 1, section_index]
    current_pos = positions[t, section_index]
    dist = np.sqrt((current_pos[0] - prev_pos[0])**2 + (current_pos[1] - prev_pos[1])**2)
    return dist

# 主循环:计算每秒的位置信息和速度
for t in range(t_total + 1):
    for i in range(num_sections):
        positions[t, i] = calculate_position(t, i)
        velocities[t, i] = calculate_velocity(t, i)

# 可视化螺线和板凳位置
def plot_positions():
    fig, ax = plt.subplots(figsize=(10, 10))
    ax.set_aspect('equal')
    for t in [0, 60, 120, 180, 240, 300]:
        ax.plot(positions[t, :, 0], positions[t, :, 1], label=f't={t}s')

    # 可视化龙头位置
    ax.scatter(positions[:, 0, 0], positions[:, 0, 1], color='red', s=50, label='龙头轨迹')

    ax.set_title('舞龙队沿螺线运动轨迹')
    ax.set_xlabel('x 位置 (m)')
    ax.set_ylabel('y 位置 (m)')
    ax.legend()
    plt.grid(True)
    plt.show()

# 调用绘图函数
plot_positions()

# 保存结果到 Excel 文件
import pandas as pd

# 创建DataFrame来存储结果
result = pd.DataFrame(columns=["time", "section", "x_position", "y_position", "velocity"])

for t in range(t_total + 1):
    for i in range(num_sections):
        result = result.append({
            "time": t,
            "section": i + 1,
            "x_position": positions[t, i, 0],
            "y_position": positions[t, i, 1],
            "velocity": velocities[t, i]
        }, ignore_index=True)

# 保存为 Excel 文件
result.to_excel('result1.xlsx', index=False)


