横向对比一下x86和ARM芯片,以及不同方案权衡下的性能比较
CPU基本信息
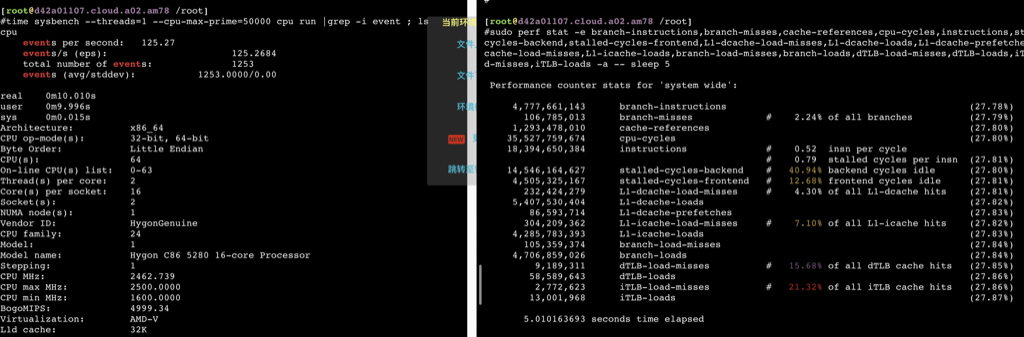
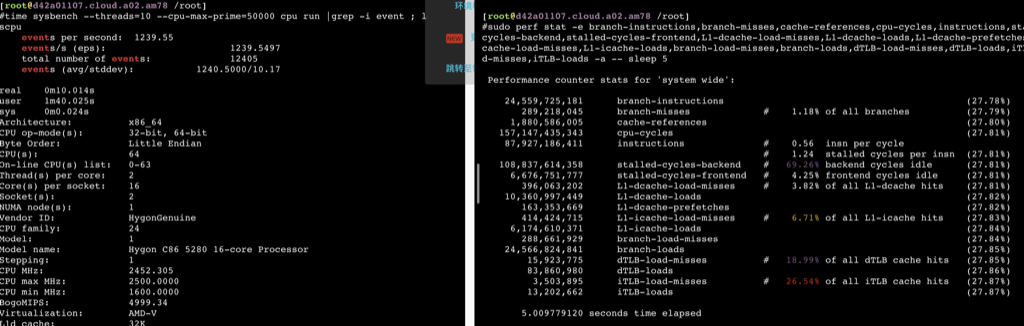
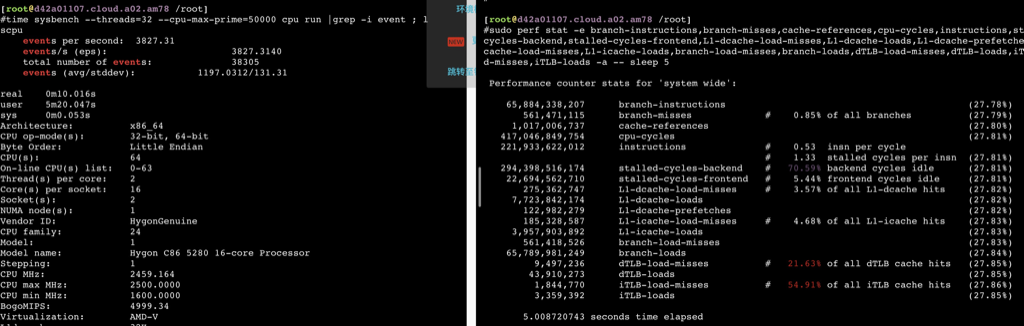
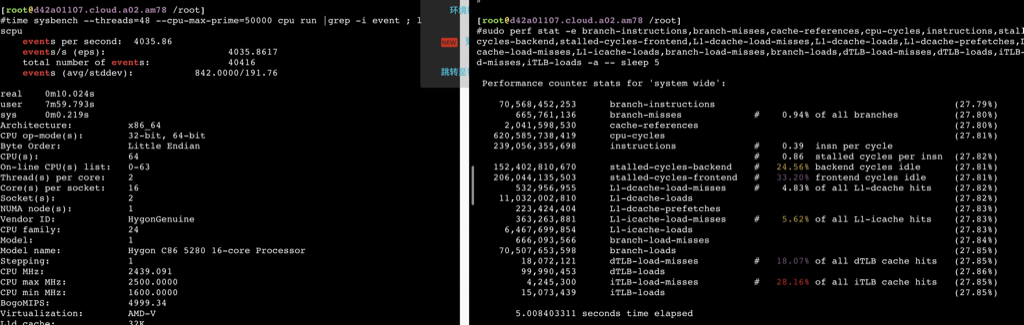
海光
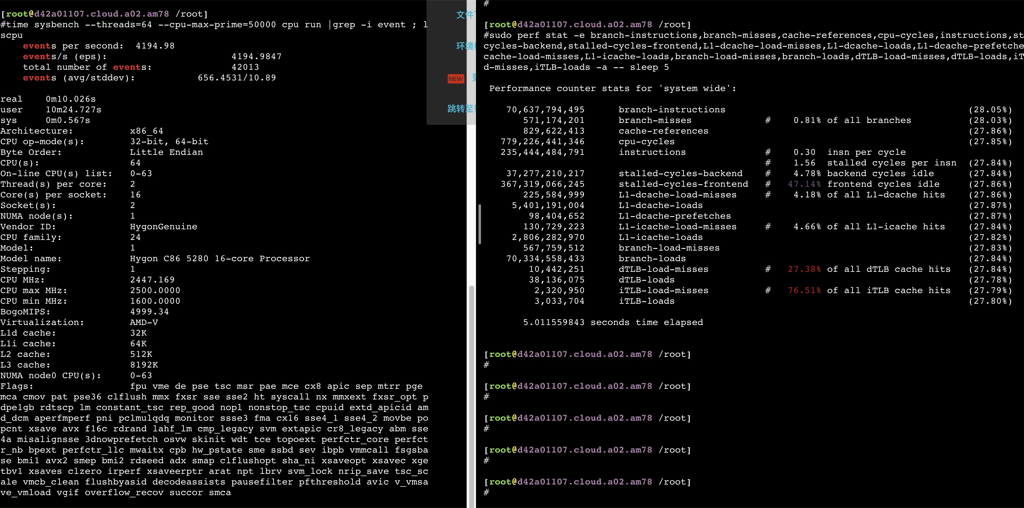
| 1 2 3 4 5 6 7 8 9 10 11 12 13 14 15 16 17 18 19 20 21 22 23 24 25 26 27 28 29 30 31 32 33 34 35 36 37 38 39 40 41 42 43 44 45 46 47 48 49 50 | #lscpu Architecture: x86_64 CPU op-mode(s): 32-bit, 64-bit Byte Order: Little Endian CPU(s): 64 On-line CPU(s) list: 0-63 Thread(s) per core: 2 //每个物理core有两个超线程 Core(s) per socket: 16 //每路16个物理core Socket(s): 2 //2路 NUMA node(s): 4 Vendor ID: HygonGenuine CPU family: 24 Model: 1 Model name: Hygon C86 5280 16-core Processor Stepping: 1 CPU MHz: 2455.552 CPU max MHz: 2500.0000 CPU min MHz: 1600.0000 BogoMIPS: 4999.26 Virtualization: AMD-V L1d cache: 32K L1i cache: 64K L2 cache: 512K L3 cache: 8192K NUMA node0 CPU(s): 0-7,32-39 NUMA node1 CPU(s): 8-15,40-47 NUMA node2 CPU(s): 16-23,48-55 NUMA node3 CPU(s): 24-31,56-63 Flags: fpu vme de pse tsc msr pae mce cx8 apic sep mtrr pge mca cmov pat pse36 clflush mmx fxsr sse sse2 ht syscall nx mmxext fxsr_opt pdpe1gb rdtscp lm constant_tsc rep_good nopl nonstop_tsc cpuid extd_apicid amd_dcm aperfmperf pni pclmulqdq monitor ssse3 fma cx16 sse4_1 sse4_2 movbe popcnt xsave avx f16c rdrand lahf_lm cmp_legacy svm extapic cr8_legacy abm sse4a misalignsse 3dnowprefetch osvw skinit wdt tce topoext perfctr_core perfctr_nb bpext perfctr_llc mwaitx cpb hw_pstate sme ssbd sev ibpb vmmcall fsgsbase bmi1 avx2 smep bmi2 MySQLeed adx smap clflushopt sha_ni xsaveopt xsavec xgetbv1 xsaves clzero irperf xsaveerptr arat npt lbrv svm_lock nrip_save tsc_scale vmcb_clean flushbyasid decodeassists pausefilter pfthreshold avic v_vmsave_vmload vgif overflow_recov succor smca #numactl -H available: 4 nodes (0-3) node 0 cpus: 0 1 2 3 4 5 6 7 32 33 34 35 36 37 38 39 node 0 size: 128854 MB node 0 free: 89350 MB node 1 cpus: 8 9 10 11 12 13 14 15 40 41 42 43 44 45 46 47 node 1 size: 129019 MB node 1 free: 89326 MB node 2 cpus: 16 17 18 19 20 21 22 23 48 49 50 51 52 53 54 55 node 2 size: 128965 MB node 2 free: 86542 MB node 3 cpus: 24 25 26 27 28 29 30 31 56 57 58 59 60 61 62 63 node 3 size: 129020 MB node 3 free: 98227 MB node distances: node 0 1 2 3 0: 10 16 28 22 1: 16 10 22 28 2: 28 22 10 16 3: 22 28 16 10 |
这CPU据说是胶水核,也就是把两个die拼一块封装成一块CPU,所以一块CPU内跨die之间延迟还是很高的。
64 个 core 的分配策略
| 1 2 3 4 5 | physical core processor 0 0~15 0~15 1 0~15 16~31 0 0~15 32~47 1 0~15 48~63 |
Intel CPU
Cascade Lake架构相对Broadwell L1没变,L2从256K增加到1M增加了4倍,L3从2.5下降到1.38M每core
| 1 2 3 4 5 6 7 8 9 10 11 12 13 14 15 16 17 18 19 20 21 22 23 24 25 26 27 28 29 30 31 32 33 34 35 36 37 38 39 40 41 42 43 44 45 46 47 48 49 50 51 52 53 54 55 56 57 58 59 60 61 62 63 64 65 66 67 68 69 70 71 72 73 74 75 76 77 | #lscpu Architecture: x86_64 CPU op-mode(s): 32-bit, 64-bit Byte Order: Little Endian CPU(s): 104 On-line CPU(s) list: 0-103 Thread(s) per core: 2 Core(s) per socket: 26 座: 2 NUMA 节点: 1 厂商 ID: GenuineIntel CPU 系列: 6 型号: 85 型号名称: Intel(R) Xeon(R) Platinum 8269CY CPU @ 2.50GHz 步进: 7 CPU MHz: 1200.000 CPU max MHz: 2501.0000 CPU min MHz: 1200.0000 BogoMIPS: 5000.00 虚拟化: VT-x L1d 缓存: 32K L1i 缓存: 32K L2 缓存: 1024K L3 缓存: 36608K NUMA 节点0 CPU: 0-103 Flags: fpu vme de pse tsc msr pae mce cx8 apic sep mtrr pge mca cmov pat pse36 clflush dts acpi mmx fxsr sse sse2 ss ht tm pbe syscall nx pdpe1gb rdtscp lm constant_tsc art arch_perfmon pebs bts rep_good nopl xtopology nonstop_tsc aperfmperf eagerfpu pni pclmulqdq dtes64 monitor ds_cpl vmx smx est tm2 ssse3 sdbg fma cx16 xtpr pdcm pcid dca sse4_1 sse4_2 x2apic movbe popcnt tsc_deadline_timer aes xsave avx f16c rdrand lahf_lm abm 3dnowprefetch epb cat_l3 cdp_l3 intel_ppin intel_pt ssbd mba ibrs ibpb stibp ibrs_enhanced tpr_shadow vnmi flexpriority ept vpid fsgsbase tsc_adjust bmi1 hle avx2 smep bmi2 erms invpcid rtm cqm mpx rdt_a avx512f avx512dq rdseed adx smap clflushopt clwb avx512cd avx512bw avx512vl xsaveopt xsavec xgetbv1 cqm_llc cqm_occup_llc cqm_mbm_total cqm_mbm_local dtherm ida arat pln pts pku ospke avx512_vnni spec_ctrl intel_stibp flush_l1d arch_capabilities # numactl -H available: 1 nodes (0) node 0 cpus: 0 1 2 3 4 5 6 7 8 9 10 11 12 13 14 15 16 17 18 19 20 21 22 23 24 25 26 27 28 29 30 31 32 33 34 35 36 37 38 39 40 41 42 43 44 45 46 47 48 49 50 51 52 53 54 55 56 57 58 59 60 61 62 63 64 65 66 67 68 69 70 71 72 73 74 75 76 77 78 79 80 81 82 83 84 85 86 87 88 89 90 91 92 93 94 95 96 97 98 99 100 101 102 103 node 0 size: 785826 MB node 0 free: 108373 MB node distances: node 0 0: 10 //志强E5 #lscpu Architecture: x86_64 CPU op-mode(s): 32-bit, 64-bit Byte Order: Little Endian CPU(s): 64 On-line CPU(s) list: 0-63 Thread(s) per core: 2 Core(s) per socket: 16 Socket(s): 2 NUMA node(s): 2 Vendor ID: GenuineIntel CPU family: 6 Model: 79 Model name: Intel(R) Xeon(R) CPU E5-2682 v4 @ 2.50GHz Stepping: 1 CPU MHz: 2500.000 CPU max MHz: 3000.0000 CPU min MHz: 1200.0000 BogoMIPS: 5000.06 Virtualization: VT-x L1d cache: 32K L1i cache: 32K L2 cache: 256K L3 cache: 40960K NUMA node0 CPU(s): 0-15,32-47 NUMA node1 CPU(s): 16-31,48-63 Flags: fpu vme de pse tsc msr pae mce cx8 apic sep mtrr pge mca cmov pat pse36 clflush dts acpi mmx fxsr sse sse2 ss ht tm pbe syscall nx pdpe1gb rdtscp lm constant_tsc arch_perfmon pebs bts rep_good nopl xtopology nonstop_tsc aperfmperf eagerfpu pni pclmulqdq dtes64 ds_cpl vmx smx est tm2 ssse3 fma cx16 xtpr pdcm pcid dca sse4_1 sse4_2 x2apic movbe popcnt tsc_deadline_timer aes xsave avx f16c rdrand lahf_lm abm 3dnowprefetch ida arat epb invpcid_single pln pts dtherm spec_ctrl ibpb_support tpr_shadow vnmi flexpriority ept vpid fsgsbase tsc_adjust bmi1 hle avx2 smep bmi2 erms invpcid rtm cqm rdt rdseed adx smap xsaveopt cqm_llc cqm_occup_llc cqm_mbm_total cqm_mbm_local cat_l3 #numactl -H available: 2 nodes (0-1) node 0 cpus: 0 1 2 3 4 5 6 7 8 9 10 11 12 13 14 15 32 33 34 35 36 37 38 39 40 41 42 43 44 45 46 47 node 0 size: 262008 MB node 0 free: 240846 MB node 1 cpus: 16 17 18 19 20 21 22 23 24 25 26 27 28 29 30 31 48 49 50 51 52 53 54 55 56 57 58 59 60 61 62 63 node 1 size: 262144 MB node 1 free: 242774 MB node distances: node 0 1 0: 10 21 1: 21 10 |
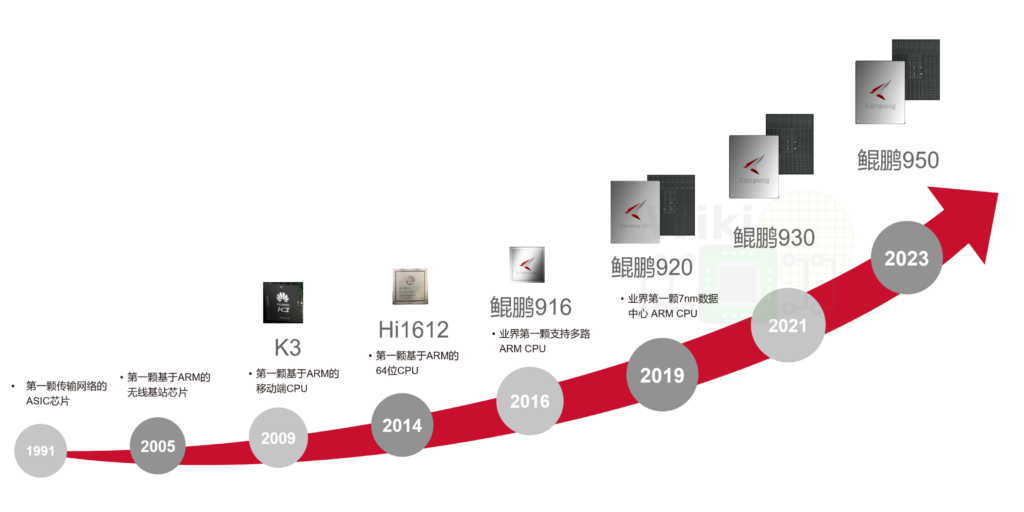
鲲鹏920
鲲鹏920-4826的L1比8269C 大一倍,但是L2小一倍。L3鲲鹏为1M/core 8269为1.38M/core(物理core)
| 1 2 3 4 5 6 7 8 9 10 11 12 13 14 15 16 17 18 19 20 21 22 23 24 25 26 27 28 29 30 31 32 33 34 35 36 37 38 39 40 41 42 43 44 45 46 47 48 49 50 51 | #lscpu Architecture: aarch64 Byte Order: Little Endian CPU(s): 96 On-line CPU(s) list: 0-95 Thread(s) per core: 1 Core(s) per socket: 48 Socket(s): 2 NUMA node(s): 1 Model: 0 CPU max MHz: 2600.0000 CPU min MHz: 200.0000 BogoMIPS: 200.00 L1d cache: 64K L1i cache: 64K L2 cache: 512K L3 cache: 49152K NUMA node0 CPU(s): 0-95 Flags: fp asimd evtstrm aes pmull sha1 sha2 crc32 atomics fphp asimdhp cpuid asimdrdm jscvt fcma dcpop asimddp asimdfhm #numactl -H available: 4 nodes (0-3) node 0 cpus: 0 1 2 3 4 5 6 7 8 9 10 11 12 13 14 15 16 17 18 19 20 21 22 23 node 0 size: 192832 MB node 0 free: 187693 MB node 1 cpus: 24 25 26 27 28 29 30 31 32 33 34 35 36 37 38 39 40 41 42 43 44 45 46 47 node 1 size: 193533 MB node 1 free: 191827 MB node 2 cpus: 48 49 50 51 52 53 54 55 56 57 58 59 60 61 62 63 64 65 66 67 68 69 70 71 node 2 size: 193533 MB node 2 free: 192422 MB node 3 cpus: 72 73 74 75 76 77 78 79 80 81 82 83 84 85 86 87 88 89 90 91 92 93 94 95 node 3 size: 193532 MB node 3 free: 193139 MB node distances: node 0 1 2 3 0: 10 12 20 22 1: 12 10 22 24 2: 20 22 10 12 3: 22 24 12 10 #dmidecode -t processor | grep Version Version: Kunpeng 920-4826 Version: Kunpeng 920-4826 以上四个鲲鹏920的四个NUMA node之间的距离描述如下: node 0 <------------ socket distance ------------> node 2 | (die distance) | (die distance) node 1 node 3 要注意node1到node3比node0到node3要大,猜测Socket之间的UPI只接上了node1和node2 |
鲲鹏920架构参考这里
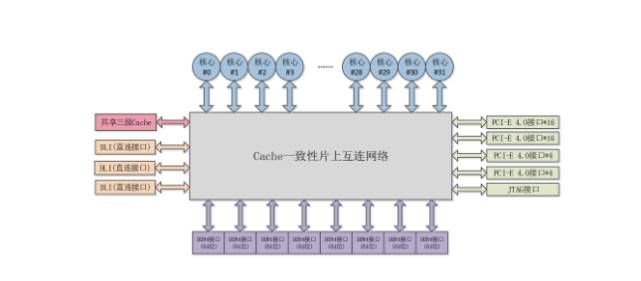
Though Huawei has been keeping a tight lip on the chip design itself, the Hi1620 is actually a multi-chip design. Actually, we believe are three dies. The chip itself comprise two compute dies called the Super CPU cluster (SCCL), each one packing 32 cores. It’s also possible the SCCL only have 24 cores, in which case there are three such dies with a theoretical maximum core count of 72 cores possible but are not offered for yield reasons. Regardless of this, there are at least two SCCL dies for sure. Additionally, there is also an I/O die called the Super IO Cluster (SICL) which contains all the high-speed SerDes and low-speed I/Os.
下图是6426型号,我测试用的是4826型号,也就是一个CPU内是48core,一个CPU封装3个Die,两个Die是 core,还有一个是Super IO Cluster
鲲鹏命令规范:
鲲鹏 RoadMap
鲲鹏 Kunpeng 920-4826 跨numa性能比较
绑24core,跨numa0、numa3,是numactl -H看到的比较远距离。两分钟的 Current tpmC: 69660
| 1 2 3 4 5 6 7 8 9 10 11 12 13 14 15 16 17 18 19 20 21 22 23 24 25 26 27 28 29 30 | #taskset -a -cp 12-23,72-83 20799 #perf stat -e branch-misses,bus-cycles,cache-misses,cache-references,cpu-cycles,instructions,stalled-cycles-backend,stalled-cycles-frontend,L1-dcache-load-misses,L1-dcache-loads,L1-dcache-store-misses,L1-dcache-stores,L1-icache-load-misses,L1-icache-loads,branch-load-misses,branch-loads,dTLB-load-misses,dTLB-loads,iTLB-load-misses,iTLB-loads,cpu-migrations -p 20799 ^C Performance counter stats for process id '20799': 2,866,418,154 branch-misses (59.84%) 549,673,215,827 bus-cycles (59.89%) 2,179,816,578 cache-misses # 2.360 % of all cache refs (59.93%) 92,377,674,343 cache-references (60.04%) 549,605,057,475 cpu-cycles (65.05%) 229,958,980,614 instructions # 0.42 insn per cycle # 1.31 stalled cycles per insn (65.05%) 146,201,062,116 stalled-cycles-backend # 26.60% backend cycles idle (65.08%) 301,814,831,043 stalled-cycles-frontend # 54.91% frontend cycles idle (65.08%) 2,177,062,319 L1-dcache-load-misses # 2.35% of all L1-dcache hits (65.04%) 92,481,797,426 L1-dcache-loads (65.11%) 2,175,030,428 L1-dcache-store-misses (65.15%) 92,507,474,710 L1-dcache-stores (65.14%) 9,299,812,249 L1-icache-load-misses # 12.47% of all L1-icache hits (65.20%) 74,579,909,037 L1-icache-loads (65.16%) 2,862,664,443 branch-load-misses (65.08%) 52,826,930,842 branch-loads (65.04%) 3,729,265,130 dTLB-load-misses # 3.11% of all dTLB cache hits (64.95%) 119,896,014,498 dTLB-loads (59.90%) 1,350,782,047 iTLB-load-misses # 1.83% of all iTLB cache hits (59.84%) 74,005,620,378 iTLB-loads (59.82%) 510 cpu-migrations 9.483137760 seconds time elapsed |
绑72-95core,在同一个numa下,但是没有重启进程,导致有一半内存仍然在numa0上,2分钟的Current tpmC: 75900
| 1 2 3 4 5 6 7 8 9 10 11 12 13 14 15 16 17 18 19 20 21 22 23 24 25 26 27 28 29 30 31 32 33 34 35 36 37 38 39 40 41 42 | #taskset -a -cp 72-95 20799 #perf stat -e branch-misses,bus-cycles,cache-misses,cache-references,cpu-cycles,instructions,stalled-cycles-backend,stalled-cycles-frontend,L1-dcache-load-misses,L1-dcache-loads,L1-dcache-store-misses,L1-dcache-stores,L1-icache-load-misses,L1-icache-loads,branch-load-misses,branch-loads,dTLB-load-misses,dTLB-loads,iTLB-load-misses,iTLB-loads,cpu-migrations -p 20799 ^C Performance counter stats for process id '20799': 2,665,583,722 branch-misses (59.90%) 500,184,789,050 bus-cycles (59.95%) 1,997,726,097 cache-misses # 2.254 % of all cache refs (59.94%) 88,628,013,529 cache-references (59.93%) 500,111,712,450 cpu-cycles (64.98%) 221,098,464,920 instructions # 0.44 insn per cycle # 1.35 stalled cycles per insn (65.02%) 105,957,124,479 stalled-cycles-backend # 21.19% backend cycles idle (65.02%) 298,186,439,955 stalled-cycles-frontend # 59.62% frontend cycles idle (65.02%) 1,996,313,908 L1-dcache-load-misses # 2.25% of all L1-dcache hits (65.04%) 88,701,699,646 L1-dcache-loads (65.09%) 1,997,851,364 L1-dcache-store-misses (65.10%) 88,614,658,960 L1-dcache-stores (65.10%) 8,635,807,737 L1-icache-load-misses # 12.30% of all L1-icache hits (65.13%) 70,233,323,630 L1-icache-loads (65.16%) 2,665,567,783 branch-load-misses (65.10%) 50,482,936,168 branch-loads (65.09%) 3,614,564,473 dTLB-load-misses # 3.15% of all dTLB cache hits (65.04%) 114,619,822,486 dTLB-loads (59.96%) 1,270,926,362 iTLB-load-misses # 1.81% of all iTLB cache hits (59.97%) 70,248,645,721 iTLB-loads (59.94%) 128 cpu-migrations 8.610934700 seconds time elapsed #/root/numa-maps-summary.pl </proc/20799/numa_maps N0 : 8220658 ( 31.36 GB) N1 : 38620 ( 0.15 GB) N2 : 480619 ( 1.83 GB) N3 : 8281759 ( 31.59 GB) active : 28797 ( 0.11 GB) anon : 17015902 ( 64.91 GB) dirty : 16990615 ( 64.81 GB) kernelpagesize_kB: 9076 ( 0.03 GB) mapmax : 760 ( 0.00 GB) mapped : 5754 ( 0.02 GB) |
重启进程后继续绑72-95core,在同一个numa下,先进成充分热身,然后2分钟的 Current tpmC: 77880
| 1 2 3 4 5 6 7 8 9 10 11 12 13 14 15 16 17 18 19 20 21 22 23 24 25 26 27 28 29 30 31 32 33 34 35 36 37 38 | #perf stat -e branch-misses,bus-cycles,cache-misses,cache-references,cpu-cycles,instructions,stalled-cycles-backend,stalled-cycles-frontend,L1-dcache-load-misses,L1-dcache-loads,L1-dcache-store-misses,L1-dcache-stores,L1-icache-load-misses,L1-icache-loads,branch-load-misses,branch-loads,dTLB-load-misses,dTLB-loads,iTLB-load-misses,iTLB-loads,cpu-migrations -p 49512 ^C Performance counter stats for process id '49512': 1,849,313,199 branch-misses (59.99%) 319,122,053,367 bus-cycles (60.02%) 1,319,212,546 cache-misses # 2.238 % of all cache refs (59.95%) 58,950,581,370 cache-references (60.02%) 319,088,767,311 cpu-cycles (65.01%) 146,580,891,374 instructions # 0.46 insn per cycle # 1.32 stalled cycles per insn (65.01%) 61,109,919,226 stalled-cycles-backend # 19.15% backend cycles idle (65.04%) 193,963,590,196 stalled-cycles-frontend # 60.79% frontend cycles idle (65.06%) 1,319,593,051 L1-dcache-load-misses # 2.24% of all L1-dcache hits (65.03%) 58,967,303,454 L1-dcache-loads (65.04%) 1,318,842,690 L1-dcache-store-misses (65.13%) 58,988,059,583 L1-dcache-stores (65.07%) 5,769,871,870 L1-icache-load-misses # 12.25% of all L1-icache hits (65.12%) 47,085,299,316 L1-icache-loads (65.10%) 1,850,419,802 branch-load-misses (65.03%) 33,687,548,636 branch-loads (65.08%) 2,375,028,039 dTLB-load-misses # 3.12% of all dTLB cache hits (65.08%) 76,113,084,244 dTLB-loads (60.01%) 825,388,210 iTLB-load-misses # 1.75% of all iTLB cache hits (59.99%) 47,092,738,092 iTLB-loads (59.95%) 49 cpu-migrations #/root/numa-maps-summary.pl </proc/49512/numa_maps N0 : 5765 ( 0.02 GB) N1 : 41599 ( 0.16 GB) N2 : 566 ( 0.00 GB) N3 : 16955491 ( 64.68 GB) active : 30430 ( 0.12 GB) anon : 16997663 ( 64.84 GB) dirty : 16989252 ( 64.81 GB) kernelpagesize_kB: 9020 ( 0.03 GB) mapmax : 745 ( 0.00 GB) mapped : 5758 ( 0.02 GB) |
IPC从0.42到0.44再到0.46,tpmC也不断增加,整体压力都不大只压了25%的CPU,所以跨NUMA大概有10%的性能差异. IPC也是0.42 VS 0.46 。测试场景是DRDS Server服务。
如果跨4core绑定core的话最好和最差绑法性能会下降25-30%,四个core绑不同numa的性能比较
| 被压进程绑定的core id | tpmC |
|---|---|
| 72,73,74,75 | 14460 |
| 48,49,72,73 | 13800 |
| 24,25,72,73 | 11760 |
| 0,1,72,73 | 11940 |
| 0,24,48,72 | 10800 |
飞腾2500
| 1 2 3 4 5 6 7 8 9 10 11 12 13 14 15 16 17 18 19 20 21 22 23 24 25 26 27 28 29 30 31 32 33 34 35 36 37 38 39 40 41 42 43 44 45 46 47 48 49 50 51 52 53 54 55 56 57 58 59 60 61 62 63 64 65 66 67 68 69 70 71 72 73 74 75 76 77 78 79 80 81 82 83 84 85 86 87 88 89 | #lscpu Architecture: aarch64 Byte Order: Little Endian CPU(s): 128 On-line CPU(s) list: 0-127 Thread(s) per core: 1 Core(s) per socket: 64 Socket(s): 2 NUMA node(s): 16 Model: 3 BogoMIPS: 100.00 L1d cache: 32K L1i cache: 32K L2 cache: 2048K L3 cache: 65536K NUMA node0 CPU(s): 0-7 NUMA node1 CPU(s): 8-15 NUMA node2 CPU(s): 16-23 NUMA node3 CPU(s): 24-31 NUMA node4 CPU(s): 32-39 NUMA node5 CPU(s): 40-47 NUMA node6 CPU(s): 48-55 NUMA node7 CPU(s): 56-63 NUMA node8 CPU(s): 64-71 NUMA node9 CPU(s): 72-79 NUMA node10 CPU(s): 80-87 NUMA node11 CPU(s): 88-95 NUMA node12 CPU(s): 96-103 NUMA node13 CPU(s): 104-111 NUMA node14 CPU(s): 112-119 NUMA node15 CPU(s): 120-127 Flags: fp asimd evtstrm aes pmull sha1 sha2 crc32 cpuid node distances: node 0 1 2 3 4 5 6 7 8 9 10 11 12 13 14 15 0: 10 20 40 30 20 30 50 40 100 100 100 100 100 100 100 100 1: 20 10 30 40 50 20 40 50 100 100 100 100 100 100 100 100 2: 40 30 10 20 40 50 20 30 100 100 100 100 100 100 100 100 3: 30 40 20 10 30 20 40 50 100 100 100 100 100 100 100 100 4: 20 50 40 30 10 50 30 20 100 100 100 100 100 100 100 100 5: 30 20 50 20 50 10 50 40 100 100 100 100 100 100 100 100 6: 50 40 20 40 30 50 10 30 100 100 100 100 100 100 100 100 7: 40 50 30 50 20 40 30 10 100 100 100 100 100 100 100 100 8: 100 100 100 100 100 100 100 100 10 20 40 30 20 30 50 40 9: 100 100 100 100 100 100 100 100 20 10 30 40 50 20 40 50 10: 100 100 100 100 100 100 100 100 40 30 10 20 40 50 20 30 11: 100 100 100 100 100 100 100 100 30 40 20 10 30 20 40 50 12: 100 100 100 100 100 100 100 100 20 50 40 30 10 50 30 20 13: 100 100 100 100 100 100 100 100 30 20 50 20 50 10 50 40 14: 100 100 100 100 100 100 100 100 50 40 20 40 30 50 10 30 15: 100 100 100 100 100 100 100 100 40 50 30 50 20 40 30 10 #dmidecode -t processor # dmidecode 3.0 Getting SMBIOS data from sysfs. SMBIOS 3.2.0 present. # SMBIOS implementations newer than version 3.0 are not # fully supported by this version of dmidecode. Handle 0x0004, DMI type 4, 48 bytes Processor Information Socket Designation: BGA3576 Type: Central Processor Family: <OUT OF SPEC> Manufacturer: PHYTIUM ID: 00 00 00 00 70 1F 66 22 Version: FT2500 Voltage: 0.8 V External Clock: 50 MHz Max Speed: 2100 MHz Current Speed: 2100 MHz Status: Populated, Enabled Upgrade: Other L1 Cache Handle: 0x0005 L2 Cache Handle: 0x0007 L3 Cache Handle: 0x0008 Serial Number: 1234567 Asset Tag: No Asset Tag Part Number: NULL Core Count: 64 Core Enabled: 64 Thread Count: 64 Characteristics: 64-bit capable Multi-Core Hardware Thread Execute Protection Enhanced Virtualization Power/Performance Control |
申威3231
申威系列微处理器的开发主要是被中华人民共和国用于军事方面[来源请求]。根据部分公开信息表明,此系列的微体系架构基于DEC Alpha派生而来。[1][2]而SW-3/SW1600处理器则是基于Alpha 21164。[3]
不过申威系列最新的SW26010处理器,目前没有详细的信息表明它是基于DEC Alpha微架构的派生品。[4][5]不过处理器的处理器核心结构布局,则是类似于基于POWER指令集架构的Cell微架构)。
申威 3231处理器是基于第三代“申威 64” 二次优化版核心(C3B)的国产高性能多核处理器。3231的内核与1621属于同一代,采用新一代工艺,最高主频2.5Ghz,32核心,3231基本上可以视为1621换工艺后的32核版本,主要面向高性能计算和高端服务器应用。
申威 3231采用“申威64”自主指令系统;
基于第三代“申威 64”二次优化版核心(C3B)的32核64位通用处理器;
采用CC-NUMA多核结构和SoC技术,片内包含8路DDR4存储控制器接口以及40lane的PCI-E 4.0标准I/O接口;
集成3路直连接口,可构建2路或4路服务器系统;
计算性能:双精度浮点性能可达1280GFlops,整数性能可达880Gops;
访存性能:最大传输率为3200Mbps,最大总存储器容量2TB;
I/O性能:双向聚合有效带宽可达到160GB/s,支持I/O虚拟化。
3232推出的时间会比3231迟一些,采用新一代CPU核,IPC会非常惊人,保底10/G,争取12/G,考虑倒申威团队一向严谨,以及过去基本没有让大家失望过,因而对3232的IPC,可以采用就高原则。
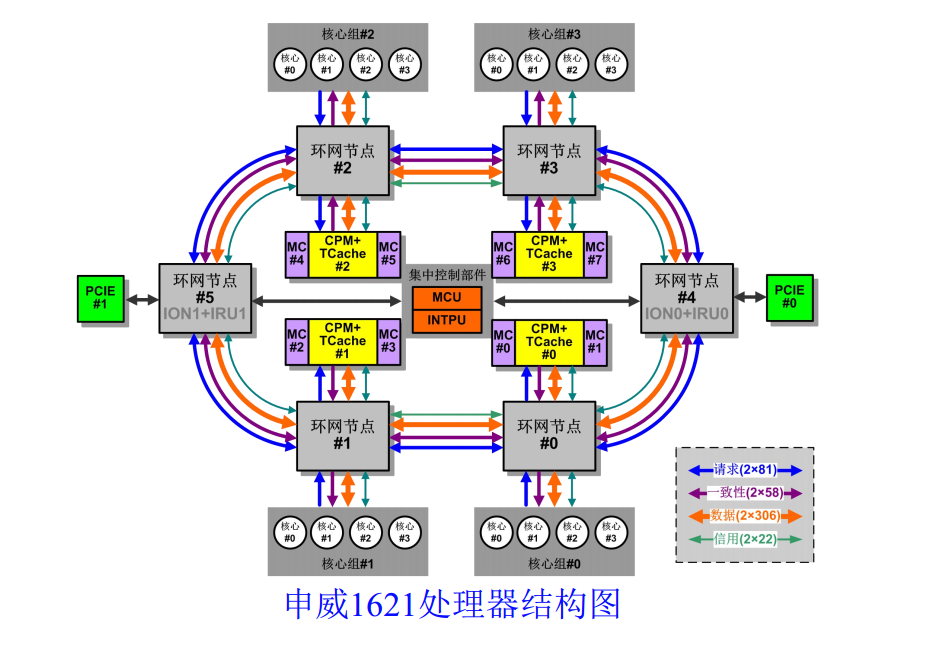
申威 3231架构
申威 6B 芯片结构的主要特点如下:
- 全芯片集成 32 个物理核心,每个物理核心支持 1 个线程,软件可见 32 个逻辑核心;
-
每个物理核心集成 32KB L1 指令 Cache(ICache)、32KB L1 数据 Cache(DCache)和 512KB 的 L2 Cache(SCache),核心内的所有 Cache 为核心私有 Cache;
-
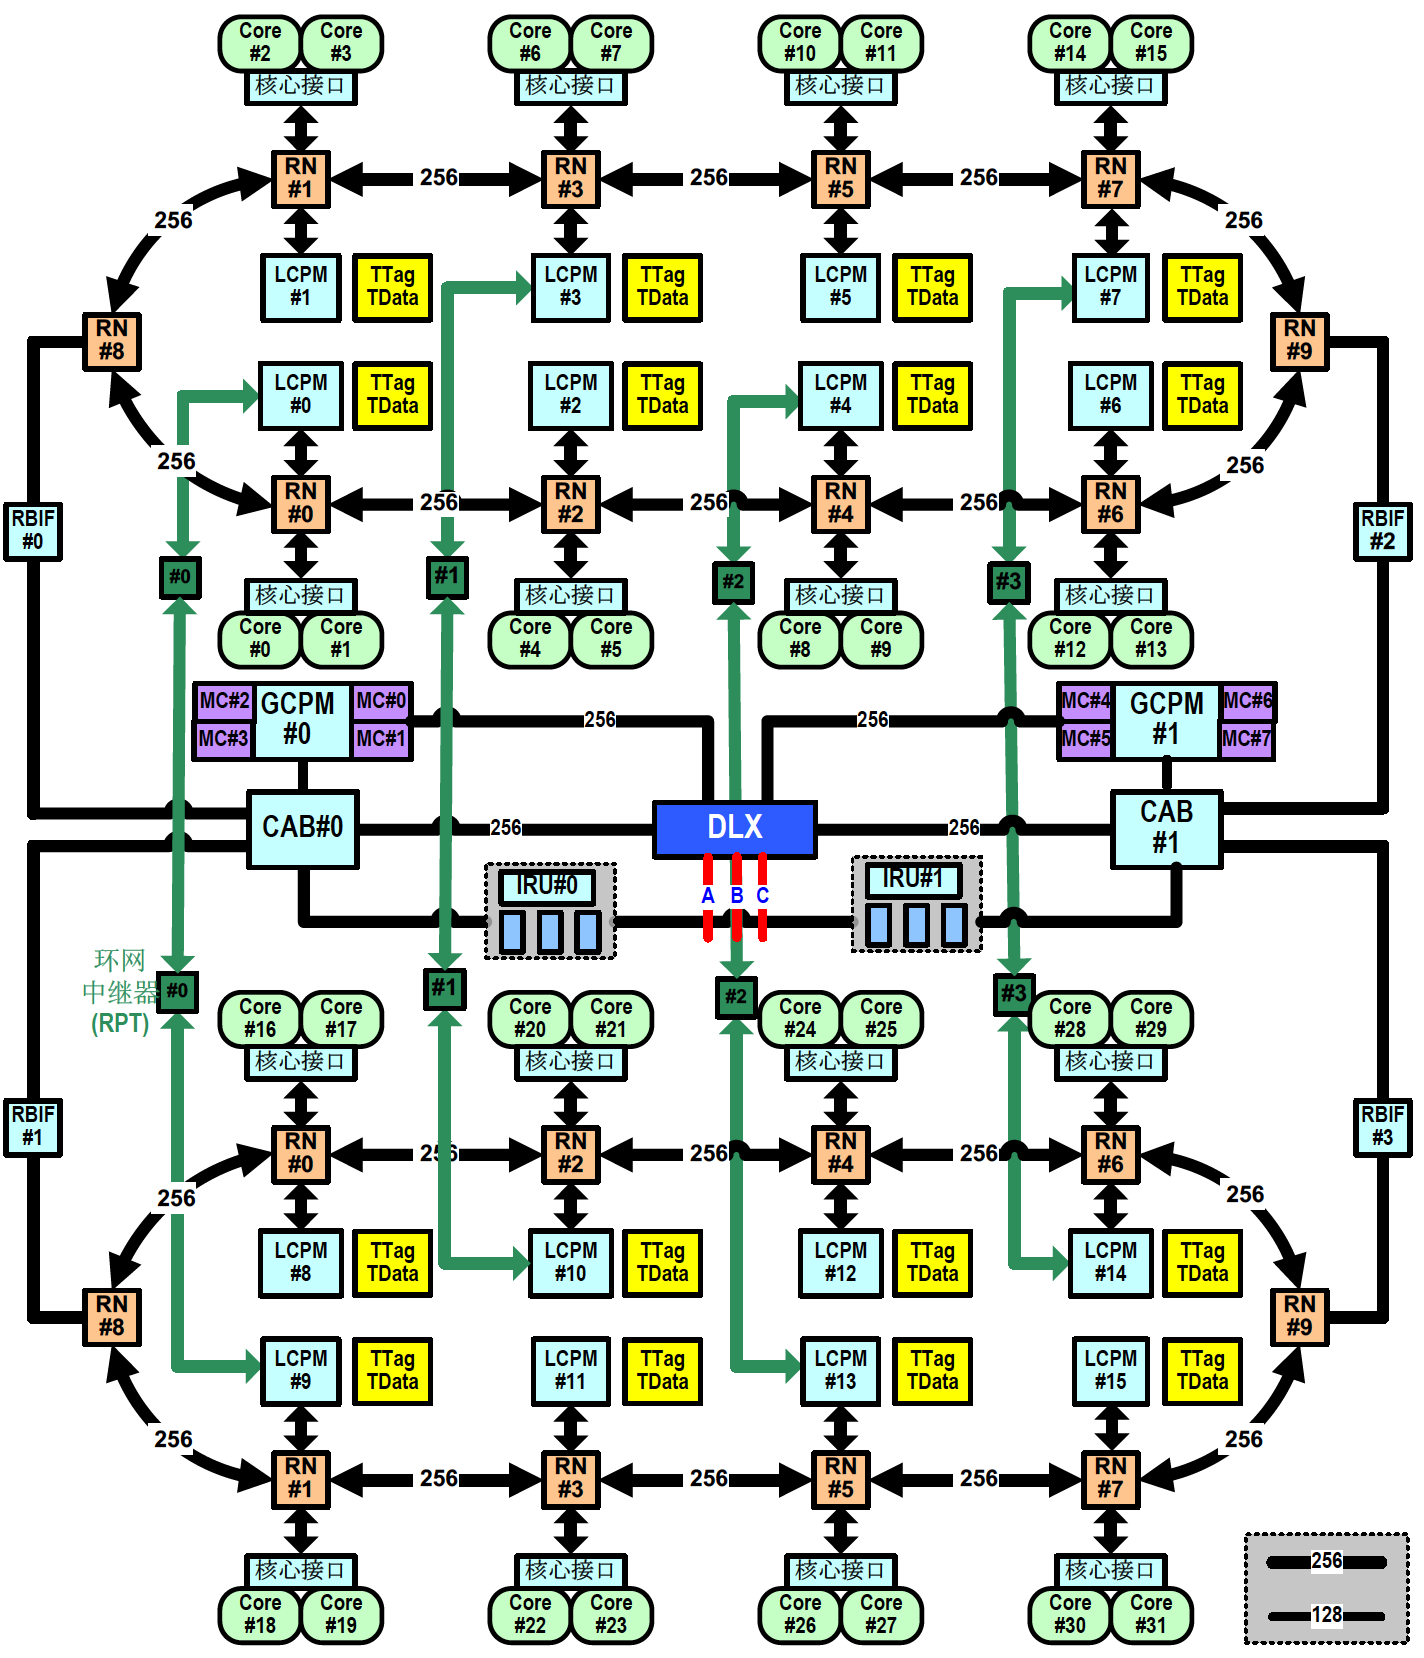
全芯片集成 64MB 的 L3 Cache(TCache),本芯片内所有核心分布共享,TCache 由16 个体组成,每个体跟2 个物理核心及其对应的管理部件(LCPM)一起组成一个核组,连接在环网节点上,核心访问不同 TCache 体中的副本延迟略有不同;
-
存储器接口:全芯片集成 8 个 DDR4 存储器通道,每个通道数据宽度为 72bit(含 8 位 ECC),支持 UDIMM、RDIMM 和 LRDIMM,单通道内存容量最大支持 256GB 容量,单通道带宽可达 25.6GB/s(DDR4-3200);每4 个存储器通道对应一个主存代理部件(GCPM),所有核心和 IO 设备都可访问;
-
PCIe 接口:全芯片集成 40 Lane 的 PCIe 4.0 链路,支持 x4、x8 和 x16 灵活配置,最大支持 6 个 RC;
-
直连接口:全芯片集成 3 路直连接口,可构建 2 路或 4 路服务器系统,每路直连接口为9 个lane的serdes 接口,接口速率为28Gbps;
-
维护调试测试接口:维护控制部件实现芯片配置、初始引导以及提供各种维护和调试支持。维护控制部件支持芯片的上电初始化、配置加载、存储器读写或 IO 读写、维护中断以及内部状态的扫描观测等。支持外部维护通过 Jtag 接口进行初始引导;支持通过 SPI Master 接口从 SPI Flash中进行自举引导;
- 集成三套 I2C 接口、一套 Uart、GPIO 和 LPC 低速接口。
申威1621处理器是基于第三代“申威64”核心(增强版)的国产高性能多核处理器,主要面向高性能计算和中高端服务器应用。目前,该处理器已经实现量产。
申威1621采用对称多核结构和SoC技术,单芯片集成了16个64位RISC结构的申威处理器核心,目标设计主频为2GHz。芯片还集成八路DDR3存储控制器和双路PCI-E3.0标准I/O接口。
| 1 2 3 4 5 6 7 8 9 10 11 12 13 14 15 16 17 18 19 20 21 22 23 24 25 26 27 28 29 30 31 32 33 34 35 36 37 38 39 40 41 42 43 44 45 46 47 48 49 50 51 52 53 54 55 56 57 58 59 60 61 62 63 64 65 66 67 68 69 70 71 72 73 74 75 76 77 78 79 80 81 82 83 84 85 86 87 88 89 90 91 92 | #dmidecode -t processor # dmidecode 3.0 Getting SMBIOS data from sysfs. SMBIOS 3.2.0 present. # SMBIOS implementations newer than version 3.0 are not # fully supported by this version of dmidecode. Handle 0x0022, DMI type 4, 48 bytes Processor Information Socket Designation: CPU 0 Type: Central Processor Family: Other Manufacturer: SW3231 ID: 28 00 C8 80 01 00 00 00 Version: Product Voltage: 3.3 V External Clock: 200 MHz Max Speed: 2400 MHz Current Speed: 2400 MHz Status: Unpopulated Upgrade: Other L1 Cache Handle: 0x2000 L2 Cache Handle: 0x2002 L3 Cache Handle: 0x2003 Serial Number: ....... Asset Tag: Asset Tag#To Be Filled By O.E.M. Part Number: Part Number#To Be Filled By O.E.M. Core Count: 32 Core Enabled: 32 Thread Count: 0 Characteristics: 64-bit capable Handle 0x0023, DMI type 4, 48 bytes Processor Information Socket Designation: CPU 1 Type: Central Processor Family: Other Manufacturer: SW3231 ID: 28 00 C8 80 01 00 00 00 Version: Product Voltage: 3.3 V External Clock: 200 MHz Max Speed: 2400 MHz Current Speed: 2400 MHz Status: Unpopulated Upgrade: Other L1 Cache Handle: 0x2000 L2 Cache Handle: 0x2002 L3 Cache Handle: 0x2003 Serial Number: ....... Asset Tag: Asset Tag#To Be Filled By O.E.M. Part Number: Part Number#To Be Filled By O.E.M. Core Count: 32 Core Enabled: 32 Thread Count: 0 Characteristics: 64-bit capable [root@d22b04001.cloud.b04.amtest11 /root] 193E_OPS1 #numactl -H available: 2 nodes (0-1) node 0 cpus: 0 1 2 3 4 5 6 7 8 9 10 11 12 13 14 15 16 17 18 19 20 21 22 23 24 25 26 27 28 29 30 31 node 0 size: 259482 MB node 0 free: 121171 MB node 1 cpus: 32 33 34 35 36 37 38 39 40 41 42 43 44 45 46 47 48 49 50 51 52 53 54 55 56 57 58 59 60 61 62 63 node 1 size: 260091 MB node 1 free: 88564 MB node distances: node 0 1 0: 10 20 1: 20 10 #lscpu Architecture: sw_64 CPU op-mode(s): 64-bit Byte Order: Little Endian CPU(s): 64 On-line CPU(s) list: 0-63 Thread(s) per core: 1 Core(s) per socket: 32 Socket(s): 2 NUMA node(s): 2 Vendor ID: sw CPU family: 6 Model: 6 Model name: sw CPU MHz: 2400.00 BogoMIPS: 4800.00 NUMA node0 CPU(s): 0-31 NUMA node1 CPU(s): 32-63 |
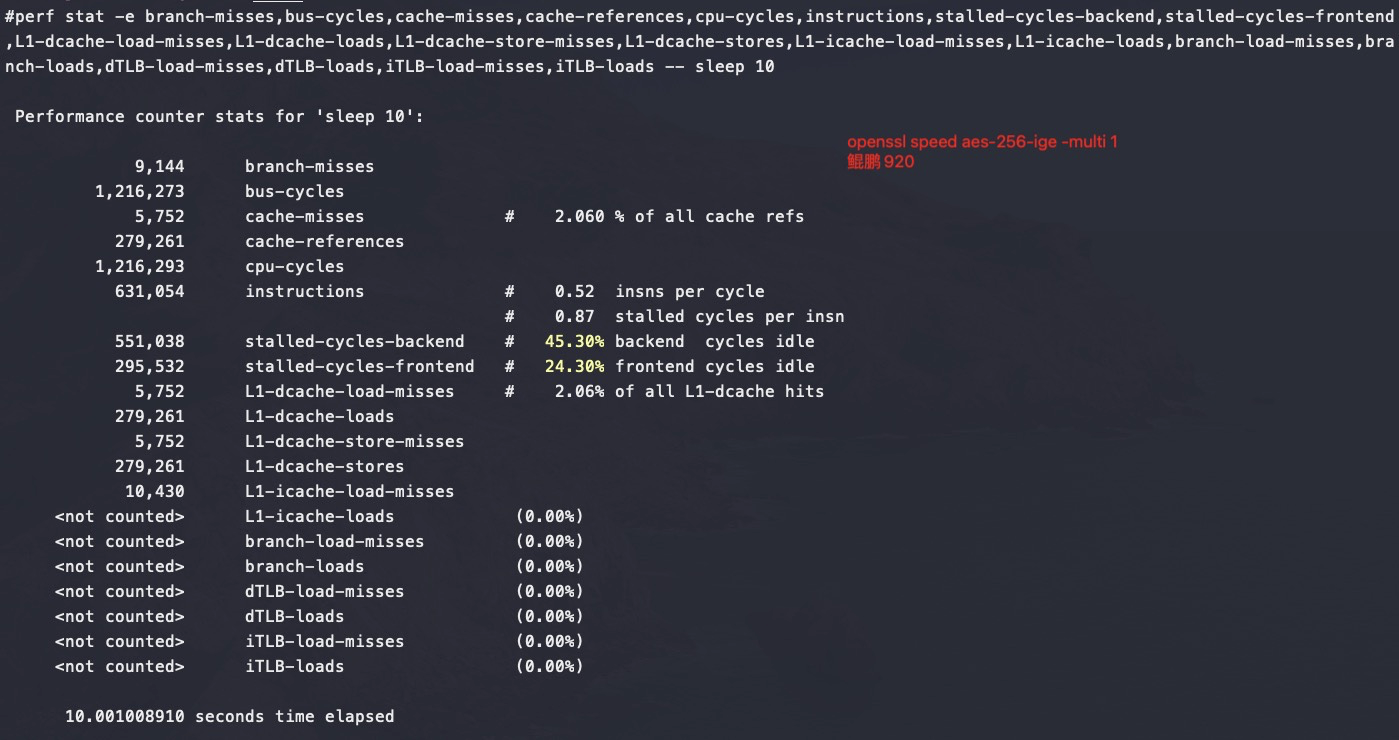
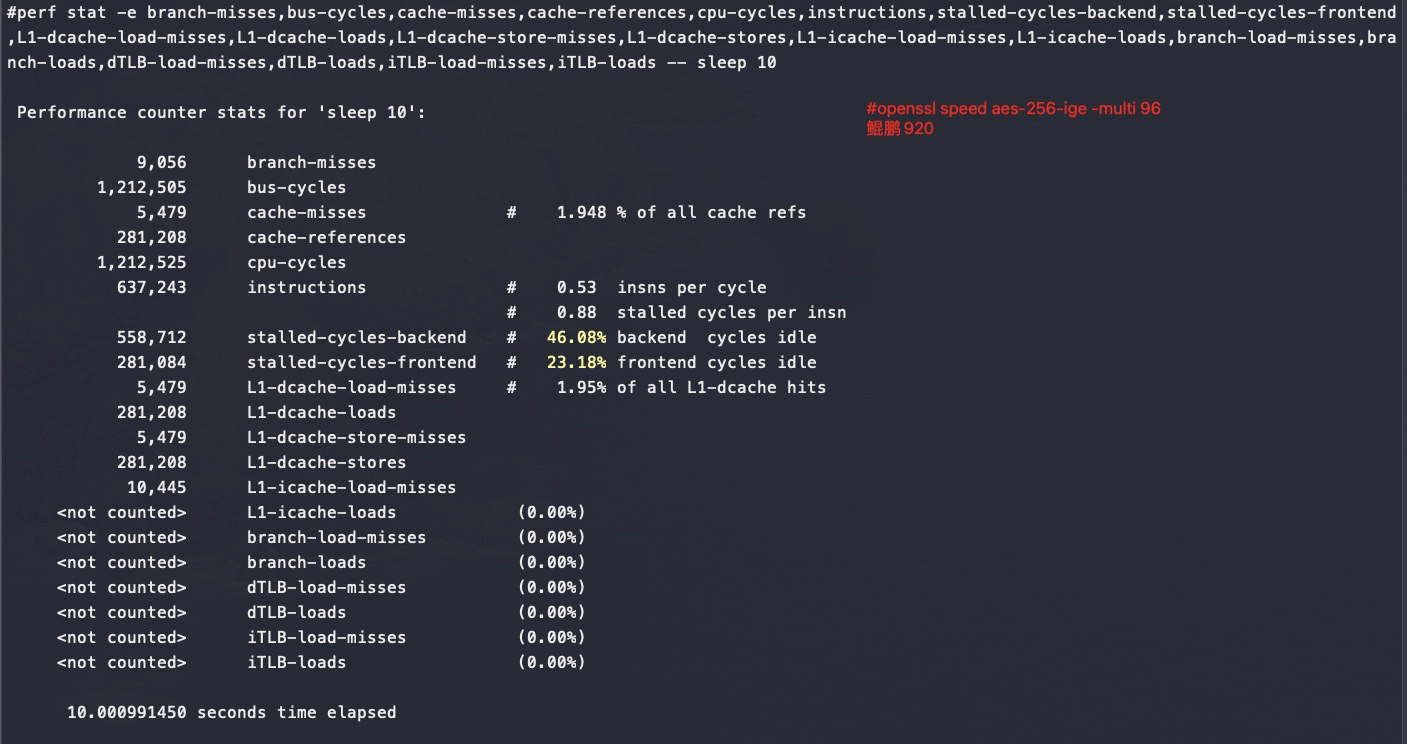
openssl speed aes-256-ige性能比较
测试脚本
openssl speed aes-256-ige -multi 1
单核能力
| Intel (52物理core) | aes-256 ige 89602.86k 97498.37k 98271.49k 98399.91k 89101.65k |
|---|---|
| 海光(32物理core) | aes-256 ige 76919.66k 77935.81k 79201.88k 79529.30k 79555.24k |
| 鲲鹏920(96物理core) | aes-256 ige 133174.89k 140578.99k 142156.46k 142663.34k 143196.16k |
测试32个线程并行
| Intel (52物理core) | aes-256 ige 2642742.25k 2690638.98k 2703860.74k 2734114.82k 2680422.40 |
|---|---|
| 海光(32物理core) | aes-256 ige 2464568.75k 2499381.80k 2528665.34k 2544845.14k 2550723.93k |
| 鲲鹏920(96物理core) | aes-256 ige 4261589.92k 4501245.55k 4552731.56k 4570456.75k 4584330.58k |
将所有核跑满包括HT
| Intel (52物理core) | aes-256 ige 4869950.82k 5179884.71k 5135412.14k 5211367.08k 5247858.60k |
|---|---|
| 海光(32物理core) | aes-256 ige 2730195.74k 2836759.53k 2865252.35k 2857900.71k 2884302.17k |
| 鲲鹏920(96物理core) | aes-256 ige 12788358.79k 13502288.53k 13657385.98k 13710908.76k 13751432.53k |
单核计算 7^999999” 的性能对比
测试命令:bash -c ‘echo “7^999999” | bc > /dev/null’
| 执行时间(秒) | IPC | 主频 | |
|---|---|---|---|
| 海光 | 26.729972414 | 0.92 | 2.5G |
| 鲲鹏920 | 24.604603640 | 1.84 | 2.6G |
| 飞腾2500 | 39.654819568 | 0.43 | 2.1G |
| Intel | 18.603323495 | 2.19 | 2.5G |
| 710 | 15.832394912 | 2.64 | 2.75G |
当然也可以通过计算pi值来测试
bash -c ‘ echo “scale=5000; 4*a(1)” | bc -l -q >/dev/null ‘
| 执行时间(秒) | 主频 | |
|---|---|---|
| 海光 | 31.061s | 2.5G |
| 鲲鹏920 | 23.521s | 2.6G |
| 飞腾2500 | 2.1G | |
| Intel | 22.979s(8163) | 2.5G |
| 710 | 15.570s | 2.75G |
多核一起跑的话可以这样:
for i in {0..95}; do time echo “scale=5000; 4*a(1)” | bc -l -q >/dev/null & done
perf stat -e branch-misses,bus-cycles,cache-misses,cache-references,cpu-cycles,instructions,stalled-cycles-backend,stalled-cycles-frontend,L1-dcache-load-misses,L1-dcache-loads,L1-dcache-store-misses,L1-dcache-stores,L1-icache-load-misses,L1-icache-loads,branch-load-misses,branch-loads,dTLB-load-misses,dTLB-loads,iTLB-load-misses,iTLB-loads –
710
耗时15.83秒,ipc 2.64
| 1 2 3 4 5 6 7 8 9 10 11 12 13 14 15 16 17 | perf stat -e branch-misses,bus-cycles,cache-misses,cache-references,cpu-cycles,instructions,stalled-cycles-backend,stalled-cycles-frontend,alignment-faults,bpf-output,context-switches,cpu-clock,cpu-migrations,dummy,emulation-faults,major-faults,minor-faults,page-faults,task-clock,L1-dcache-load-misses,L1-dcache-loads,L1-icache-load-misses,L1-icache-loads,LLC-load-misses,LLC-loads,branch-load-misses,branch-loads,dTLB-load-misses,dTLB-loads,iTLB-load-misses,iTLB-loads -- bash -c 'echo "7^999999" | bc > /dev/null' Performance counter stats for 'bash -c echo "7^999999" | bc > /dev/null': 985,496,277 branch-misses (29.97%) 43,509,183,948 bus-cycles # 2748.210 M/sec (29.97%) 7,068,868 cache-misses # 0.020 % of all cache refs (29.96%) 35,165,185,942 cache-references # 2221.170 M/sec (29.97%) 43,508,579,063 cpu-cycles # 2.748 GHz (34.97%) 114,779,081,188 instructions # 2.64 insn per cycle # 0.04 stalled cycles per insn (34.99%) 4,913,750,141 stalled-cycles-backend # 11.29% backend cycles idle (35.02%) 4,255,139,235 stalled-cycles-frontend # 9.78% frontend cycles idle (35.02%) 0 alignment-faults # 0.000 K/sec 0 bpf-output # 0.000 K/sec 24 context-switches # 0.002 K/sec 15,831.82 msec cpu-clock # 1.000 CPUs utilized |
intel
耗时18.60秒,ipc 2.19
| 1 2 3 4 5 6 7 8 9 10 11 12 13 14 15 16 17 18 19 20 21 22 23 24 25 26 27 28 29 30 31 32 33 34 35 36 37 | # sudo perf stat -e branch-instructions,branch-misses,bus-cycles,cache-misses,cache-references,cpu-cycles,instructions,ref-cycles,L1-dcache-load-misses,L1-dcache-loads,L1-dcache-stores,L1-icache-load-misses,LLC-load-misses,LLC-loads,LLC-store-misses,LLC-stores,branch-load-misses,branch-loads,dTLB-load-misses,dTLB-loads,dTLB-store-misses,dTLB-stores,iTLB-load-misses,iTLB-loads,node-load-misses,node-loads,node-store-misses,node-stores -- bash -c 'echo "7^999999" | bc > /dev/null' Performance counter stats for 'bash -c echo "7^999999" | bc > /dev/null': 25,130,886,211 branch-instructions (10.72%) 1,200,086,175 branch-misses # 4.78% of all branches (14.29%) 460,824,074 bus-cycles (14.29%) 1,983,459 cache-misses # 46.066 % of all cache refs (14.30%) 4,305,730 cache-references (14.30%) 58,626,314,801 cpu-cycles (17.87%) 128,284,870,917 instructions # 2.19 insn per cycle (21.45%) 46,040,656,499 ref-cycles (25.02%) 22,821,794 L1-dcache-load-misses # 0.10% of all L1-dcache hits (25.02%) 23,041,732,649 L1-dcache-loads (25.01%) 5,386,243,625 L1-dcache-stores (25.00%) 12,443,154 L1-icache-load-misses (25.00%) 178,790 LLC-load-misses # 30.52% of all LL-cache hits (14.28%) 585,724 LLC-loads (14.28%) 469,381 LLC-store-misses (7.14%) 664,865 LLC-stores (7.14%) 1,201,547,113 branch-load-misses (10.71%) 25,139,625,428 branch-loads (14.28%) 63,334 dTLB-load-misses # 0.00% of all dTLB cache hits (14.28%) 23,023,969,089 dTLB-loads (14.28%) 17,355 dTLB-store-misses (14.28%) 5,378,496,562 dTLB-stores (14.28%) 341,119 iTLB-load-misses # 119.92% of all iTLB cache hits (14.28%) 284,445 iTLB-loads (14.28%) 151,608 node-load-misses (14.28%) 37,553 node-loads (14.29%) 434,537 node-store-misses (7.14%) 65,709 node-stores (7.14%) 18.603323495 seconds time elapsed 18.525904000 seconds user 0.015197000 seconds sys |
鲲鹏920
耗时24.6秒, IPC 1.84
| 1 2 3 4 5 6 7 8 9 10 11 12 13 14 15 16 17 18 19 20 21 22 23 24 25 26 27 | #perf stat -e branch-misses,bus-cycles,cache-misses,cache-references,cpu-cycles,instructions,stalled-cycles-backend,stalled-cycles-frontend,L1-dcache-load-misses,L1-dcache-loads,L1-dcache-store-misses,L1-dcache-stores,L1-icache-load-misses,L1-icache-loads,branch-load-misses,branch-loads,dTLB-load-misses,dTLB-loads,iTLB-load-misses,iTLB-loads -- bash -c 'echo "7^999999" | bc > /dev/null' Performance counter stats for 'bash -c echo "7^999999" | bc > /dev/null': 1,467,769,425 branch-misses (59.94%) 63,866,536,853 bus-cycles (59.94%) 6,571,273 cache-misses # 0.021 % of all cache refs (59.94%) 30,768,754,927 cache-references (59.96%) 63,865,354,560 cpu-cycles (64.97%) 117,790,453,518 instructions # 1.84 insns per cycle # 0.07 stalled cycles per insn (64.98%) 833,090,930 stalled-cycles-backend # 1.30% backend cycles idle (65.00%) 7,918,227,782 stalled-cycles-frontend # 12.40% frontend cycles idle (65.01%) 6,962,902 L1-dcache-load-misses # 0.02% of all L1-dcache hits (65.03%) 30,804,266,645 L1-dcache-loads (65.05%) 6,960,157 L1-dcache-store-misses (65.06%) 30,807,954,068 L1-dcache-stores (65.06%) 1,012,171 L1-icache-load-misses (65.06%) 45,256,066,296 L1-icache-loads (65.04%) 1,470,467,198 branch-load-misses (65.03%) 27,108,794,972 branch-loads (65.01%) 475,707 dTLB-load-misses # 0.00% of all dTLB cache hits (65.00%) 35,159,826,836 dTLB-loads (59.97%) 912 iTLB-load-misses # 0.00% of all iTLB cache hits (59.96%) 45,325,885,822 iTLB-loads (59.94%) 24.604603640 seconds time elapsed |
海光
耗时 26.73秒, IPC 0.92
| 1 2 3 4 5 6 7 8 9 10 11 12 13 14 15 16 17 18 19 20 21 22 23 24 25 | sudo perf stat -e branch-instructions,branch-misses,cache-references,cpu-cycles,instructions,stalled-cycles-backend,stalled-cycles-frontend,L1-dcache-load-misses,L1-dcache-loads,L1-dcache-prefetches,L1-icache-load-misses,L1-icache-loads,branch-load-misses,branch-loads,dTLB-load-misses,dTLB-loads,iTLB-load-misses,iTLB-loads -a -- bash -c 'echo "7^999999" | bc > /dev/null' Performance counter stats for 'system wide': 57,795,675,025 branch-instructions (27.78%) 2,459,509,459 branch-misses # 4.26% of all branches (27.78%) 12,171,133,272 cache-references (27.79%) 317,353,262,523 cpu-cycles (27.79%) 293,162,940,548 instructions # 0.92 insn per cycle # 0.19 stalled cycles per insn (27.79%) 55,152,807,029 stalled-cycles-backend # 17.38% backend cycles idle (27.79%) 44,410,732,991 stalled-cycles-frontend # 13.99% frontend cycles idle (27.79%) 4,065,273,083 L1-dcache-load-misses # 3.58% of all L1-dcache hits (27.79%) 113,699,208,151 L1-dcache-loads (27.79%) 1,351,513,191 L1-dcache-prefetches (27.79%) 2,091,035,340 L1-icache-load-misses # 4.43% of all L1-icache hits (27.79%) 47,240,289,316 L1-icache-loads (27.79%) 2,459,838,728 branch-load-misses (27.79%) 57,855,156,991 branch-loads (27.78%) 69,731,473 dTLB-load-misses # 20.40% of all dTLB cache hits (27.78%) 341,773,319 dTLB-loads (27.78%) 26,351,132 iTLB-load-misses # 15.91% of all iTLB cache hits (27.78%) 165,656,863 iTLB-loads (27.78%) 26.729972414 seconds time elapsed |
飞腾
| 1 2 3 4 5 6 7 8 9 10 11 12 13 14 15 16 17 18 19 20 21 22 23 24 25 26 | time perf stat -e branch-misses,bus-cycles,cache-misses,cache-references,cpu-cycles,instructions,L1-dcache-load-misses,L1-dcache-loads,L1-dcache-store-misses,L1-dcache-stores,L1-icache-load-misses,L1-icache-loads,branch-load-misses,branch-loads,dTLB-load-misses,iTLB-load-misses -a -- bash -c 'echo "7^999999" | bc > /dev/null' Performance counter stats for 'system wide': 2552812813 branch-misses (38.08%) 602038279874 bus-cycles (37.54%) 1742826523 cache-misses # 2.017 % of all cache refs (37.54%) 86400294181 cache-references (37.55%) 612467194375 cpu-cycles (43.79%) 263691445872 instructions # 0.43 insns per cycle (43.79%) 1706247569 L1-dcache-load-misses # 2.00% of all L1-dcache hits (43.78%) 85122454139 L1-dcache-loads (43.77%) 1711243358 L1-dcache-store-misses (39.38%) 86288158984 L1-dcache-stores (37.52%) 2006641212 L1-icache-load-misses (37.51%) 146380907111 L1-icache-loads (37.51%) 2560208048 branch-load-misses (37.52%) 63127187342 branch-loads (41.38%) 768494735 dTLB-load-misses (43.77%) 124424415 iTLB-load-misses (43.77%) 39.654819568 seconds time elapsed real 0m39.763s user 0m39.635s sys 0m0.127s |
perf 数据对比
Intel
intel的cpu随着线程的增加,ipc稳定减少,但不是线性的
海光
如下数据可以看到在用满32个物理core之前,ipc保持稳定,超过32core后随着并发增加ipc相应减少,性能再也上不去了。
鲲鹏920
可以看到鲲鹏920多核跑openssl是没有什么争抢的,所以还能保证完全线性
小结
intel的流水线适合跑高带宽应用,不适合跑密集计算应用,也就是intel的pipeline数量少,但是内存读写上面优化好,乱序优化好。跑纯计算,不是intel的强项。
数据库场景下鲲鹏920大概相当于X86的70%的能力
prime计算一般走的fpu,不走cpu
intel x86 cpu bound和memory bond数据
测试代码
| 1 2 3 4 5 6 7 8 9 10 11 12 13 14 15 16 17 18 19 20 21 22 23 24 25 26 27 28 29 30 31 | #include <stdlib.h> #include <emmintrin.h> #include <stdio.h> #include <signal.h> char a = 1; void memory_bound() { register unsigned i=0; register char b; for (i=0;i<(1u<<24);i++) { // evict cacheline containing a _mm_clflush(&a); b = a; } } void cpu_bound() { register unsigned i=0; for (i=0;i<(1u<<31);i++) { __asm__ ("nop\nnop\nnop"); } } int main() { int i=0; for(i=0;i<10; ++i){ //cpu_bound(); memory_bound(); } return 0; } |
测试结果
cpu_bound部分飞腾只有intel性能的30%
如下测试perf数据可以看到IPC的明显差异
| 1 2 3 4 5 6 7 8 9 10 11 12 13 14 15 16 17 18 19 20 21 22 23 24 25 26 27 28 29 30 31 32 33 34 35 36 37 38 39 40 41 42 43 44 45 46 47 48 49 50 51 52 53 54 55 56 57 58 59 60 61 62 63 64 65 66 67 68 69 | # sudo perf stat -e branch-instructions,branch-misses,bus-cycles,cache-misses,cache-references,cpu-cycles,instructions,ref-cycles,L1-dcache-load-misses,L1-dcache-loads,L1-dcache-stores,L1-icache-load-misses,LLC-load-misses,LLC-loads,LLC-store-misses,LLC-stores,branch-load-misses,branch-loads,dTLB-load-misses,dTLB-loads,dTLB-store-misses,dTLB-stores,iTLB-load-misses,iTLB-loads,node-load-misses,node-loads,node-store-misses,node-stores -a ./memory_bound Performance counter stats for 'system wide': 36,162,872,212 branch-instructions (14.21%) 586,644,153 branch-misses # 1.62% of all branches (12.95%) 4,632,787,085 bus-cycles (14.40%) 476,189,785 cache-misses # 17.714 % of all cache refs (14.38%) 2,688,284,129 cache-references (14.35%) 258,946,713,506 cpu-cycles (17.93%) 181,069,328,200 instructions # 0.70 insn per cycle (21.51%) 456,889,428,341 ref-cycles (22.31%) 3,928,434,098 L1-dcache-load-misses # 7.46% of all L1-dcache hits (14.21%) 52,656,559,902 L1-dcache-loads (14.31%) 26,711,751,387 L1-dcache-stores (14.30%) 2,618,739,340 L1-icache-load-misses (18.05%) 154,326,888 LLC-load-misses # 8.60% of all LL-cache hits (19.84%) 1,795,112,198 LLC-loads (9.81%) 66,802,375 LLC-store-misses (10.19%) 206,810,811 LLC-stores (11.16%) 586,120,789 branch-load-misses (14.28%) 36,121,237,395 branch-loads (14.29%) 114,927,298 dTLB-load-misses # 0.22% of all dTLB cache hits (14.29%) 52,902,163,128 dTLB-loads (14.29%) 7,010,297 dTLB-store-misses (14.29%) 26,587,353,417 dTLB-stores (18.00%) 106,209,281 iTLB-load-misses # 174.17% of all iTLB cache hits (19.33%) 60,978,626 iTLB-loads (21.53%) 117,197,042 node-load-misses (19.71%) 35,764,508 node-loads (11.65%) 57,655,994 node-store-misses (7.80%) 11,563,328 node-stores (9.45%) 16.700731355 seconds time elapsed # sudo perf stat -e branch-instructions,branch-misses,bus-cycles,cache-misses,cache-references,cpu-cycles,instructions,ref-cycles,L1-dcache-load-misses,L1-dcache-loads,L1-dcache-stores,L1-icache-load-misses,LLC-load-misses,LLC-loads,LLC-store-misses,LLC-stores,branch-load-misses,branch-loads,dTLB-load-misses,dTLB-loads,dTLB-store-misses,dTLB-stores,iTLB-load-misses,iTLB-loads,node-load-misses,node-loads,node-store-misses,node-stores -a ./cpu_bound Performance counter stats for 'system wide': 43,013,055,562 branch-instructions (14.33%) 436,722,063 branch-misses # 1.02% of all branches (11.58%) 3,154,327,457 bus-cycles (14.31%) 306,977,772 cache-misses # 17.837 % of all cache refs (14.42%) 1,721,062,233 cache-references (14.39%) 176,119,834,487 cpu-cycles (17.98%) 276,038,539,571 instructions # 1.57 insn per cycle (21.55%) 309,334,354,268 ref-cycles (22.31%) 2,551,915,790 L1-dcache-load-misses # 6.78% of all L1-dcache hits (13.12%) 37,638,319,334 L1-dcache-loads (14.32%) 19,132,537,445 L1-dcache-stores (15.73%) 1,834,976,400 L1-icache-load-misses (18.90%) 131,307,343 LLC-load-misses # 11.46% of all LL-cache hits (19.94%) 1,145,964,874 LLC-loads (16.60%) 45,561,247 LLC-store-misses (8.11%) 140,236,535 LLC-stores (9.60%) 423,294,349 branch-load-misses (14.27%) 46,645,623,485 branch-loads (14.28%) 73,377,533 dTLB-load-misses # 0.19% of all dTLB cache hits (14.28%) 37,905,428,246 dTLB-loads (15.69%) 4,969,973 dTLB-store-misses (17.21%) 18,729,947,580 dTLB-stores (19.71%) 72,073,313 iTLB-load-misses # 167.86% of all iTLB cache hits (20.60%) 42,935,532 iTLB-loads (19.16%) 112,306,453 node-load-misses (15.35%) 37,239,267 node-loads (7.44%) 37,455,335 node-store-misses (10.00%) 8,134,155 node-stores (8.87%) 10.838808208 seconds time elapsed |
飞腾
ipc 大概是intel的30%,加上主频也要差一些,
| 1 2 3 4 5 6 7 8 9 10 11 12 13 14 15 16 17 18 19 20 21 22 23 24 25 26 | #time perf stat -e branch-misses,bus-cycles,cache-misses,cache-references,cpu-cycles,instructions,L1-dcache-load-misses,L1-dcache-loads,L1-dcache-store-misses,L1-dcache-stores,L1-icache-load-misses,L1-icache-loads,branch-load-misses,branch-loads,dTLB-load-misses,iTLB-load-misses -a ./cpu_bound Performance counter stats for 'system wide': 10496356859 branch-misses (37.60%) 2813170983911 bus-cycles (37.58%) 17604745519 cache-misses # 3.638 % of all cache refs (37.55%) 483878256161 cache-references (37.54%) 2818545529083 cpu-cycles (43.78%) 1280497827941 instructions # 0.45 insns per cycle (43.78%) 17623592806 L1-dcache-load-misses # 3.65% of all L1-dcache hits (43.78%) 482429613337 L1-dcache-loads (41.83%) 17604561232 L1-dcache-store-misses (37.53%) 484126081882 L1-dcache-stores (37.52%) 17774514325 L1-icache-load-misses (37.50%) 641046300400 L1-icache-loads (37.50%) 10574973722 branch-load-misses (39.45%) 273851009656 branch-loads (43.76%) 9457594390 dTLB-load-misses (43.77%) 1813954093 iTLB-load-misses (43.77%) 31.172754504 seconds time elapsed real 0m31.284s user 0m31.096s sys 0m0.165s |
unixBench 5.1.3 性能对比
测试命令: ./Run -c 1 -c 4
| 芯片 | 架构 | 逻辑核数 | 单核能力 | 4核能力 | 单核比值 | 4核比值 | 整机对比 |
|---|---|---|---|---|---|---|---|
| Intel 4114 | x86 | 40 | 1150 | 3095 | 100% | 100% | 100% |
| 海光 7165 | x86 | 48 | 1586 | 2533 | 138% | 82% | 98% |
| 华为鲲鹏920 | arm | 96 | 1168 | 2066 | 102% | 67% | 160% |
| 飞腾2000 | arm | 64 | 731 | 1902 | 64% | 61% | 98% |
| 申威1621 | alpha | 16 | 445 | 1065 | 39% | 34% | 14% |
以上CPU除了Intel,其它都没有HT,也就是Intel 4114实际是20个物理核。以上数据来自ata,仅供参考
ARM 和 X86的总结
对比硬件:
ARM:泰山ARM 双路 128核心64核心/路),2.5G,4指令/周期,8个内存通道/路,mips体系架构。
X86: intel 8163服务器 双路 48核心(24核心/路),2.5GHZ, 6指令/周期,96smt, 6个内存通道
用 Geabase(C++) 测试所得 ARM是X86 性能的1.36倍,接近理论值的1.4倍
理论值的计算公式:
CPU性能验证公式:频率 x 核数 x 发射数/周期 x 1.3/1.5(smt2/smt4) (smt是指超线程数量)
ARM 优势的来源主要是工艺领先一代(7nm VS 14nm)
总结
- 对纯CPU 运算场景,并发不超过物理core时,比如Prime运算,比如DRDS(CPU bound,IO在网络,可以加并发弥补)
- 海光的IPC能保持稳定;
- intel的IPC有所下降,但是QPS在IPC下降后还能完美线性
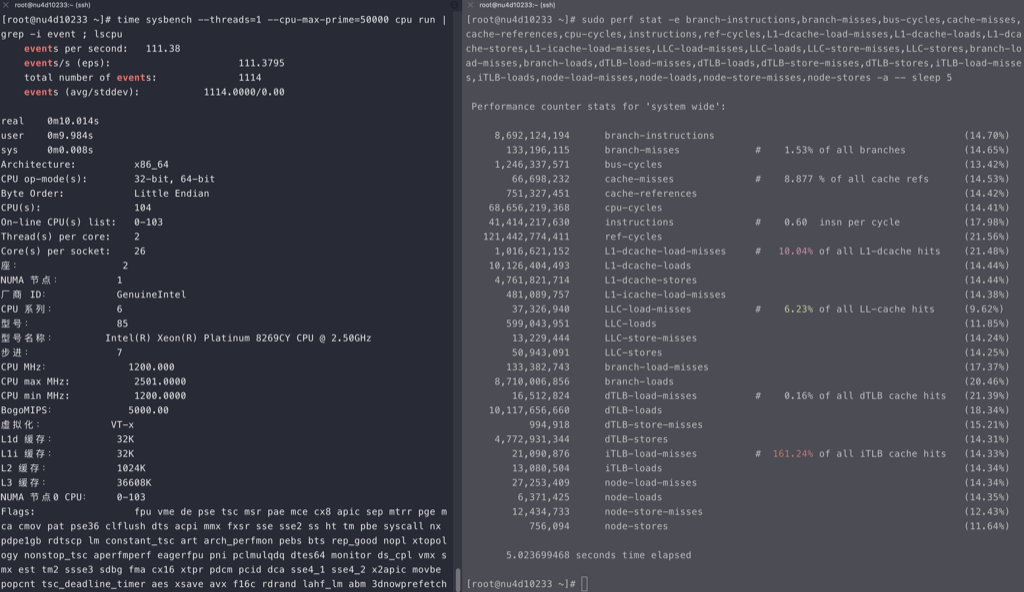
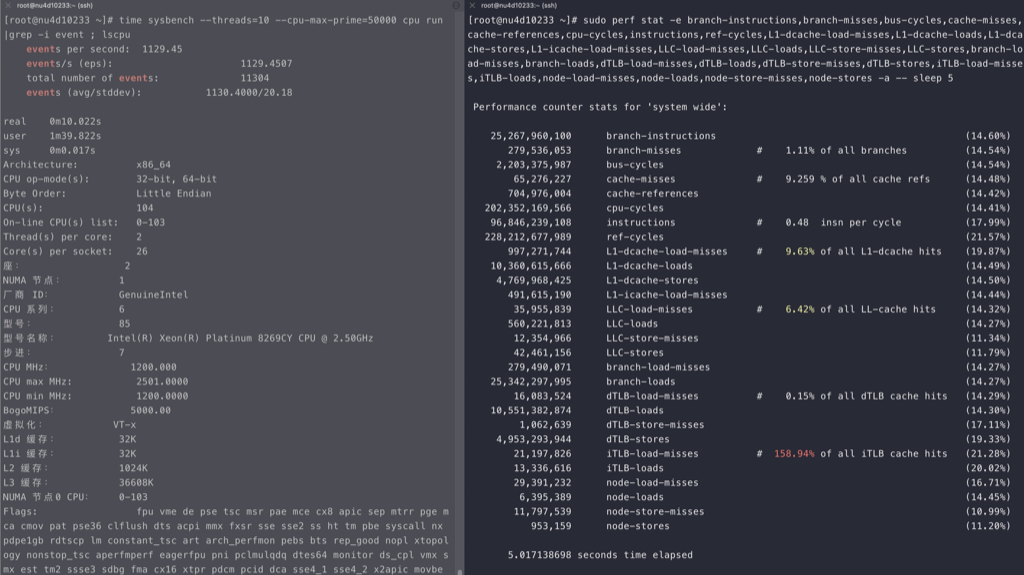
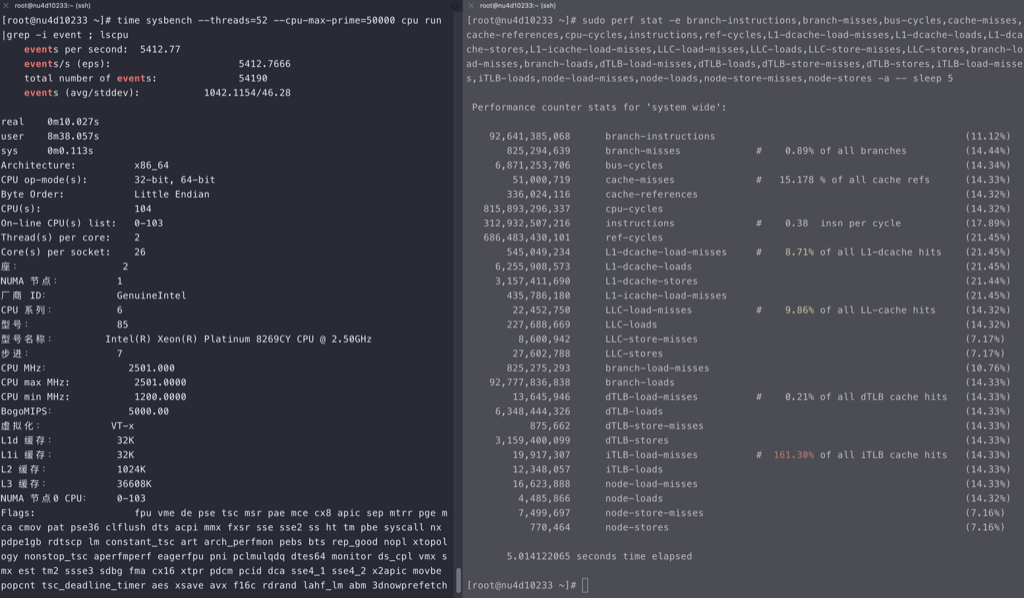
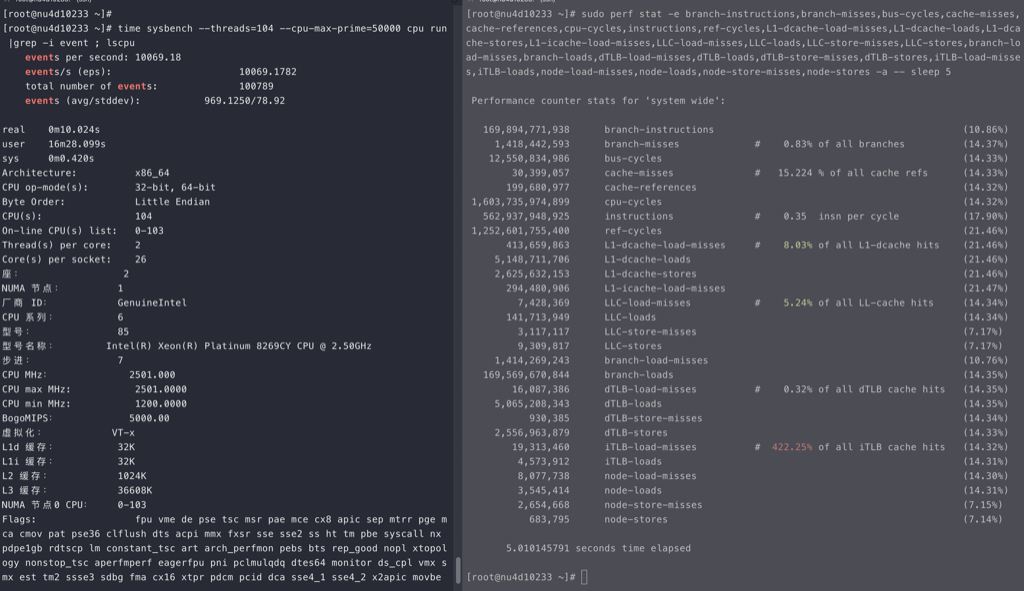
- 在openssl和MySQL oltp_read_only场景下
- 如果并发没超过物理core数时,海光和Intel都能随着并发的翻倍性能能增加80%
- 如果并发超过物理core数后,Intel还能随着并发的翻倍性能增加50%,海光增加就只有20%了
- 简单理解在这两个场景下Intel的HT能发挥半个物理core的作用,海光的HT就只能发挥0.2个物理core的作用了
- 海光zen1的AMD 架构,每个core只有一个fpu,综上在多个场景下HT基本上都可以忽略
- 飞腾2500性能比较差
- 国产CPU:飞腾、鲲鹏、龙芯、申威、海光(AMD授权)、兆芯(威盛via 授权x86)
- CPU性能验证公式:频率 x 核数 x 发射数/周期 x 1.3/1.5(smt2/smt4) (smt是指超线程数量)
- 大吞吐量计算由多核CPU数量决定,多核CPU数量由制程工艺决定,制程工艺由资本决定,制程工艺资本由主流消费电子决定, 摩尔定律仍在持续。