First steps 2: 添加和自定义渲染器
在之前的入门指南中,你使用了Bokeh的figure()函数来绘制折线图。
在本节中,你将使用不同的渲染函数来创建各种其他类型的图表。你还将自定义你的图像外观。
渲染不同的图形符号
Bokeh的绘图界面支持多种不同的图形符号,如线条、条形图、六边形瓦片或其他多边形。
所有支持的图形符号方法的完整列表可在Bokeh的figure()函数参考指南中找到。有关Bokeh图形符号的详细信息,请参阅Bokeh用户指南中的基本绘图部分。
渲染圆形
使用circle()函数代替line()函数来渲染圆形:
p.scatter(x, y3, legend_label="Objects", color="yellow", size=12)
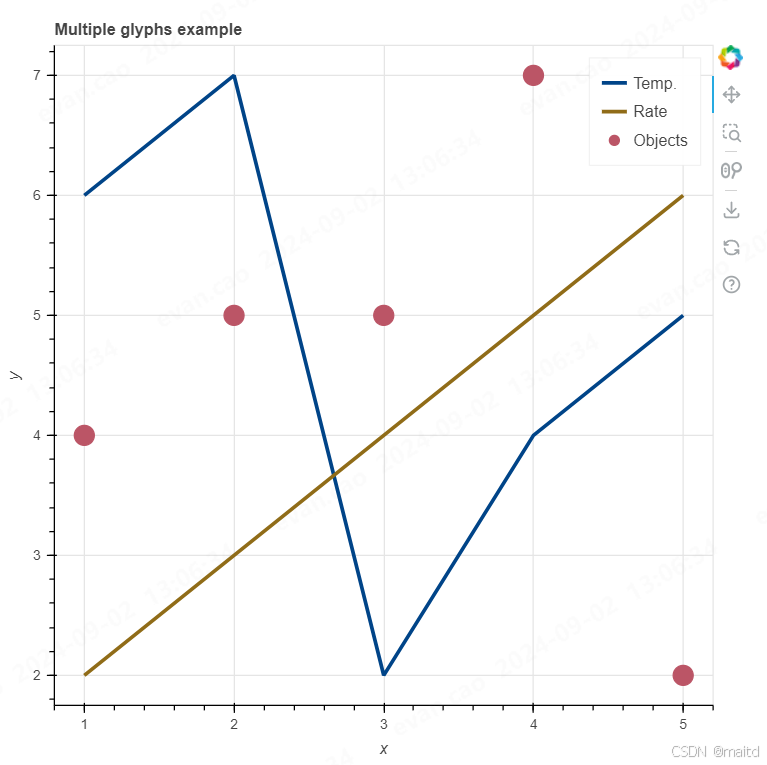
将之前可视化中的一个line()函数替换为circle()函数,以创建圆形图:
from bokeh.plotting import figure, show

# prepare some data
x = [1, 2, 3, 4, 5]
y1 = [6, 7, 2, 4, 5]
y2 = [2, 3, 4, 5, 6]
y3 = [4, 5, 5, 7, 2]

# create a new plot with a title and axis labels
p = figure(title="Multiple glyphs example", x_axis_label="x", y_axis_label="y")

# add multiple renderers
p.line(x, y1, legend_label="Temp.", color="#004488", line_width=3)
p.line(x, y2, legend_label="Rate", color="#906c18", line_width=3)
p.scatter(x, y3, legend_label="Objects", color="#bb5566", size=16)

# show the results
show(p)
渲染条形图
同样地,使用vbar()函数渲染垂直条形图:
p.vbar(x=x, top=y2, legend_label="Rate", width=0.5, bottom=0, color="red")
将vbar()函数添加到你之前的可视化中:

另见
要了解更多关于条形图以及Bokeh处理分类数据的其他方法,请参阅用户指南中的条形图部分。
自定义图形符号
不同的渲染函数接受各种参数来控制图形符号的外观。
定义新图形符号的属性
例如,circle()函数让你定义圆形的颜色或直径等:
- fill_color:圆形的填充颜色
- fill_alpha:填充颜色的透明度(0到1之间的任何值)
- line_color:圆形轮廓的颜色
- size:圆形的大小(单位为像素或点)
- legend_label:圆形的图例标签
请注意,在之前的例子中,你使用color属性来定义对象的颜色。color是一个别名,可自动将对象的所有颜色属性设置为相同的颜色。例如,将“yellow”传递给圆形的color属性,与单独设置fill_color和line_color为黄色是一样的。
在Bokeh中,你可以通过几种方式设置颜色。例如:
- 使用命名颜色(例如,“firebrick”)
- 使用带#前缀的十六进制值(例如,“#00ff00”)
- 使用表示RGB颜色的3元组(例如,(100, 100, 255))
- 使用表示RGBA颜色的4元组(例如,(100, 100, 255, 0.5))
创建带有图例标签“Objects”的圆形,并使圆形填充颜色为红色、轮廓颜色为蓝色且略微透明:
p.circle(x, y, legend_label="Objects", fill_color="red", fill_alpha=0.6, line_color="blue")
from bokeh.plotting import figure, show

# prepare some data
x = [1, 2, 3, 4, 5]
y = [4, 5, 5, 7, 2]

# create a new plot with a title and axis labels
p = figure(title="Glyphs properties example", x_axis_label="x", y_axis_label="y")

# add circle renderer with additional arguments
p.scatter(
    x,
    y,
    marker="circle",
    size=80,
    legend_label="Objects",
    fill_color="red",
    fill_alpha=0.5,
    line_color="blue",
)

# show the results
show(p)
更改现有图形符号的属性
如果在创建对象后想要更改任何属性,可以直接定义和覆盖对象的属性。
以以上的圆形为例。你通过传递参数fill_color="red"定义圆形为红色。
要将你的圆形颜色从红色改为蓝色,你首先需要在调用circle()函数时为新的对象分配一个变量名(例如scatter)。
scatter = p.scatter(
    marker="circle",
    x=x,
    y=y,
    size=80,
    legend_label="Objects",
    fill_color="red",
    fill_alpha=0.5,
    line_color="blue",
)
接下来,使用该变量访问对象的glyph属性并更改其属性:
glyph = scatter.glyph
glyph.fill_color = "blue"
再次生成红色圆形,但这次在输出图形之前将其颜色更改为蓝色:
from bokeh.plotting import figure, show

p = figure()

# 创建红色圆形
scatter = p.circle(
    x=[1, 2, 3, 4, 5],
    y=[6, 7, 2, 4, 5],
    size=80,
    legend_label="Objects",
    fill_color="red",
    fill_alpha=0.5,
    line_color="blue",
)

# 更改颜色为蓝色
scatter.glyph.fill_color = "blue"

show(p)
另见
有关各种视觉属性的更多信息,请参阅用户指南中的样式化图形符号和通用视觉属性部分。
每种类型的图形符号都有不同的属性。请参阅参考指南中的figure()以查看每种图形符号方法的所有可用属性。
First steps 3: 添加图例、文本和注释
在之前的第一步指南中,你生成了不同的图形符号并定义了它们的外观。
在本节中,你将添加和样式化一个图例和一个标题。你还将通过包括注释来为你的绘图添加额外的信息。
添加和样式化图例
在调用渲染函数时,如果包括了legend_label属性,Bokeh会自动将图例添加到你的绘图中。例如:
p.circle(x, y3, legend_label="Objects")
这将在你的绘图中添加一个带有“Objects”条目的图例。
使用Legend对象的属性可以自定义图例。例如:
from bokeh.plotting import figure, show
from bokeh.models import Legend

# 创建数据
x = [1, 2, 3, 4, 5]
y1 = [6, 7, 2, 4, 5]
y2 = [2, 3, 4, 6, 7]
y3 = [4, 5, 5, 7, 8]

# 创建绘图
p = figure(title="My Plot")

# 添加圆形图
p.circle(x, y3, legend_label="Objects", size=10, fill_color="red", fill_alpha=0.6, line_color="blue")

# 自定义图例
p.legend.title = 'Legend Title'
p.legend.label_text_font_size = '12pt'
p.legend.background_fill_color = 'lightgray'
p.legend.background_fill_alpha = 0.5
p.legend.border_line_color = 'black'
p.legend.border_line_width = 1

show(p)
这个示例会为你的绘图添加一个带有标题“Legend Title”的图例,并自定义其外观。你可以调整图例的背景颜色、字体大小、边框等属性。

另见
要了解更多关于图例的内容,请参阅用户指南中的[图例](https://docs.bokeh.org/en/latest/docs/user_guide/basic/annotations.html#ug-basic-annotations-legends)部分和[样式化图例](https://docs.bokeh.org/en/latest/docs/user_guide/styling/plots.html#ug-styling-plots-legends)部分。参考指南中的Legend条目包含了图例的所有可用属性列表。
参阅用户指南中的[交互式图例](https://docs.bokeh.org/en/latest/docs/user_guide/interaction/legends.html#ug-interaction-legends)以了解如何使用图例隐藏
定制标题
到目前为止,大多数示例都包含了标题。这是通过将title参数传递给figure()函数实现的:
p = figure(title="Headline example")
有多种方式可以设置标题文本的样式。例如:
from bokeh.plotting import figure, show

# 创建绘图并添加标题
p = figure(title="My Custom Headline")

# 定制标题样式
p.title.text_color = "navy"
p.title.text_font = "times"
p.title.text_font_style = "italic"
p.title.text_font_size = "16pt"
p.title.align = "center"
p.title.background_fill_color = "beige"

show(p)
这个示例将创建一个包含自定义样式标题的绘图。你可以调整标题的颜色、字体、字体样式、字体大小、对齐方式和背景填充颜色等属性。

另见
有关使用标题的更多信息,请参阅用户指南中的标题部分。在参考指南中,Title条目包含了所有可用属性的列表
使用注释
注释是你添加到绘图中的视觉元素,使其更易于阅读。有关各种注释的更多信息,请参阅用户指南中的注释部分。
一个例子是矩形注释。你可以使用矩形注释来突出绘图中的某些区域:

要向绘图中添加矩形注释,首先需要从bokeh.models导入BoxAnnotation类:
from bokeh.models import BoxAnnotation
接下来,创建BoxAnnotation对象。如果未为bottom或top传递值,Bokeh会自动将矩形的维度扩展到绘图的边缘:
low_box = BoxAnnotation(top=20, fill_alpha=0.2, fill_color="#F0E442")
mid_box = BoxAnnotation(bottom=20, top=80, fill_alpha=0.2, fill_color="#009E73")
high_box = BoxAnnotation(bottom=80, fill_alpha=0.2, fill_color="#F0E442")
最后,你需要将BoxAnnotation对象添加到现有的figure中。使用add_layout()方法添加你的矩形:
p.add_layout(low_box)
p.add_layout(mid_box)
p.add_layout(high_box)
完成的代码如下所示:
import random
from bokeh.models import BoxAnnotation
from bokeh.plotting import figure, show

# 生成一些数据(1-50作为x,随机值作为y)
x = list(range(0, 51))
y = random.sample(range(0, 100), 51)

# 创建新绘图
p = figure(title="Box annotation example")

# 添加线条渲染器
line = p.line(x, y, line_color="#000000", line_width=2)

# 添加矩形注释
low_box = BoxAnnotation(top=20, fill_alpha=0.2, fill_color="#F0E442")
mid_box = BoxAnnotation(bottom=20, top=80, fill_alpha=0.2, fill_color="#009E73")
high_box = BoxAnnotation(bottom=80, fill_alpha=0.2, fill_color="#F0E442")

# 将矩形添加到现有绘图中
p.add_layout(low_box)
p.add_layout(mid_box)
p.add_layout(high_box)

# 显示结果
show(p)
另见
要了解Bokeh中不同种类的注释,请参阅用户指南中的注释部分。
First steps 4::定制你的绘图
在前面的第一步指南中,你生成了不同的图形符号并添加了更多信息,如标题、图例和注释。
在本节中,你将整体定制绘图的外观。这包括调整大小、改变线条和颜色,以及定制坐标轴和工具。
使用主题
借助Bokeh的主题,你可以快速改变绘图的外观。主题是一组预定义的设计参数,如颜色、字体或线条样式。
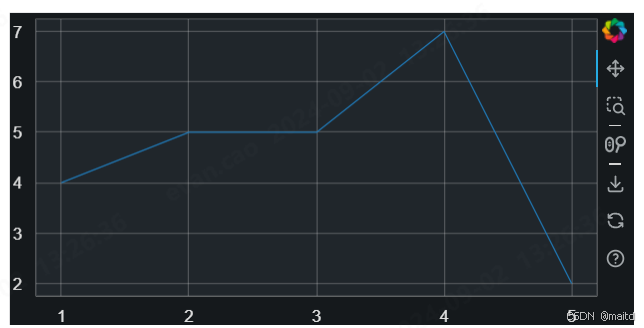
Bokeh自带五个内置主题:caliber、dark_minimal、light_minimal、night_sky和contrast。此外,你还可以定义自己的自定义主题。
要使用其中一个内置主题,将你想使用的主题名称分配给文档的theme属性:
from bokeh.io import curdoc
from bokeh.plotting import figure, show

# 准备一些数据
x = [1, 2, 3, 4, 5]
y = [4, 5, 5, 7, 2]

# 将主题应用到当前文档
curdoc().theme = "dark_minimal"

# 创建绘图
p = figure(sizing_mode="stretch_width", max_width=500, height=250)

# 添加渲染器
p.line(x, y)

# 显示结果
show(p)
你也可以创建自己的主题,以在多个绘图中使用。Bokeh的主题可以是YAML或JSON格式。要了解更多关于创建和使用自定义主题的信息,请参阅用户指南中的创建自定义主题部分。
另见
有关在Bokeh中使用主题的更多信息,请参阅用户指南中的使用主题部分和参考指南中的bokeh.themes部分。
调整绘图大小
Bokeh 的 Plot 对象具有各种属性,这些属性会影响绘图的外观。
设置宽度和高度
要设置绘图的尺寸,可以在调用 figure() 函数时使用 width 和 height 属性:
from bokeh.plotting import figure, show

# 准备一些数据
x = [1, 2, 3, 4, 5]
y = [4, 5, 5, 7, 2]

# 创建一个具有特定大小的新绘图
p = figure(
    title="Plot sizing example",
    width=350,
    height=250,
    x_axis_label="x",
    y_axis_label="y",
)

# 添加散点渲染器
p.scatter(x, y, fill_color="red", size=15)

# 显示结果
show(p)
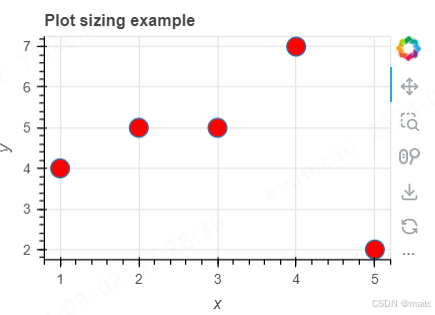
与更改现有图形符号的设计类似,您可以在创建绘图后随时更改其属性:
from bokeh.plotting import figure, show

# 准备一些数据
x = [1, 2, 3, 4, 5]
y = [4, 5, 5, 7, 2]

# 创建一个具有特定大小的新绘图
p = figure(
    title="Plot resizing example",
    width=350,
    height=250,
    x_axis_label="x",
    y_axis_label="y",
)

# 改变绘图大小
p.width = 450
p.height = 150

# 添加散点渲染器
p.scatter(x, y, fill_color="red", size=15)

# 显示结果
show(p)

启用响应式绘图大小
要使绘图自动调整到浏览器或屏幕大小,可以使用 sizing_mode 属性:
from bokeh.plotting import figure, show

# 准备一些数据
x = [1, 2, 3, 4, 5]
y = [4, 5, 5, 7, 2]

# 创建一个具有响应式宽度的新绘图
p = figure(
    title="Plot responsive sizing example",
    sizing_mode="stretch_width",
    height=250,
    x_axis_label="x",
    y_axis_label="y",
)

# 添加散点渲染器
p.scatter(x, y, fill_color="red", size=15)

# 显示结果
show(p)
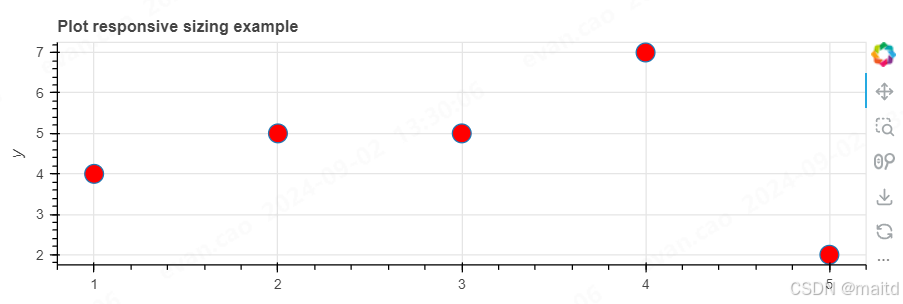
另见
要了解更多有关如何控制绘图大小的信息,请参阅用户指南中的样式化绘图部分和参考指南中的
Plot
条目。
有关响应式大小调整的更多信息,请参阅用户指南中的大小模式部分和参考指南中的
sizing_mode条目。
自定义坐标轴
你可以设置各种属性来改变绘图中坐标轴的工作方式和外观。
设置坐标轴的外观
自定义绘图外观的选项包括:
- 设置坐标轴标签
- 样式化坐标轴上的数字
- 定义坐标轴本身的颜色和其他布局属性
例如:
from bokeh.plotting import figure, show

# 准备一些数据
x = [1, 2, 3, 4, 5]
y = [4, 5, 5, 7, 2]

# 创建绘图
p = figure(
    title="Customized axes example",
    sizing_mode="stretch_width",
    max_width=500,
    height=350,
)

# 添加渲染器
p.scatter(x, y, size=10)

# 修改一些关于 x 轴的设置
p.xaxis.axis_label = "Temp"
p.xaxis.axis_line_width = 3
p.xaxis.axis_line_color = "red"

# 修改一些关于 y 轴的设置
p.yaxis.axis_label = "Pressure"
p.yaxis.major_label_text_color = "orange"
p.yaxis.major_label_orientation = "vertical"

# 修改所有坐标轴的设置
p.axis.minor_tick_in = -3
p.axis.minor_tick_out = 6

# 显示结果
show(p)
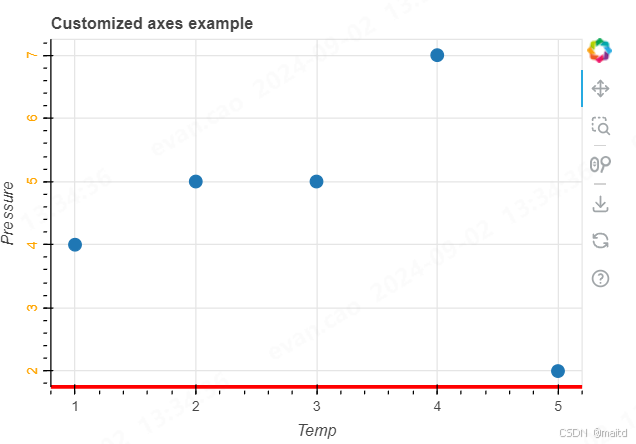
以上代码示例展示了如何自定义坐标轴的标签、线条宽度、颜色、标签颜色等属性。
另见
要了解更多关于自定义绘图坐标轴的信息,请参阅用户指南和参考指南中的相应部分
定义坐标轴范围
在绘制坐标轴时,Bokeh会自动确定每个坐标轴需要覆盖的范围,以便显示所有值。例如,如果y轴上的值在2到17之间,Bokeh会自动创建一个y轴,其范围略低于2和略高于17。
要手动定义坐标轴范围,可以在调用figure()函数时使用 y_range 属性或 x_range 属性:
from bokeh.plotting import figure, show

# 准备一些数据
x = [1, 2, 3, 4, 5]
y = [4, 5, 5, 7, 2]

# 创建一个具有响应式宽度的新绘图
p = figure(
    y_range=(0, 25),  # 手动设置y轴范围
    title="Axis range example",
    sizing_mode="stretch_width",
    max_width=500,
    height=250,
)

# 添加散点渲染器
p.scatter(x, y, size=8)

# 显示结果
show(p)
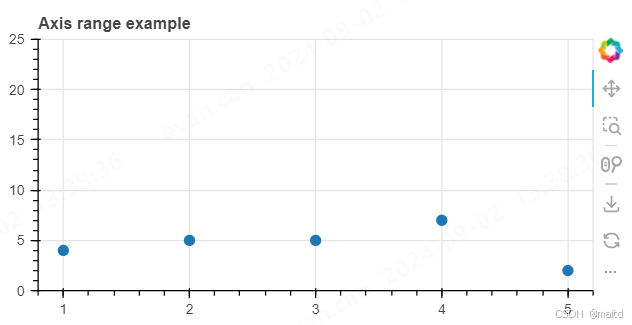
通过以上代码,你可以手动设置y轴的范围为0到25。你也可以使用类似的方法来设置x轴的范围。
格式化坐标轴刻度
你可以使用 Bokeh 的 TickFormatter 对象来格式化坐标轴旁边显示的文本。例如,可以在y轴上显示货币符号。
使用 NumeralTickFormatter 来在y轴上显示美元金额:
示例代码
首先,从 bokeh.models 导入 NumeralTickFormatter:
from bokeh.models import NumeralTickFormatter
然后,在用 figure() 函数创建绘图之后,将 NumeralTickFormatter 分配给绘图的 y 轴的格式化器属性:
p.yaxis[0].formatter = NumeralTickFormatter(format="$0.00")
以下是完整的代码示例:
from bokeh.models import NumeralTickFormatter
from bokeh.plotting import figure, show

# 准备一些数据
x = [1, 2, 3, 4, 5]
y = [4, 5, 5, 7, 2]

# 创建新绘图
p = figure(
    title="Tick formatter example",
    sizing_mode="stretch_width",
    max_width=500,
    height=250,
)

# 格式化 y 轴刻度
p.yaxis[0].formatter = NumeralTickFormatter(format="$0.00")

# 添加渲染器
p.scatter(x, y, size=8)
p.line(x, y, color="navy", line_width=1)

# 显示结果
show(p)
通过上述代码,你可以将y轴上的刻度格式化为显示美元金额,如 “$7.42”。
另见 有关格式化刻度的更多信息,请参阅用户指南中的 Tick label
formats。欲了解可用的所有刻度格式化器列表,请参见参考指南中的
formatters。
启用对数坐标轴
你还可以更改坐标轴类型。使用 y_axis_type="log" 来切换到对数坐标轴:
示例代码
from bokeh.plotting import figure, show

# 准备一些数据
x = [0.1, 0.5, 1.0, 1.5, 2.0, 2.5, 3.0]
y0 = [i**2 for i in x]
y1 = [10**i for i in x]
y2 = [10**(i**2) for i in x]

# 创建一个具有对数坐标轴的新绘图
p = figure(
    title="Logarithmic axis example",
    sizing_mode="stretch_width",
    height=300,
    max_width=500,
    y_axis_type="log",  # 对数坐标轴
    y_range=[0.001, 10 ** 11],  # 设置 y 轴范围
    x_axis_label="sections",  # x 轴标签
    y_axis_label="particles",  # y 轴标签
)

# 添加一些渲染器
p.line(x, x, legend_label="y=x")
p.scatter(x, x, legend_label="y=x", fill_color="white", size=8)
p.line(x, y0, legend_label="y=x^2", line_width=3)
p.line(x, y1, legend_label="y=10^x", line_color="red")
p.scatter(x, y1, legend_label="y=10^x", fill_color="red", line_color="red", size=6)
p.line(x, y2, legend_label="y=10^x^2", line_color="orange", line_dash="4 4")

# 显示结果
show(p)
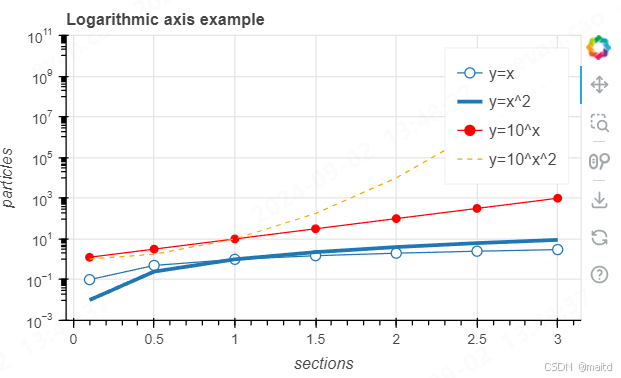
通过上述代码,你可以创建一个具有对数 y 轴的绘图,并显示不同函数上的数据点,如 y=x、y=x^2、y=10^x 和 y=10^x^2。
这个设置使得绘图更适合显示跨越多个数量级的数据。
启用日期时间坐标轴
设置 x_axis_type 或 y_axis_type 为 "datetime" 可以在坐标轴上显示日期或时间信息。Bokeh 会创建一个 DatetimeAxis。
要格式化 DatetimeAxis 的刻度,请使用 DatetimeTickFormatter。
示例代码
import random
from datetime import datetime, timedelta

from bokeh.models import DatetimeTickFormatter, NumeralTickFormatter
from bokeh.plotting import figure, show

# 生成日期列表(今天日期的后续几周)
dates = [(datetime.now() + timedelta(days=day * 7)) for day in range(0, 26)]

# 生成25个随机数据点
y = random.sample(range(0, 100), 26)

# 创建新绘图
p = figure(
    title="datetime axis example",
    x_axis_type="datetime",  # 启用日期时间坐标轴
    sizing_mode="stretch_width",
    max_width=500,
    height=250,
)

# 添加渲染器
p.scatter(dates, y, size=8)
p.line(dates, y, color="navy", line_width=1)

# 格式化坐标轴刻度
p.yaxis[0].formatter = NumeralTickFormatter(format="$0.00")
p.xaxis[0].formatter = DatetimeTickFormatter(months="%b %Y")

# 显示结果
show(p)
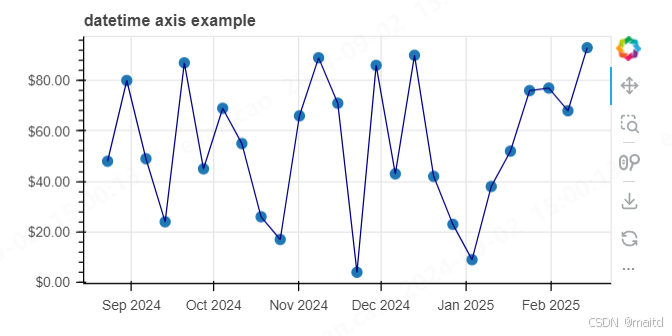
通过以上代码,你可以创建一个x轴为日期时间的图表,并将日期格式化为 “月 年” 格式,如 “Jan 2021”。y轴的刻度格式化为美元金额。
相关链接
详细了解如何自定义坐标轴,请参阅用户指南中的 Styling axes。
参考指南中的Axis
则包含了你可以用来自定义绘图坐标轴的所有可用属性列表。


