使用 Arduino 串行绘图仪可视化实时数据
Using The Arduino Serial Plotter To Visualize Real Time Data
参考:
-
Arduino Docs: Using the Serial Plotter Tool (IDE v2)
Arduino Docs:使用串行绘图仪工具 (IDE v2) -
The ADC-10-F103C serial plotter source code has been moved to its own repository. A click-to-run EXE can be downloaded from its releases page.
ADC-10-F103C 串行绘图仪源代码已移至其自己的存储库中。可以从其发布页面下载一键运行的 EXE。
Using The Arduino Serial Plotter To Visualize Real Time Data - Woolsey Workshop -
Arduino 串口绘图库
-
python 实现arduino串口数据绘图
Introduction
本教程将教您如何使用 Arduino 串行绘图仪显示波形和实时数据。 希望您对电子学和编程有基本的了解,并对 Arduino 平台有一定的熟悉程度。
The resources created for this tutorial are available on GitHub for your reference.
What Is Needed
- Arduino IDE
- Arduino Uno WiFi R2
Displaying Generated Waveforms
This section will describe how to generate and display waveforms using the Serial Plotter.
Open the Arduino IDE and create a new sketch named FunctionGenerator with the code shown below.
本节将介绍如何使用串行绘图仪生成和显示波形。 打开 Arduino IDE,创建一个名为 FunctionGenerator 的新草图,代码如下所示。
void setup() {
   Serial.begin(9600);  // initialize serial bus (Serial Plotter)
}

void loop() {
   // Uncomment one of the wave types below to display in Serial Plotter.
   // Serial Plotter window may need to be closed and reopened between runs
   // to remove old plot data.
   // plotCombinedWaves();
   // plotSawtoothWave();
   plotSineWave();
   // plotSquareWave();
   // plotTriangleWave();
}

void plotCombinedWaves() {
   for (float i = 0.0; i <= 2 * PI; i += 0.1) {
      Serial.print(cos(i));  Serial.print(" ");  // cosine wave
      Serial.print(sin(i));  Serial.print(" ");  // sine wave
      Serial.println(i <= PI ? -1.5 : 1.5);      // square wave
   }
}

void plotSawtoothWave() {
   for (int i = 0; i <= 100; i++) {
      Serial.println(i);
   }
}

void plotSineWave() {
   for (float i = 0.0; i <= 2 * PI; i += 0.1) {
      Serial.println(sin(i));
   }
}

void plotSquareWave() {
   for (int i = 0; i <= 100; i++) {
      Serial.println(0);
   }
   for (int i = 0; i <= 100; i++) {
      Serial.println(100);
   }
}

void plotTriangleWave() {
   for (int i = 0; i <= 100; i++) {
      Serial.println(i);
   }
   for (int i = 100; i >= 0; i--) {
      Serial.println(i);
   }
}
The code should be fairly straightforward, but if there is something that needs further explanation, please let me know in the comment section and I will try to answer your question.
Open the Serial Plotter window (Tools > Serial Plotter) and make sure the baud rate is set to 9600. This is where the generated waveforms will be displayed.
Upload (Sketch > Upload) the sketch to the board and you should see a sine wave being displayed in the Serial Plotter window as shown below.
代码应该相当简单明了, 打开串行绘图仪窗口(工具 > 串行绘图仪),确保波特率设置为 9600。 将草图上传(草图 > 上传,你应该会看到正弦波显示在串行绘图仪窗口中,如下图所示。
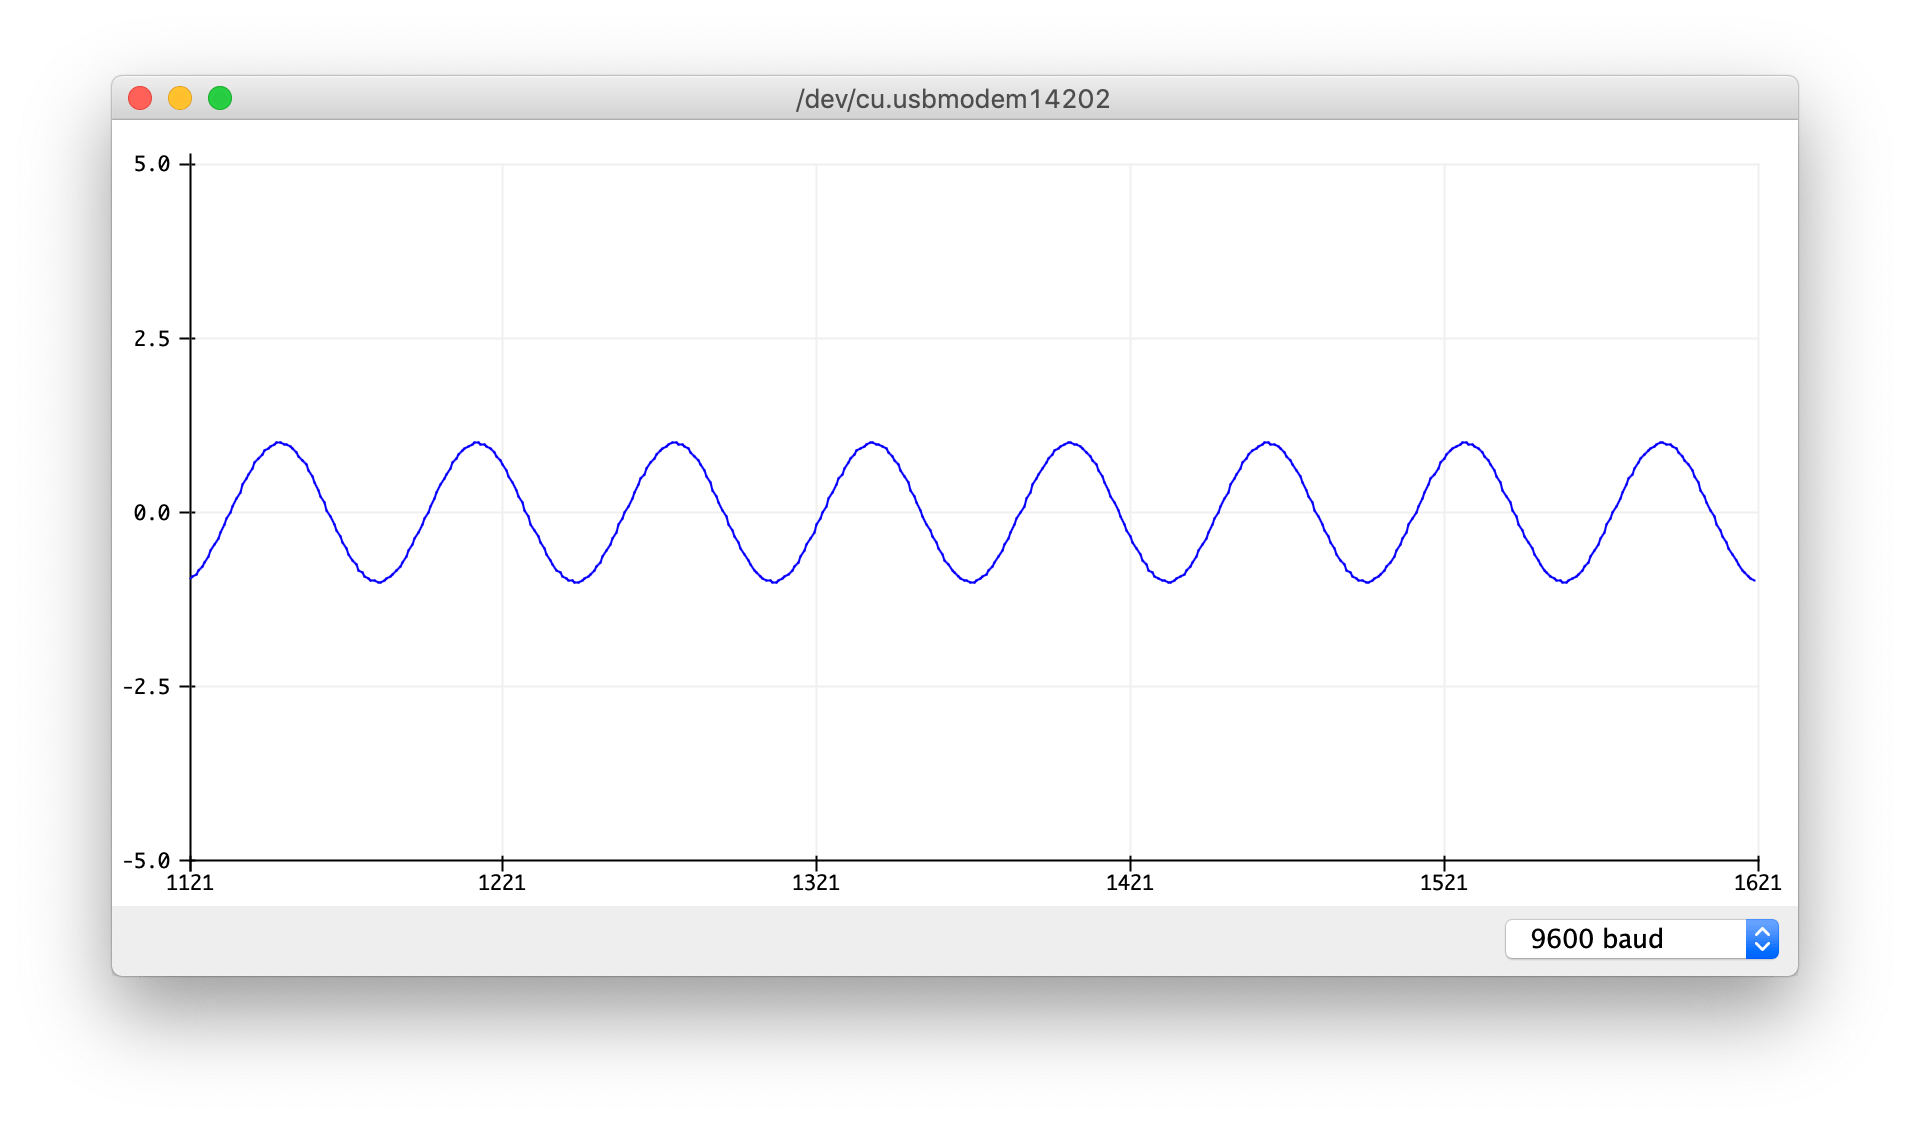 Sine Wave In Serial Plotter Window
If we take a look at the sketch, we see that the plotSineWave() function is being called from within the loop() function. Display one of the other waveforms by commenting out the plotSineWave() function, uncommenting one of the other waveforms, and rerunning your sketch. Note, if you see data left over from the previous plot, you will need to close and re-open the Serial Plotter window to clear the screen.
Reviewing the plotSineWave() function, we see the data is simply being sent using the Serial.println() function that you are probably already familiar with for printing text and data to the Serial Monitor. As long as only numbers and whitespace are sent over the serial port in a particular format, the Serial Plotter can interpret that data to graph it visually. This format requires that a new line character be sent in between x-axis tick marks and that y-axis values are separated by whitespace such as a space or tab.
For instance, we would use the following general format to plot single variable data
如果我们看一下草图,就会发现 plotSineWave() 函数是在loop()函数中调用的。 注释掉 plotSineWave() 函数,取消注释其他波形之一,然后重新运行草图,即可显示其他图形。
请注意,如果您看到上一次绘制的残留数据,则需要关闭并重新打开串行绘图仪窗口以清除屏幕。
查看 plotSineWave() 函数,我们会发现数据只是使用 Serial.println() 函数发送的,您可能已经熟悉了将文本和数据打印到串行监视器的方法。 只要通过串行端口以特定格式发送的数据中只有数字和空白,串行绘图仪就能解释这些数据并绘制出可视化图形。 这种格式要求在 x 轴刻度线之间发送一个新行字符,y 轴值之间用空格或制表符等空白分隔。 例如,我们可以使用以下一般格式绘制单变量数据
Serial.println(data);
and the following for multivariable data.
以及以下针对多变量数据。
Serial.print(dataA);
Serial.print(“ “);
Serial.println(dataB);
Notice that only the last statement, println(), actually sends a new line. You can add more variables as long as you add the appropriate whitespace in between the print() statements for each of the variables. You may even choose to use a tab, print(“\t”), in between your variables to make the data easier to read while viewing the data directly within the Serial Monitor window.
Whereas all other wave functions display only a single variable plot, the plotCombinedWaves() function displays three different waveforms simultaneously. View this function for a better understanding of how to plot a multivariable graph. The plot for this is shown below.
请注意,只有最后一条 println() 语句实际上发送了一行新的内容。 只要在每个变量的print()语句之间添加适当的空白,就可以添加更多变量。 您甚至可以选择在变量之间使用制表符 print("\t"),以便在串行监视器窗口中直接查看数据时更容易读取数据。 其他所有波形函数都只显示一个变量图,而 plotCombinedWaves() 函数则同时显示三个不同的波形。 查看此函数可更好地了解如何绘制多变量图。 相关图表如下所示。
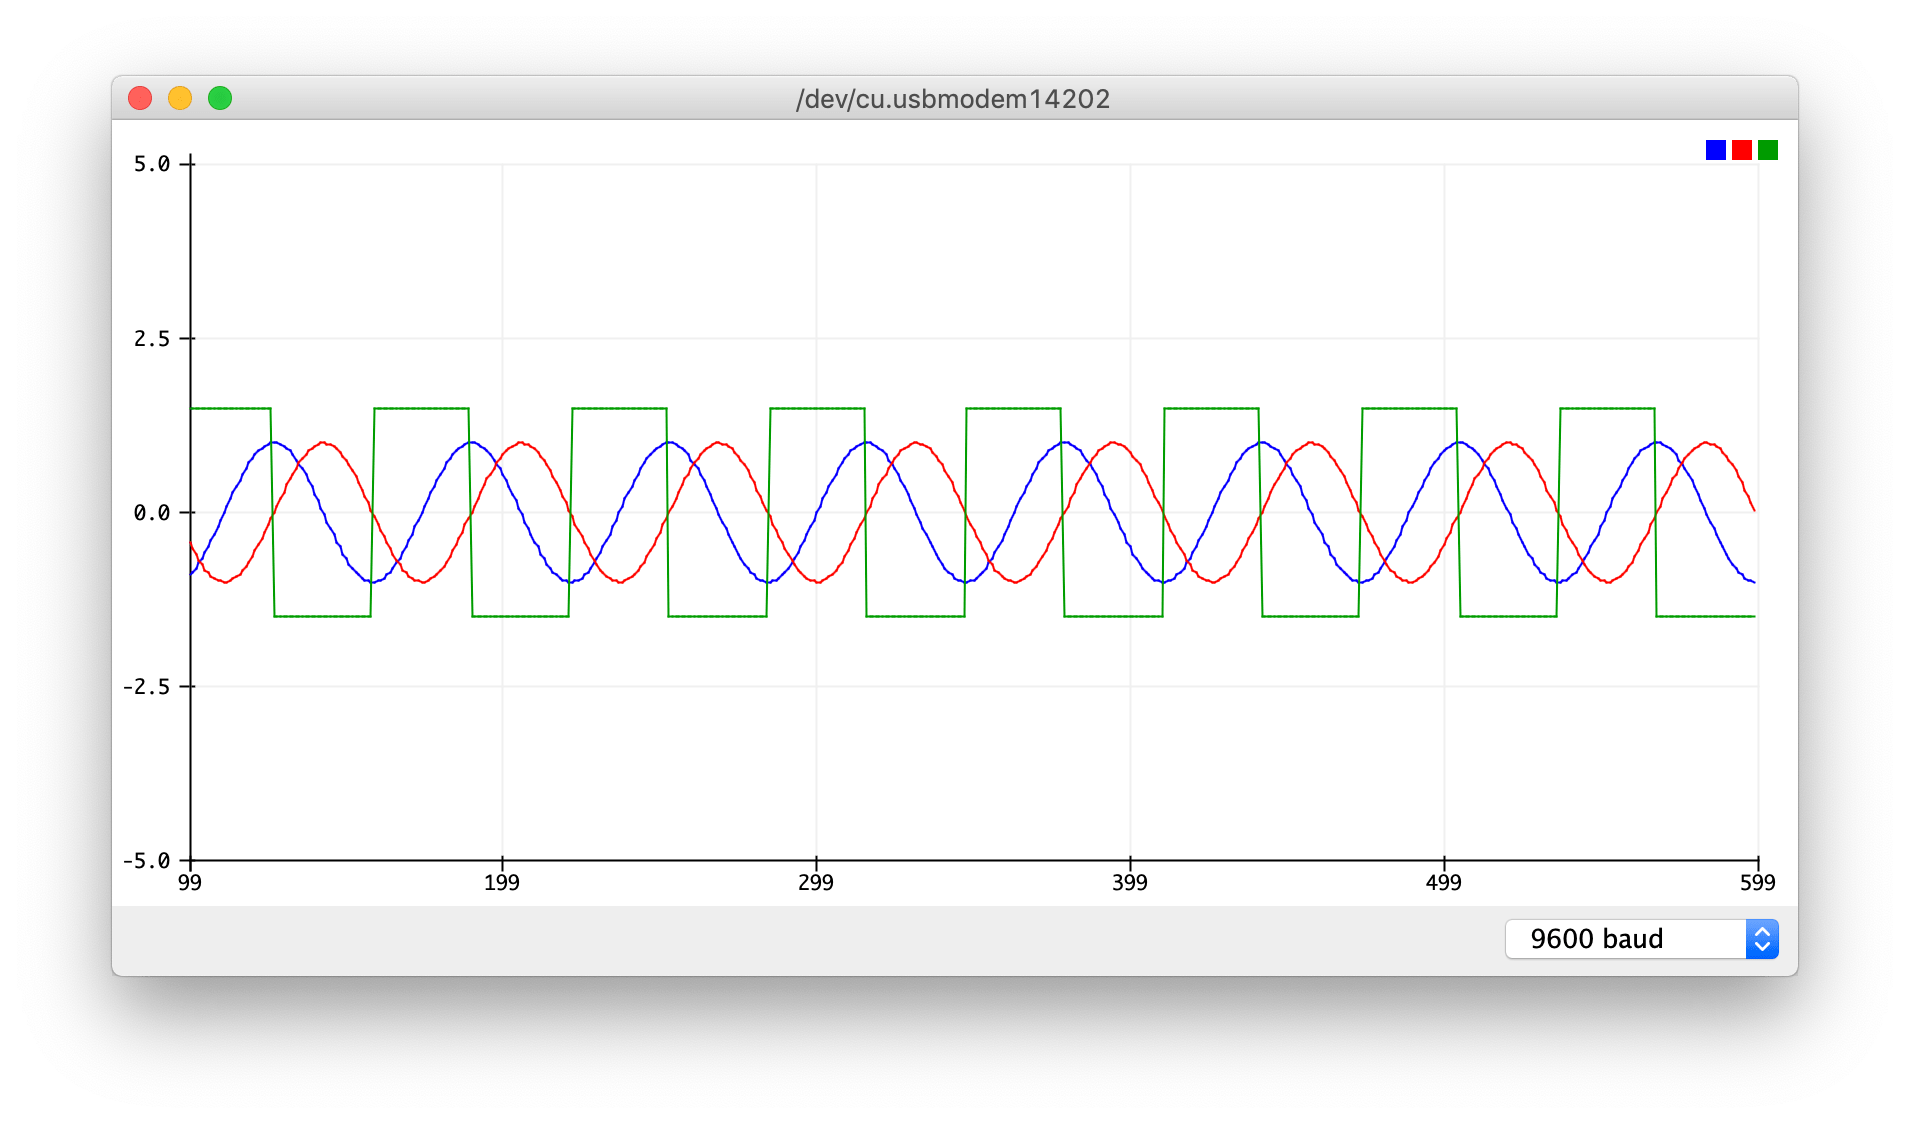 Combined Waveforms In Serial Plotter Window
Displaying Real Time Data
Until now, we have only plotted data for waveforms we generated ourselves. Now let’s use the on-board IMU of the Arduino Uno WiFi R2 to plot actual real time motion data.
Create a new sketch named LSM6DS3_SerialPlotter with the code shown below. I won’t go into the details of how to access the IMU data, but if you are interested, please see our Accessing The IMU On The New Arduino Uno WiFi Rev2 tutorial for more information.
到目前为止,我们只绘制了自己生成的波形数据。 现在,让我们使用 Arduino Uno WiFi R2 的板载 IMU 绘制实际的实时运动数据。 用下图所示代码创建一个名为 LSM6DS3_SerialPlotter 的新草图。 我不会详细介绍如何访问 IMU 数据,但如果您感兴趣,请参阅我们的 "访问新 Arduino Uno WiFi Rev2 上的 IMU "教程,了解更多信息。
// Includes
#include <SparkFunLSM6DS3.h>
#include <SPI.h>

// Defines
#define PLOT_INTERVAL 100

// Global Variables
unsigned long previousTime = 0;

// Constructors
LSM6DS3 imu(SPI_MODE, SPIIMU_SS);  // set SPI mode and chip select for on-board IMU

void setup() {
   Serial.begin(9600);  // initialize serial bus (Serial Plotter)
   delay(1000);         // wait one second for IMU reset to complete
   imu.begin();         // initialize IMU
}

void loop() {
   unsigned long currentTime = millis();
   if (currentTime - previousTime >= PLOT_INTERVAL) {
      Serial.print(imu.readFloatAccelX());  Serial.print(" ");  // x-axis
      Serial.print(imu.readFloatAccelY());  Serial.print(" ");  // y-axis
      Serial.println(imu.readFloatAccelZ());                    // z-axis
      previousTime = currentTime;
   }
}
Within the loop() function, we are accessing and displaying all three axes of the IMU motion data every 100 ms. The plot of this data is shown below.
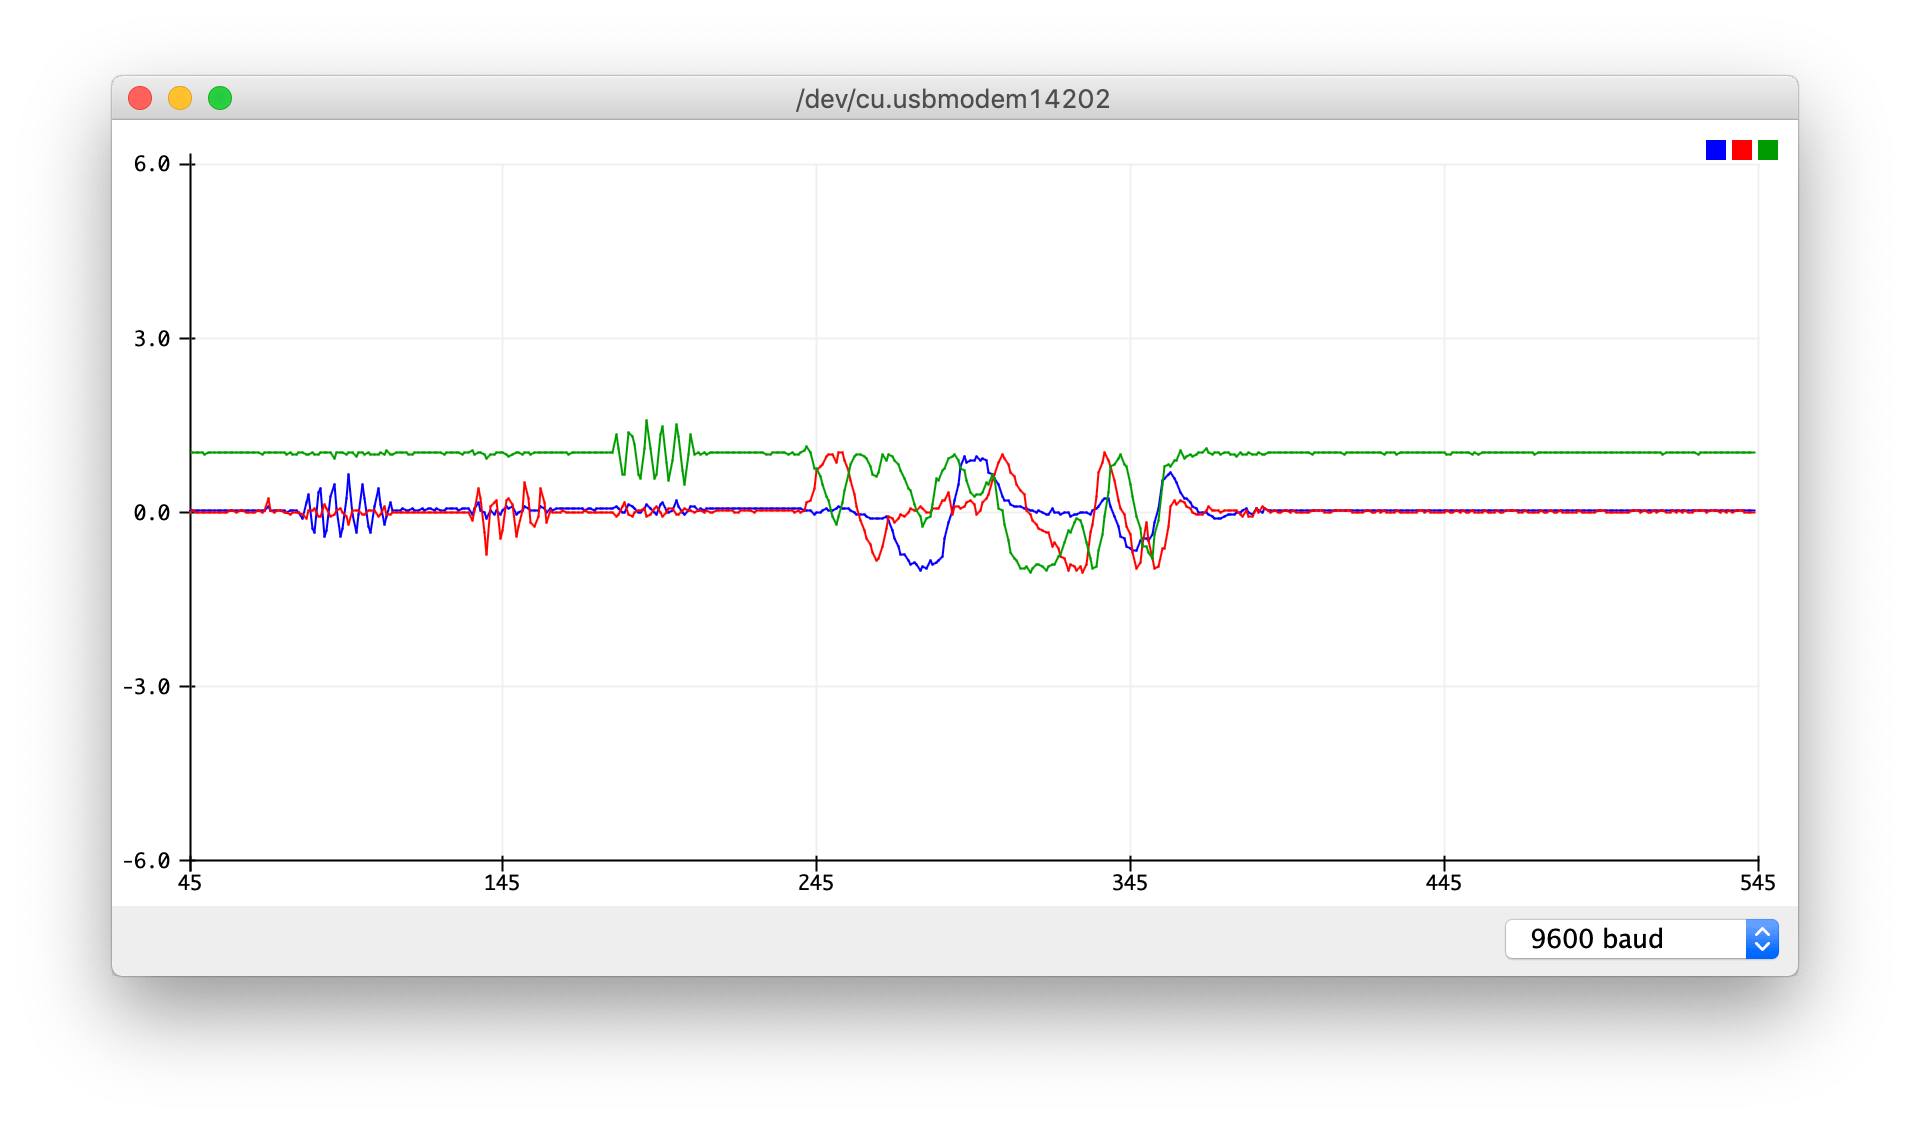 IMU Sensor Data In Serial Plotter Window
The blue squiggles at the beginning of the graph represent moving the board in the x direction. The red and green ones represent the y and z directions respectively. The mass of movement in all directions at the end of the graph represents moving and rotating the board in all kinds of directions.
图形开头的蓝色斜线代表棋盘在 x 方向上的移动。 红色和绿色方块分别代表 y 和 z 方向。 图形末端各个方向的运动质量表示棋盘在各个方向上的移动和旋转。
Summary
In this tutorial, we learned how to generate and display various types of waveforms using the Arduino IDE’s Serial Plotter. We also learned how to graph real time motion data from the Arduino Uno WiFi R2’s on-board IMU.
The Serial Plotter may be a simple tool, but it can be a powerful one allowing you to visualize and debug your program’s data and sensor measurements. As they say, “a picture is worth a thousand words”.
The final source code used for this tutorial is available on GitHub.
Thank you for joining me in this journey and I hope you enjoyed the experience. Please feel free to share your thoughts in the comments section below.
在本教程中,我们学习了如何使用 Arduino IDE 的串行绘图仪生成和显示各种类型的波形。 串行绘图仪可能只是一个简单的工具,但它的功能却十分强大,可以让您对程序数据和传感器测量结果进行可视化调试。 俗话说,“一图胜千言”。


![[qt] 数据库基本概念](https://i-blog.csdnimg.cn/direct/9247f22128c74fb49847601147e9b5cd.png)