Title
题目
Artificial intelligence-enhancedelectrocardiography derived body massindex as a predictor of futurecardiometabolic disease
人工智能增强的心电图推导的身体质量指数作为未来心脏代谢疾病预测指标
01
文献速递介绍
心电图(ECG)可以捕捉与肥胖相关的心脏变化。人工智能增强的心电图(AI-ECG)可以识别亚临床疾病。我们训练了一个AI-ECG模型,仅通过心电图预测身体质量指数(BMI)。该模型由贝丝以色列女执事医疗中心(BIDMC)的512,950份12导联心电图数据开发,并在英国生物银行(UKB)(n = 42,386)上进行了验证。AI-ECG预测的BMI与实际测量的BMI之间在BIDMC队列和英国生物银行中的皮尔逊相关系数(r)分别为0.65和0.62,决定系数(R²)分别为0.43和0.39。
我们发现,测量BMI与AI-ECG预测的BMI(AI-ECG-BMI)之间的差值(delta-BMI)是心脏代谢健康的一个生物标志物。delta-BMI处于最高三分位的患者未来罹患心脏代谢疾病(BIDMC: HR 1.15, p < 0.001; UKB: HR 1.58, p < 0.001)和糖尿病(BIDMC: HR 1.25, p < 0.001; UKB: HR 2.28, p < 0.001)的风险增加,且在调整包括测量BMI在内的协变量后依然显著。在两个队列中,包含delta-BMI后,模型的拟合度、重分类和辨别能力均显著增强。
表型分析显示delta-BMI与心脏代谢疾病、躯干肥胖的体型测量指标和心包脂肪量之间存在关联。代谢和蛋白质组学分析表明delta-BMI与缬氨酸、小HDL中的脂类、突触结合蛋白3和肌肽二肽酶1呈正相关,而与谷氨酰胺、甘氨酸、辅助脂肪酶和脂联素呈负相关。全基因组关联研究发现其与心血管/代谢性状的调控因子(包括SCN10A、SCN5A、EXOG和RXRG)有关。
总之,我们的AI-ECG-BMI模型可以准确预测BMI,并引入delta-BMI作为一种无创的心脏代谢风险分层生物标志物。
Method
方法
For the Beth Israel Deaconess Medical Center (BIDMC), cohort ethicsreview and approval were provided by the Beth Israel Deaconess MedicalCenter Committee on Clinical Investigations, IRB protocol # 2023P000042.The UK Biobank has approval from the North West Multi-CentreResearch Ethics Committee as a Research Tissue Bank (application IDs48666, 47602).
贝丝以色列女执事医疗中心(BIDMC)的队列伦理审查和批准由贝丝以色列女执事医疗中心临床研究委员会提供,IRB协议号为#2023P000042。英国生物银行获得了西北多中心研究伦理委员会作为研究组织库的批准(申请ID 48666, 47602)。
Results
结果
AI-ECG BMI derivation The Beth Israel Deaconess Medical Center (BIDMC) cohort, a secondarycare dataset comprised of routinely collected data from Boston, USA, wasused as the derivation cohort. In total, 512,950 ECGs from 114,415 subjectshad paired BMI data available. The BIDMC dataset was divided intotraining, validation, and holdout test sets using a split ratio of 60/10/30%.Full details are provided in theMethods. Cohort demographics are shown inSupplementary Table 1.
AI-ECG BMI推导 使用了来自美国波士顿的二级护理数据集,该数据集包含从Beth Israel Deaconess Medical Center (BIDMC)收集的常规数据。总共有来自114,415名受试者的512,950份心电图,其中具有匹配的BMI数据。将BIDMC数据集按照60/10/30%的比例分为训练、验证和保留测试集(详见方法部分)。补充表1中列出了队列的统计信息。
Figure
图
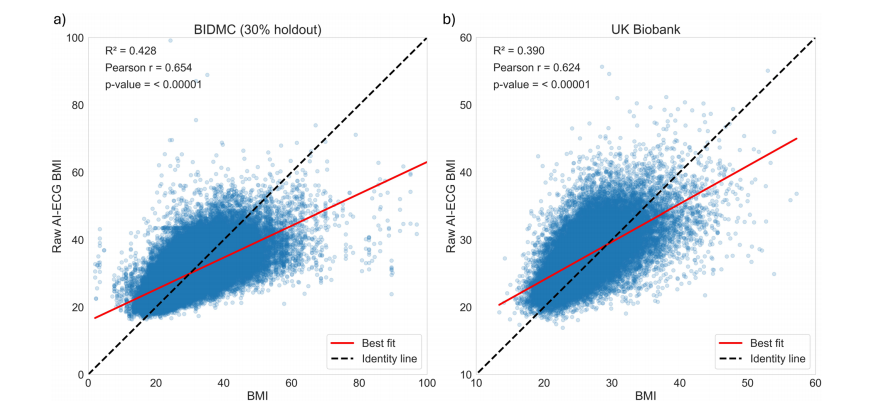
Fig. 1 | Association between AI-ECG BMI predictions and measured BMI in theBIDMC and UK Biobank cohorts. Scatter plots depicting the association betweenraw AI-ECG-BMI predictions and measured BMI within (a) the 30% holdoutBIDMC and (b) UK Biobank cohorts. The black identity line serves as a referencepoint, representing the ideal prediction scenario. The red line represents the best-fitline. The R2 (Pearson correlation) was 0.43 (r = 0.65) in the 30% holdout BIDMC,and 0.39 (r = 0.62) in the UK Biobank cohort
图1 | AI-ECG BMI预测与BIDMC和英国生物银行队列中实际测量的BMI之间的关联。散点图显示了(a)在30%保留的BIDMC和(b)英国生物银行队列中,原始AI-ECG-BMI预测值与实际测量的BMI之间的关联。黑色的身份线作为参考点,表示理想的预测情景。红线表示最佳拟合线。在30%保留的BIDMC中,R²(皮尔逊相关系数)为0.43(r = 0.65),在英国生物银行队列中,R²为0.39(r = 0.62)。
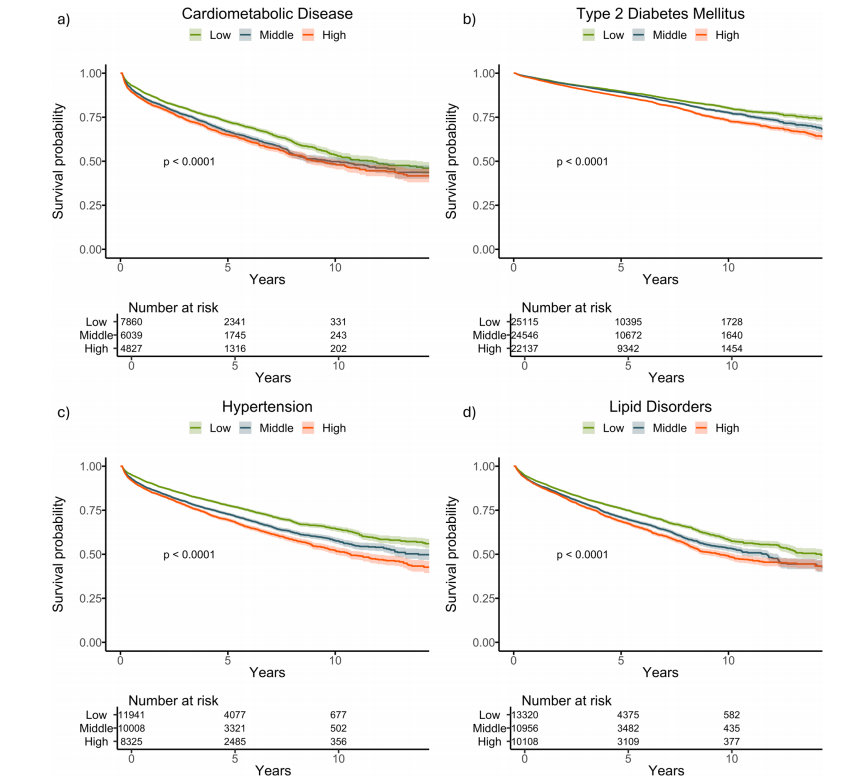
Fig. 2 | Kaplan–Meier survival curves stratified by delta-BMI curves for futurecardiometabolic outcomes in the BIDMC cohort. Kaplan–Meier survival curvesstratified by tertiles of delta-BMI in the BIDMC Cohort: Subplots a–d depict survivalcurves for cardiometabolic disease, type 2 diabetes mellitus, hypertension, and lipiddisorders, respectively. Patients are stratified into tertiles based on delta-BMI,providing insights into the differential risk of each outcome. Log-rank p-values arereported for each outcome, highlighting statistically significant differences in survival across delta-BMI tertiles. Tertile cut-offs for delta-BMI are defined as follows:Bottom (delta-BMI ≤ −3.74), Middle (−3.74 to 2.44), and Top (>2.44).
图2 | 按delta-BMI分层的Kaplan-Meier生存曲线用于预测BIDMC队列中的未来心脏代谢结果。Kaplan-Meier生存曲线根据BIDMC队列中delta-BMI的三分位数进行分层:子图a–d分别显示心脏代谢疾病、2型糖尿病、高血压和脂质紊乱的生存曲线。患者根据delta-BMI分为三分位数,从而提供对每种结果差异风险的洞察。每种结果的Log-rank p值均有报道,突出了delta-BMI三分位数之间生存差异的统计显著性。delta-BMI的三分位数界限定义如下:底部(delta-BMI ≤ -3.74),中间(-3.74至2.44),顶部(> 2.44)。
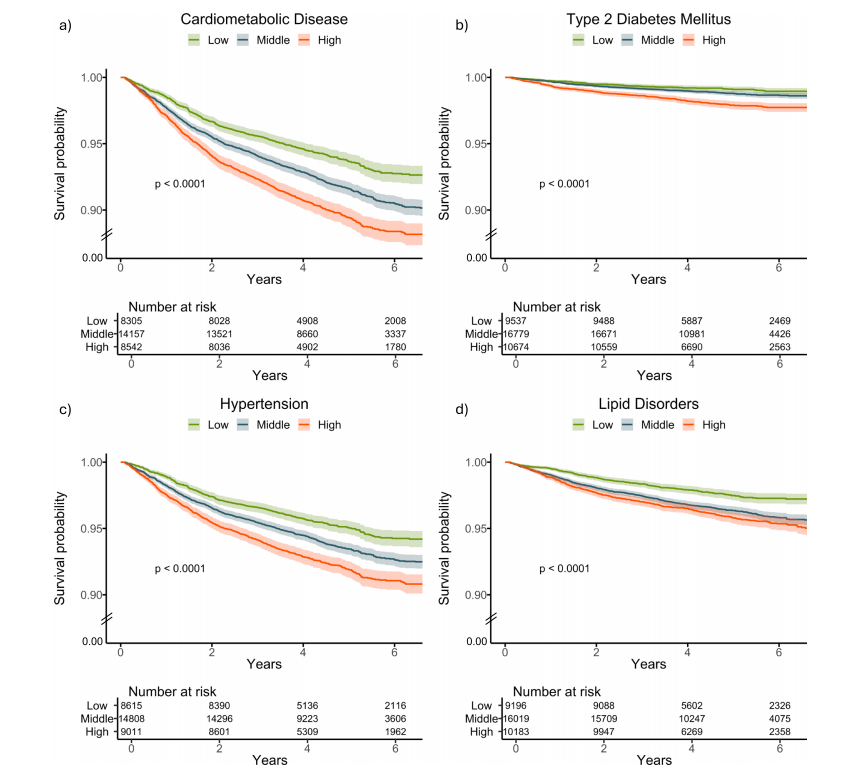
Fig. 3 | Kaplan–Meier survival curves stratified by delta-BMI curves for futurecardiometabolic outcomes in the UK Biobank. Kaplan–Meier survival curvesstratified by tertiles of delta-BMI in the UK Biobank Cohort: Subplots a–d depictsurvival curves for cardiometabolic disease, type 2 diabetes mellitus, hypertension,and lipid disorders, respectively. Patients are stratified into tertiles based on deltaBMI, providing insights into the differential risk of each outcome. Log-rank p-valuesare reported for each outcome, highlighting statistically significant differences insurvival across delta-BMI tertiles. Tertile cut-offs for delta-BMI are defined as follows: Bottom (delta-BMI ≤ −3.74), Middle (−3.74 to 2.44), and Top (>2.44). Toenhance clarity, the lower limit of the y-axis has been adjusted to 0.90, indicated bythe break lines between 0.90 and 0.
图3 | 按delta-BMI分层的Kaplan-Meier生存曲线用于预测英国生物银行中的未来心脏代谢结果。Kaplan-Meier生存曲线根据英国生物银行队列中delta-BMI的三分位数进行分层:子图a–d分别显示心脏代谢疾病、2型糖尿病、高血压和脂质紊乱的生存曲线。患者根据delta-BMI分为三分位数,从而提供对每种结果差异风险的洞察。每种结果的Log-rank p值均有报道,突出了delta-BMI三分位数之间生存差异的统计显著性。delta-BMI的三分位数界限定义如下:底部(delta-BMI ≤ -3.74),中间(-3.74至2.44),顶部(> 2.44)。为了增强清晰度,y轴的下限已调整为0.90,并在0.90到0之间使用了断线表示。
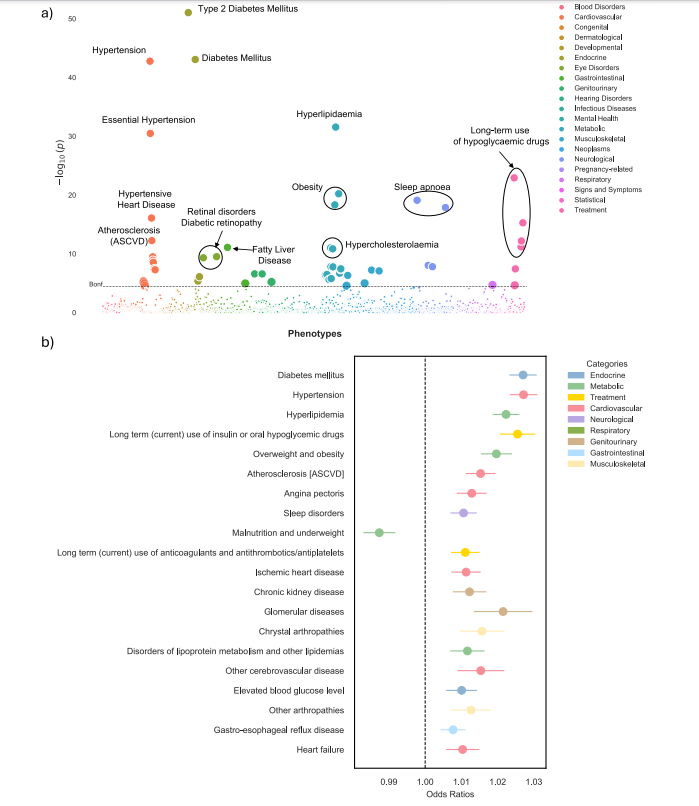
Fig. 4 | Phenome-wide association study (PheWAS) of delta-BMI in the BIDMCcohort. Exploration of the underlying biology through a phenome-wide associationstudy (PheWAS) in the BIDMC cohort: a A PheWAS Manhattan plot showing thenegative logarithm of the univariate logistic regression p-values between delta-BMIand disease phecodes, adjusted for measured BMI, sex, age, and age2 . The dashedhorizontal line signifies the Bonferroni corrected threshold for multiplecomparisons. Out of 1408 comparisons, 55 (3.9%) reached significance based on theBonferroni correction. An interactive version of the plots can be accessed in theOnline Supplement. b Illustrates the top 20 significant phecodes associated withdelta-BMI, presenting their respective odds ratios with 95% CI. ASCVD atherosclerotic cardiovascular disease.
图4 | BIDMC队列中delta-BMI的广泛表型关联研究(PheWAS)。通过广泛表型关联研究(PheWAS)探索BIDMC队列中delta-BMI的潜在生物学:a PheWAS曼哈顿图显示delta-BMI与疾病表型代码之间的单变量逻辑回归p值的负对数,调整因素包括测量的BMI、性别、年龄和年龄的平方。虚线表示Bonferroni校正的多重比较阈值。在1408个比较中,有55个(3.9%)在Bonferroni校正下达到显著性水平。互动版图表可在在线补充材料中访问。b 显示了与delta-BMI相关的前20个显著表型代码,并呈现其各自的比值比及95%置信区间。ASCVD代表动脉粥样硬化性心血管疾病。
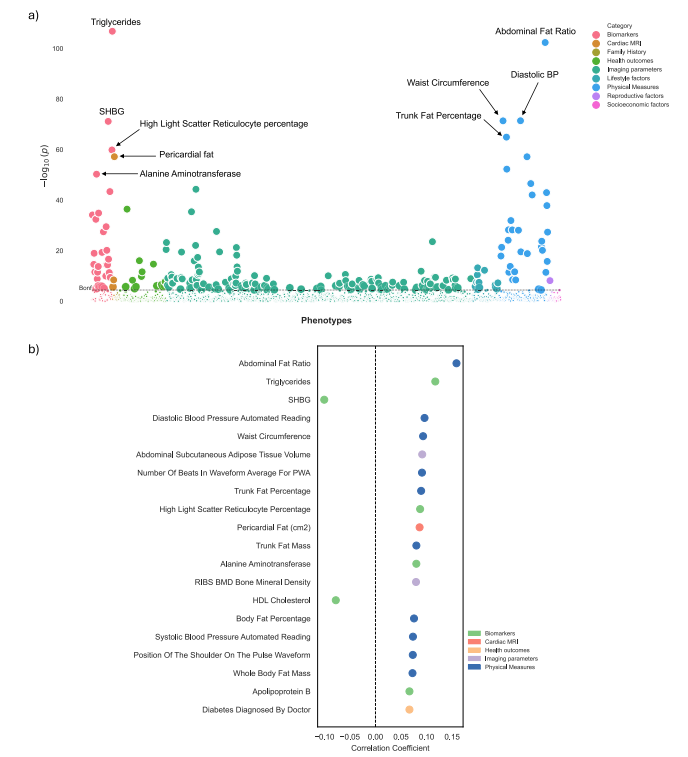
Fig. 5 | Phenome-wide association study (PheWAS) of delta-BMI in the UKBiobank. Exploration of the underlying biology through a phenome-wide association study (PheWAS) in the UK Biobank using clinical phenotypes: a A PheWASManhattan plot showing the negative logarithm of the univariate correlation pvalues between delta-BMI and routinely recorded clinical features, adjusted formeasured BMI, sex, age, and age2 . The dashed horizontal line signifies the Bonferronicorrected threshold for multiple comparisons. Out of 1368 comparisons, 231(16.9%) reached significance based on the Bonferroni correction, most of whichcame from imaging parameters, physical measures, and biomarkers. An interactiveversion of the plots can be accessed in the Online Supplement. b Illustrates the top 20significant clinical phenotypes correlated with delta-BMI, presenting their respectivecorrelation coefficients (Pearson). SHBG Sex Hormone Binding Globulin, PWAPulse Wave Analysis, BP Blood Pressure, BMD Bone Mineral Density, HDL HighDensity Lipoprotein.
图5 | 英国生物银行中delta-BMI的广泛表型关联研究(PheWAS)。通过英国生物银行的临床表型进行广泛表型关联研究(PheWAS),探索delta-BMI的潜在生物学:a PheWAS曼哈顿图显示delta-BMI与常规记录的临床特征之间单变量相关性p值的负对数,调整因素包括测量的BMI、性别、年龄和年龄的平方。虚线表示Bonferroni校正的多重比较阈值。在1368个比较中,有231个(16.9%)在Bonferroni校正下达到显著性水平,这些显著性主要来自成像参数、物理测量和生物标志物。互动版图表可在在线补充材料中访问。b 显示了与delta-BMI相关的前20个显著临床表型,并呈现其各自的相关系数(皮尔逊)。SHBG为性激素结合球蛋白,PWA为脉搏波分析,BP为血压,BMD为骨密度,HDL为高密度脂蛋白。
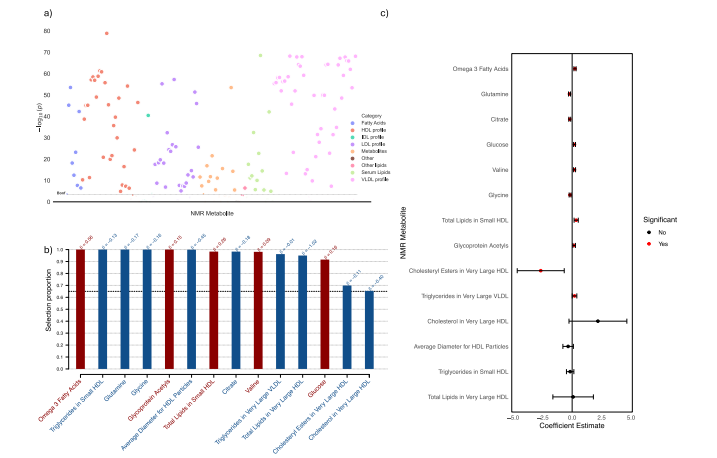
Fig. 6 | Metabolomic analysis of delta-BMI variability. Exploration of theunderlying biology of delta-BMI variability using the UK Biobank NMR metabolomic data: a A metabolome-wide association study (MWAS) Manhattan plotshowing the negative logarithm of the univariate correlation p-values between deltaBMI and the concentrations of NMR metabolites, adjusted for BMI, sex, age, andage2 . Out of 168 comparisons, 136 (80.1%) reached significance based on the Bonferroni correction. An interactive version of the plots can be accessed in the OnlineSupplement. b Stability selection analysis employing LASSO regression onsignificant MWAS metabolites: This analysis, conducted over 1000 iterations with80% subsampling, identifies robust metabolite associations with delta-BMI.Adjustments were made for measured BMI, sex, age, and age2 . The black dashed linerepresents the calibrated selection proportion. c Multivariate linear regressionanalysis of stably selected metabolites against delta-BMI, adjusted for measuredBMI, sex, age, and age2 , demonstrating the individual contribution of stably selectedmetabolites to variations in delta-BMI.
图6 | delta-BMI变异性的代谢组学分析。使用英国生物银行NMR代谢组学数据探索delta-BMI变异性的潜在生物学:a 代谢组全范围关联研究(MWAS)曼哈顿图显示delta-BMI与NMR代谢物浓度之间单变量相关性p值的负对数,调整因素包括BMI、性别、年龄和年龄的平方。在168个比较中,有136个(80.1%)在Bonferroni校正下达到显著性水平。互动版图表可在在线补充材料中访问。b 稳定性选择分析采用LASSO回归对显著的MWAS代谢物进行分析:此分析在1000次迭代中使用80%的子样本,识别出与delta-BMI关联的稳健代谢物。调整因素包括测量的BMI、性别、年龄和年龄的平方。黑色虚线代表校准后的选择比例。c 稳定选择代谢物对delta-BMI的多变量线性回归分析,调整因素包括测量的BMI、性别、年龄和年龄的平方,展示了稳定选择代谢物对delta-BMI变异的单独贡献。
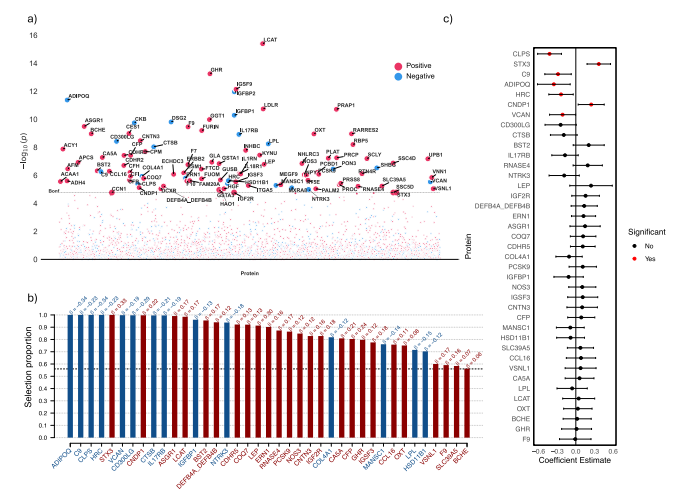
Fig. 7 | Proteomic analysis of delta-BMI variability. Exploration of the underlyingbiology of delta-BMI variability using the UK Biobank PPP data: a A protein-wideassociation study (PWAS) Manhattan plot showing the negative logarithm of theunivariate correlation p-values between delta-BMI and the concentration of proteins, adjusted for measured BMI, sex, age, and age2 . Of the 2919 proteins analysed,100 (3.4%) surpassed the Bonferroni-corrected significance threshold. An interactive version of the plots can be accessed in the Online Supplement. b Stabilityselection analysis employing LASSO regression on significant PWAS proteins: Thisanalysis, conducted over 1000 iterations with 80% subsampling, identifies robustprotein associations with delta-BMI. Adjustments were made for measured BMI,sex, age, and age2 . The black dashed line represents the calibrated selection proportion. c Multivariate linear regression analysis of stably selected proteins againstdelta-BMI, adjusted for measured BMI, sex, age, and age2 , demonstrating the individual contribution of stably selected proteins to variations in delta-BMI.
图7 | delta-BMI变异性的蛋白质组学分析。使用英国生物银行PPP数据探索delta-BMI变异性的潜在生物学:a 蛋白质范围关联研究(PWAS)曼哈顿图显示delta-BMI与蛋白质浓度之间单变量相关性p值的负对数,调整因素包括测量的BMI、性别、年龄和年龄的平方。在分析的2919种蛋白质中,有100种(3.4%)超越了Bonferroni校正的显著性阈值。互动版图表可在在线补充材料中访问。b 稳定性选择分析采用LASSO回归对显著的PWAS蛋白质进行分析:此分析在1000次迭代中使用80%的子样本,识别出与delta-BMI关联的稳健蛋白质。调整因素包括测量的BMI、性别、年龄和年龄的平方。黑色虚线代表校准后的选择比例。c 稳定选择蛋白质对delta-BMI的多变量线性回归分析,调整因素包括测量的BMI、性别、年龄和年龄的平方,展示了稳定选择蛋白质对delta-BMI变异的单独贡献。
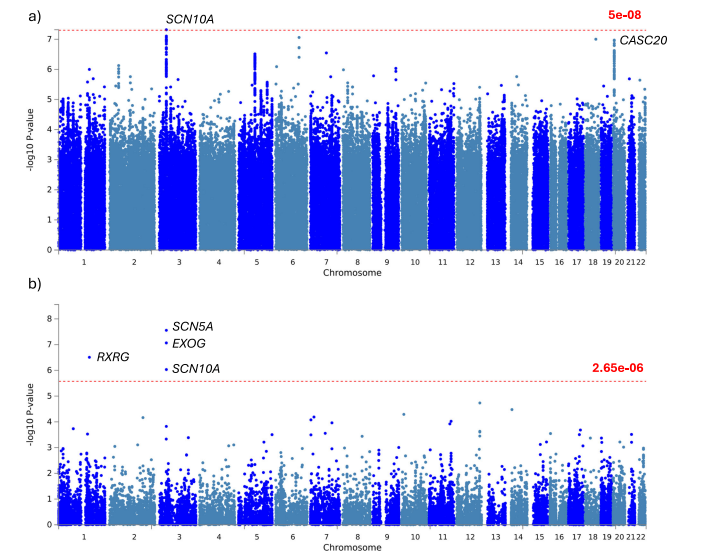
Fig. 8 | Genome-wide association study (GWAS) of delta-BMI variability.Exploration of the underlying biology of delta-BMI variability through a genomewide association study (GWAS): GWAS Manhattan plots of genomic loci associatedwith delta-BMI. a Highlights the nearest genes associated with single nucleotidepolymorphisms (SNP), with the red line depicting the genome-wide significantthreshold (P < 5 ×10⁻⁸ ). b Displays a Manhattan plot derived from the gene-basedtest using MAGMA, mapping input SNPs to 18,882 protein-coding genes; the redline represents the genome-wide significant threshold (P < 2.65 ×10⁻⁶ ). SCN10Asodium voltage-gated channel alpha subunit 10, CASC20 cancer susceptibility 20,RXRG retinoid X receptor gamma, SCN5A sodium voltage-gated channel alphasubunit 10, EXOG exo/endonuclease G.
图8 | delta-BMI变异性的全基因组关联研究(GWAS)。通过全基因组关联研究(GWAS)探索delta-BMI变异性的潜在生物学:GWAS曼哈顿图显示与delta-BMI相关的基因组位点。a 突出显示了与单核苷酸多态性(SNP)相关的最近基因,红线表示全基因组显著性阈值(P < 5 × 10⁻⁸)。b 显示了基于MAGMA基因测试的曼哈顿图,将输入的SNP映射到18,882个蛋白编码基因;红线表示全基因组显著性阈值(P < 2.65 × 10⁻⁶)。SCN10A是钠电压门控通道α亚基10,CASC20是癌症易感基因20,RXRG是视黄醇X受体γ,SCN5A是钠电压门控通道α亚基10,EXOG是外切/内切核酸酶G。
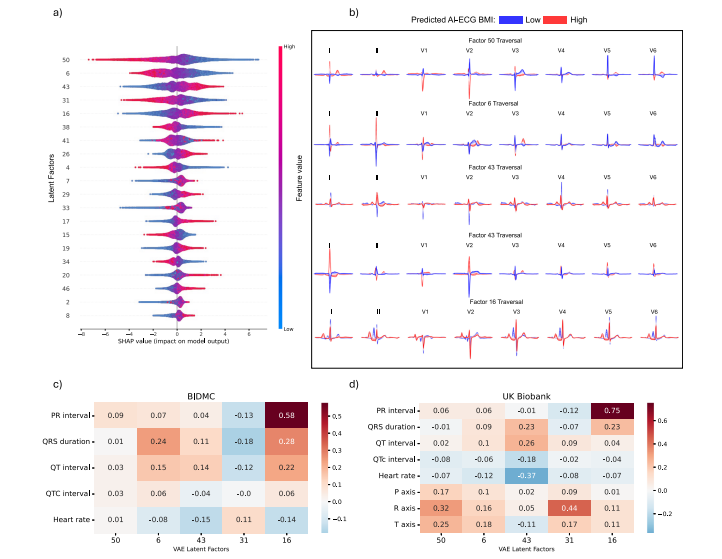
Fig. 9 | Explainable AI in ECG morphology. Explainable ECG morphology: AnXGBoost model was trained using variational autoencoder-derived latent factors toestimate the AI-ECG-derived BMI predictions. a Depicts a beeswarm plot of the 20most influential latent factors, ordered by their feature importance derived from theSHAP (SHapley Additive exPlanations) values. Each dot represents a SHAP valuefor a specific latent factor, providing insight into the significance of these latentfactors and the direction of their impact on the AI-ECG BMI predictions. Forexample, for latent factor 50, lower values of the latent factor (in blue) indicate apositive impact on the AI-ECG BMI estimation, resulting in higher BMI predictions,while higher feature values (in red) indicate a negative impact on the AI-ECG BMIestimation, resulting in lower BMI predictions. b Illustrates the latent traversals ofthe top 5 latent features and their impact on the ECG morphology. ECGmorphologies corresponding with high and low AI-ECG BMI predictions arerepresented in red and blue, respectively. Subplots c and d show correlation heatmaps between ECG parameters and the VAE-derived latent factors for the BIDMCand UK Biobank cohorts, respectively.
图9 | 心电图形态中的可解释性人工智能。可解释的心电图形态:使用变分自编码器衍生的潜在因素训练了一个XGBoost模型,以估计AI-ECG衍生的BMI预测值。a 显示了20个最具影响力的潜在因素的蜂群图,这些因素根据SHAP(Shapley加法解释)值的特征重要性排序。每个点代表一个特定潜在因素的SHAP值,提供了这些潜在因素的重要性和其对AI-ECG BMI预测影响方向的洞察。例如,对于潜在因素50,潜在因素较低值(蓝色)对AI-ECG BMI估计有正向影响,导致较高的BMI预测,而较高的特征值(红色)对AI-ECG BMI估计有负向影响,导致较低的BMI预测。b 展示了前5个潜在特征的潜在遍历及其对心电图形态的影响。高和低AI-ECG BMI预测对应的心电图形态分别用红色和蓝色表示。子图c和d分别显示了BIDMC和英国生物银行队列中心电图参数与VAE衍生潜在因素之间的相关性热图。
Table
表
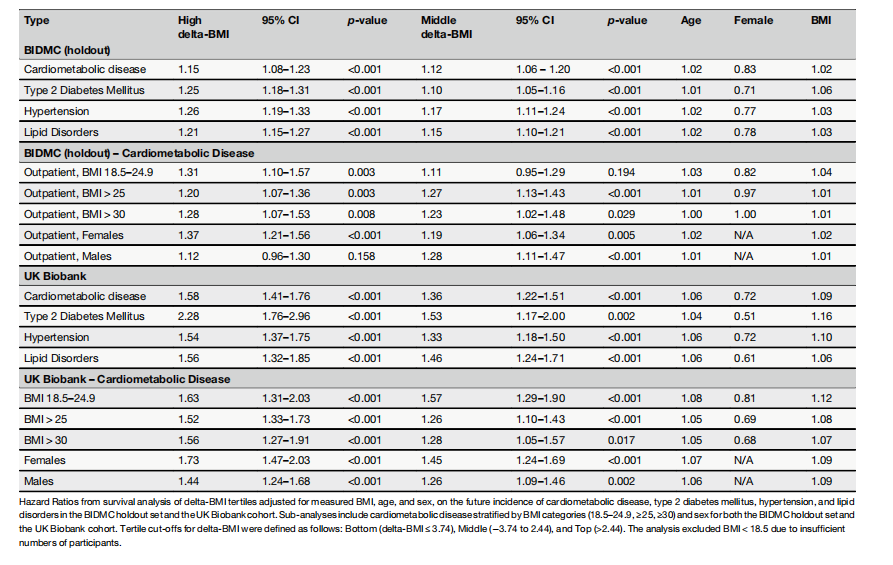
Table 1 | Adjusted hazard ratios of delta-BMI tertiles for future cardiometabolic outcomes
表1 | delta-BMI三分位数对未来心脏代谢结果的调整风险比