02 - matlab m_map地学绘图工具基础函数 - m_proj
- 0. 引言
- 1. 查看所有投影方式
- 3. 各投影方式绘图示例
- 3.1 极射赤面投影法(Stereographic )
- 3.2 Orthographic 正射投影示例
- 3.3 Azimuthal Equal-area 方位等面积投影
- 3.4 Azimuthal Equidistant 等距方位投影
- 3.5 Gnomonic 方位投影
- 3.6 Satellite 卫星投影
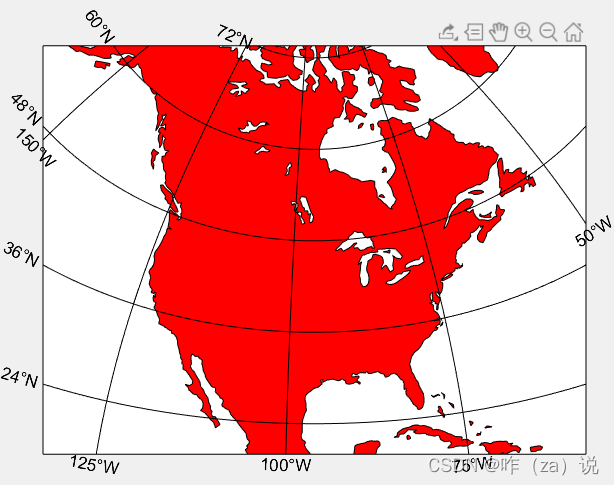
- 3.7 Albers Equal-Area Conic 圆锥等面积投影
- 3.8 Lambert Conformal Conic Lambert 圆锥保角投影
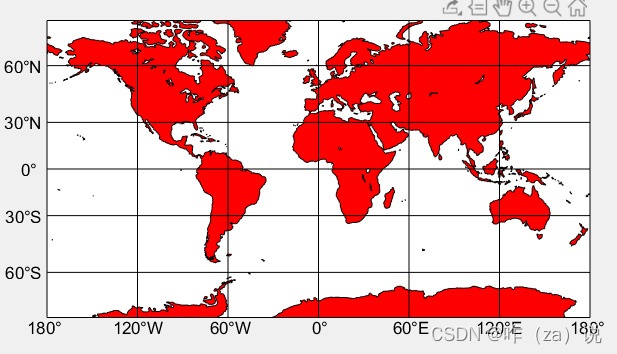
- 3.9 Mercator 墨卡托投影
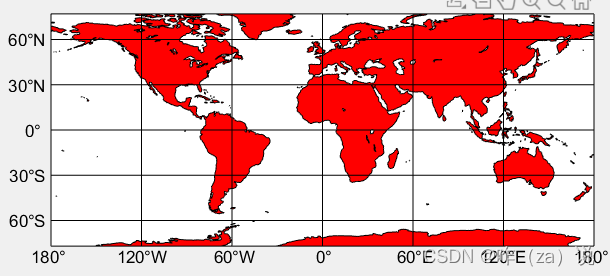
- 3.10 Miller Cylindrical Miller 圆柱投影
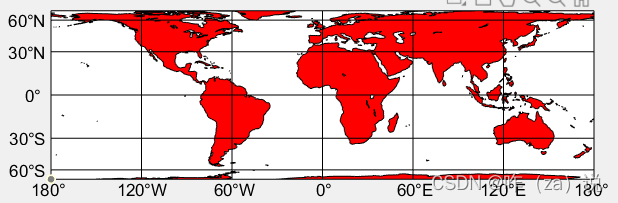
- 3.11 Equidistant Cylindrical 圆柱等距投影
- 3.12 Cylindrical Equal-Area 等角圆柱投影
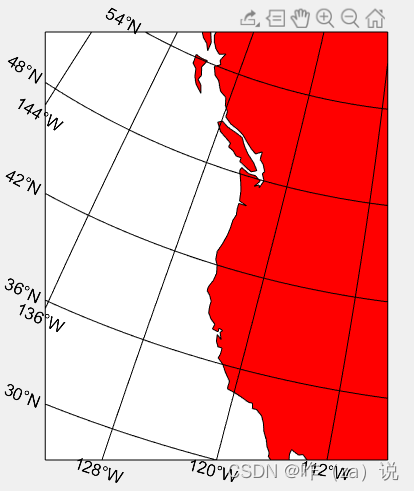
- 3.13 Oblique Mercator 倾斜 Mercator 投影
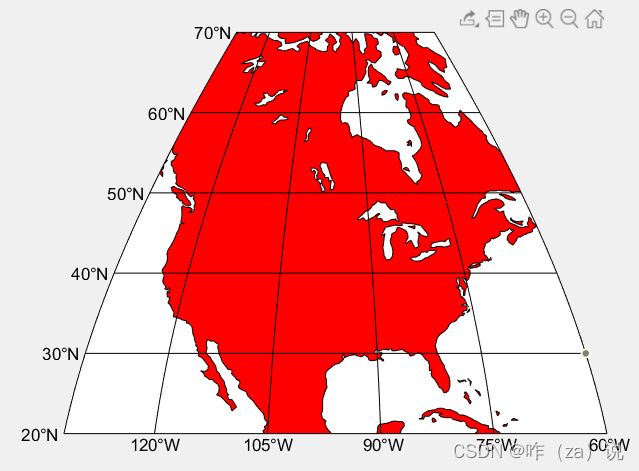
- 3.14 Transverse Mercator 横轴 Mercator 投影
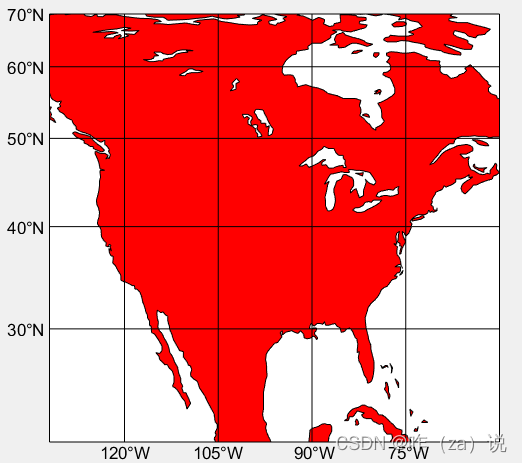
- 3.15 Sinusoidal 正弦曲线投影
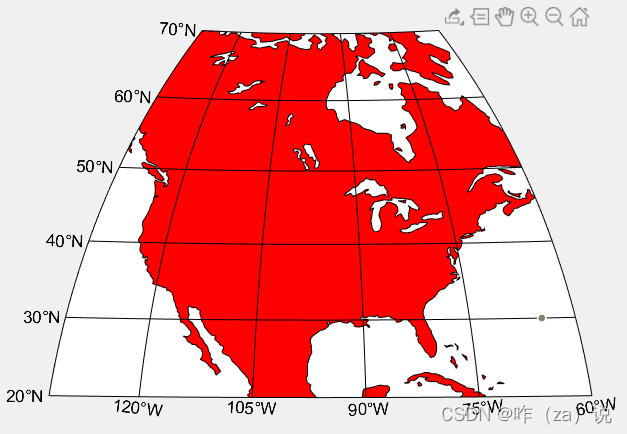
- 3.16 Gall-Peters 高尔-彼得斯投影
- 3.17 Hammer-Aitoff 埃托夫 (Aitoff) 投影
- 3.18 Mollweide 伪圆柱等面积投影
- 3.19 Robinson Robinson 投影
- 3.20 Kavrayski VII
- 3.21 UTM 通用横轴 Mercator 投影
- 4. 结语
0. 引言
上篇简述了m_map中所有函数及其功能,调用m_demo函数展示了m_map内置的15个示例。下面开始正式对各函数进行介绍。本篇介绍m_proj函数,该函数用于初始化投影方式,对绘制地学图件尤为重要。
地图投影是利用一定数学法则把地球表面的经、纬线转换到平面上的理论和方法。由于地球是一个赤道略宽两极略扁的不规则的梨形球体,故其表面是一个不可展平的曲面,所以运用任何数学方法进行这种转换都会产生误差和变形,为按照不同的需求缩小误差,就产生了各种投影方式。m_map中包含了几乎所有常见的投影方式。
1. 查看所有投影方式
在Matlab中执行m_proj('set')可以看到m_map支持的所有投影方式,如下:
>> m_proj('set')
     Stereographic 极射赤面投影法
     Orthographic 正射投影
     Azimuthal Equal-area 方位等面积投影
     Azimuthal Equidistant 等距方位投影
     Gnomonic 方位投影
     Satellite 卫星投影
     Albers Equal-Area Conic 圆锥等面积投影
     Lambert Conformal Conic Lambert 圆锥保角投影
     Mercator 墨卡托投影
     Miller Cylindrical  Miller 圆柱投影
     Equidistant Cylindrical 圆柱等距投影
     Cylindrical Equal-Area 等角圆柱投影
     Oblique Mercator 倾斜 Mercator 投影
     Transverse Mercator 横轴 Mercator 投影
     Sinusoidal 正弦曲线投影
     Gall-Peters 高尔-彼得斯投影
     Hammer-Aitoff 埃托夫 (Aitoff) 投影
     Mollweide 伪圆柱等面积投影
     Robinson Robinson 投影
     Kavrayski VII
     UTM 通用横轴 Mercator 投影
在m_proj('set')后面加上投影名称(proj_name)参数,可以看到每种投影所要输入的参数。由此就可以根据自己需要选择合适的投影方式开始绘图了。
m_proj('set',proj_name)
示例:
>> m_proj('set','Stereographic')
     'Stereographic'
     <,'lon<gitude>',center_long>
     <,'lat<itude>', center_lat>
     <,'rad<ius>', ( degrees | [longitude latitude] ) | 'alt<itude>', alt_frac >
     <,'rec<tbox>', ( 'on' | 'off' | 'circle' )>
     <,'rot<angle>', degrees CCW>
3. 各投影方式绘图示例
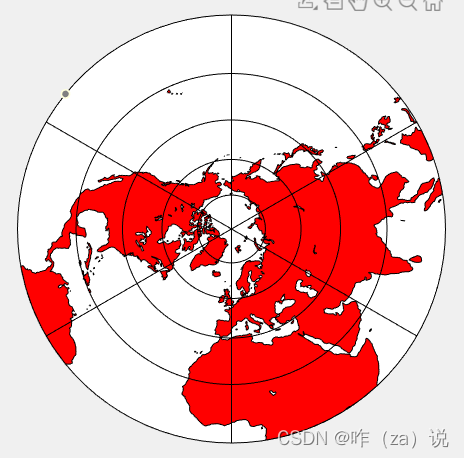
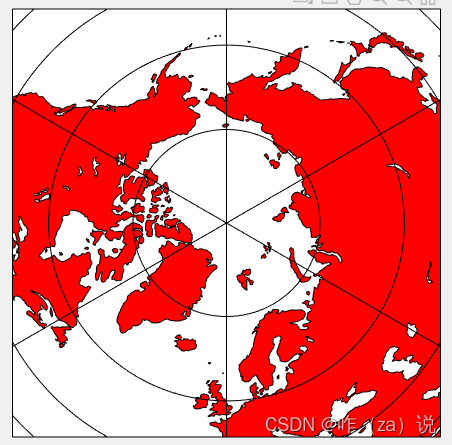
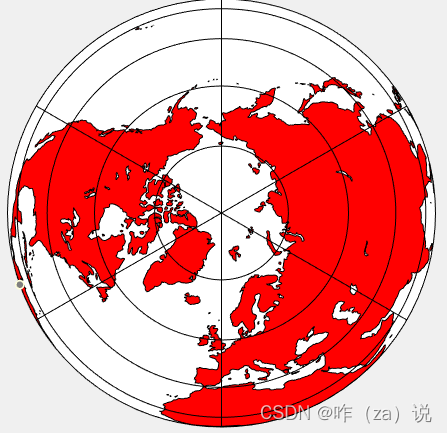
3.1 极射赤面投影法(Stereographic )
m_proj('set','Stereographic')
     'Stereographic'
     <,'lon<gitude>',center_long>  % 投影中心经纬度
     <,'lat<itude>', center_lat>
     <,'rad<ius>', ( degrees | [longitude latitude] ) | 'alt<itude>', alt_frac >
     <,'rec<tbox>', ( 'on' | 'off' | 'circle' )>    % 控制将图绘制到
     <,'rot<angle>', degrees CCW>
%% 示例代码
close all;clc;clear;
m_proj('stereographic','lon',0,'lat',90,'radius',90); %设置投影中心位置和半径
m_coast('patch','r');
m_grid('linest','-','xticklabels',[],'yticklabels',[]);
Stereographic 投影图示
3.2 Orthographic 正射投影示例
m_proj('set','Orthographic')
     'Orthographic'
     <,'lon<gitude>',center_long>
     <,'lat<itude>', center_lat>
     <,'rad<ius>', ( degrees | [longitude latitude] ) | 'alt<itude>', alt_frac >
     <,'rec<tbox>', ( 'on' | 'off' | 'circle' )>
     <,'rot<angle>', degrees CCW>
%% 示例代码
close all;clc;clear;
m_proj('Orthographic','lon',0,'lat',90,'radius',90,'rec','on'); %设置投影中心位置和半径
m_coast('patch','r');
m_grid('linest','-','xticklabels',[],'yticklabels',[]);
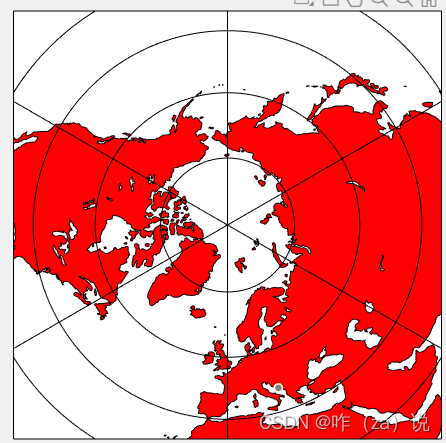
3.3 Azimuthal Equal-area 方位等面积投影
m_proj('set','Azimuthal Equal-area')
     'Azimuthal Equal-area'
     <,'lon<gitude>',center_long>
     <,'lat<itude>', center_lat>
     <,'rad<ius>', ( degrees | [longitude latitude] ) | 'alt<itude>', alt_frac >
     <,'rec<tbox>', ( 'on' | 'off' | 'circle' )>
     <,'rot<angle>', degrees CCW>
%% 示例代码
close all;clc;clear;
m_proj('Azimuthal Equal-area','lon',0,'lat',90,'radius',90,'rec','on'); %设置投影中心位置和半径
m_coast('patch','r');
m_grid('linest','-','xticklabels',[],'yticklabels',[]);
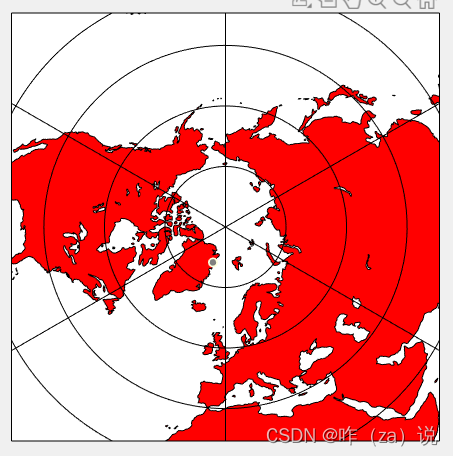
3.4 Azimuthal Equidistant 等距方位投影
m_proj('set','Azimuthal Equidistant')
     'Azimuthal Equidistant'
     <,'lon<gitude>',center_long>
     <,'lat<itude>', center_lat>
     <,'rad<ius>', ( degrees | [longitude latitude] ) | 'alt<itude>', alt_frac >
     <,'rec<tbox>', ( 'on' | 'off' | 'circle' )>
     <,'rot<angle>', degrees CCW>
%% 示例代码
close all;clc;clear;
m_proj('Azimuthal Equidistant','lon',0,'lat',90,'radius',90,'rec','on'); %设置投影中心位置和半径
m_coast('patch','r');
m_grid('linest','-','xticklabels',[],'yticklabels',[]);
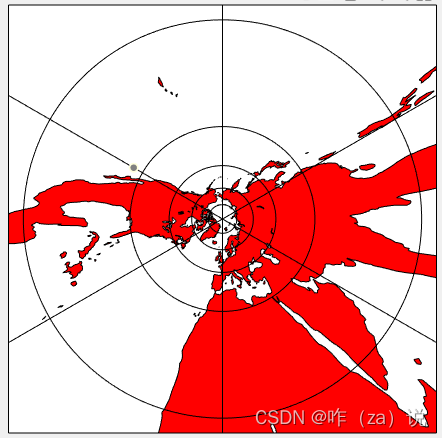
3.5 Gnomonic 方位投影
 m_proj('set','Gnomonic')
     'Gnomonic'
     <,'lon<gitude>',center_long>
     <,'lat<itude>', center_lat>
     <,'rad<ius>', ( degrees | [longitude latitude] ) | 'alt<itude>', alt_frac >
     <,'rec<tbox>', ( 'on' | 'off' | 'circle' )>
     <,'rot<angle>', degrees CCW>
%% 示例代码
close all;clc;clear;
m_proj('Gnomonic','lon',0,'lat',90,'radius',90,'rec','on'); %设置投影中心位置和半径
m_coast('patch','r');
m_grid('linest','-','xticklabels',[],'yticklabels',[]);
3.6 Satellite 卫星投影
m_proj('set','Satellite')
     'Satellite'
     <,'lon<gitude>',center_long>
     <,'lat<itude>', center_lat>
     <,'rad<ius>', ( degrees | [longitude latitude] ) | 'alt<itude>', alt_frac >
     <,'rec<tbox>', ( 'on' | 'off' | 'circle' )>
     <,'rot<angle>', degrees CCW>
%% 示例代码
close all;clc;clear;
m_proj('Satellite','lon',0,'lat',90,'radius',90,'rec','off'); %设置投影中心位置和半径
m_coast('patch','r');
m_grid('linest','-','xticklabels',[],'yticklabels',[]);
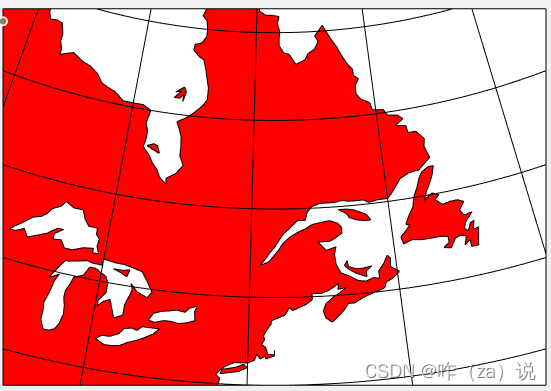
3.7 Albers Equal-Area Conic 圆锥等面积投影
m_proj('set','Albers Equal-Area Conic')
     'Albers Equal-Area Conic'
     <,'lon<gitude>',[min max]>
     <,'lat<itude>',[min max]>
     <,'clo<ngitude>',value>
     <,'par<allels>',[lat1 lat2]>
     <,'rec<tbox>', ( 'on' | 'off' )>
     <,'ell<ipsoid>', one of
         normal
         sphere
          grs80
          grs67
          wgs84
          wgs72
          wgs66
          wgs60
         clrk66
         clrk80
         intl24
         intl67
                               >
     <,'ori<gin>', [long lat]>
%% 示例代码
close all;clc;clear;
m_proj('albers equal-area','lat',[40 60],'long',[-90 -50],'rect','on','ell','wgs84'); % 输入经纬度范围、
m_coast('patch','r');
m_grid('linest','-','xticklabels',[],'yticklabels',[]);
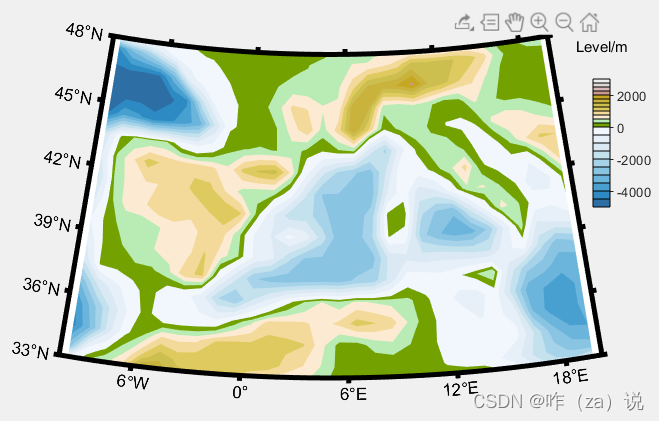
3.8 Lambert Conformal Conic Lambert 圆锥保角投影
m_proj('set','Lambert Conformal Conic')
     'Lambert Conformal Conic'
     <,'lon<gitude>',[min max]>
     <,'lat<itude>',[min max]>
     <,'clo<ngitude>',value>
     <,'par<allels>',[lat1 lat2]>
     <,'rec<tbox>', ( 'on' | 'off' )>
     <,'ell<ipsoid>', one of
         normal
         sphere
          grs80
          grs67
          wgs84
          wgs72
          wgs66
          wgs60
         clrk66
         clrk80
         intl24
         intl67
%% 示例代码
close all;clc;clear;
m_proj('lambert','lon',[-10 20],'lat',[33 48]);
[CS,CH]=m_etopo2('contourf',[-5000:500:0 250:250:3000],'edgecolor','none');
 m_grid('linestyle','none','tickdir','out','linewidth',3);

colormap([ m_colmap('blues',80); m_colmap('gland',48)]);
brighten(.5);

ax=m_contfbar(1,[.5 .8],CS,CH);
title(ax,{'Level/m',''}); % Move up by inserting a blank line
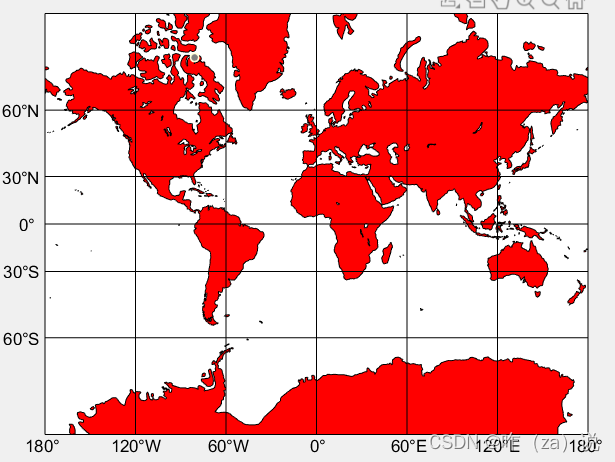
3.9 Mercator 墨卡托投影
m_proj('set','Mercator')
     'Mercator'
     <,'lon<gitude>',( [min max] | center)>
     <,'lat<itude>',( maxlat | [min max]>
     <,'sph<ere>', one of
         normal
         sphere
          grs80
          grs67
          wgs84
          wgs72
          wgs66
          wgs60
         clrk66
         clrk80
         intl24
         intl67
%% 示例代码
close all;clc;clear;
m_proj('Mercator','lon',[-180 180],'lat',[-80 80]); % 输入经纬度范围
m_coast('patch','r');
m_grid('linest','-','xticklabels',[],'yticklabels',[]);
3.10 Miller Cylindrical Miller 圆柱投影
m_proj('set','Miller Cylindrical')
     'Miller Cylindrical'
     <,'lon<gitude>',( [min max] | center)>
     <,'lat<itude>',( maxlat | [min max]>
     <,'sph<ere>', one of
         normal
         sphere
          grs80
          grs67
          wgs84
          wgs72
          wgs66
          wgs60
         clrk66
         clrk80
         intl24
         intl67
%% 示例代码
close all;clc;clear;
m_proj('miller','lat',[-77 77]); % 输入经纬度范围
m_coast('patch','r');
m_grid('linest','-','xticklabels',[],'yticklabels',[]);
3.11 Equidistant Cylindrical 圆柱等距投影
m_proj('set','Equidistant Cylindrical')
     'Equidistant Cylindrical'
     <,'lon<gitude>',( [min max] | center)>
     <,'lat<itude>',( maxlat | [min max]>
     <,'sph<ere>', one of
         normal
         sphere
          grs80
          grs67
          wgs84
          wgs72
          wgs66
          wgs60
         clrk66
         clrk80
         intl24
         intl67
%% 示例代码
close all;clc;clear;
m_proj('equidistant Cylindrical','lon',[-180 180],'lat',[-77 77]); % 输入经纬度范围
m_coast('patch','r');
m_grid('linest','-','xticklabels',[],'yticklabels',[]);
3.12 Cylindrical Equal-Area 等角圆柱投影
m_proj('set','Cylindrical Equal-Area')
     'Cylindrical Equal-Area'
     <,'lon<gitude>',( [min max] | center)>
     <,'lat<itude>',( maxlat | [min max]>
     <,'sph<ere>', one of
         normal
         sphere
          grs80
          grs67
          wgs84
          wgs72
          wgs66
          wgs60
         clrk66
         clrk80
         intl24
         intl67
%% 示例代码
close all;clc;clear;
m_proj('Cylindrical Equal-Area','lon',[-180 180],'lat',[-77 77]); % 输入经纬度范围
m_coast('patch','r');
m_grid('linest','-','xticklabels',[],'yticklabels',[]);
3.13 Oblique Mercator 倾斜 Mercator 投影
 m_proj('set','Oblique Mercator')
     'Oblique Mercator'
     <,'lon<gitude>',[value1 value2]>
     <,'lat<itude>',[value1 value2]>
     <,'asp<ect>',value>
     <,'dir<ection>',( 'horizontal' | 'vertical' )
%% 示例代码
close all;clc;clear;
m_proj('Oblique Mercator','lat',[56 30],'lon',[-132 -120],'aspect',.8); % 输入经纬度范围
m_coast('patch','r');
m_grid('linest','-','xticklabels',[],'yticklabels',[]);
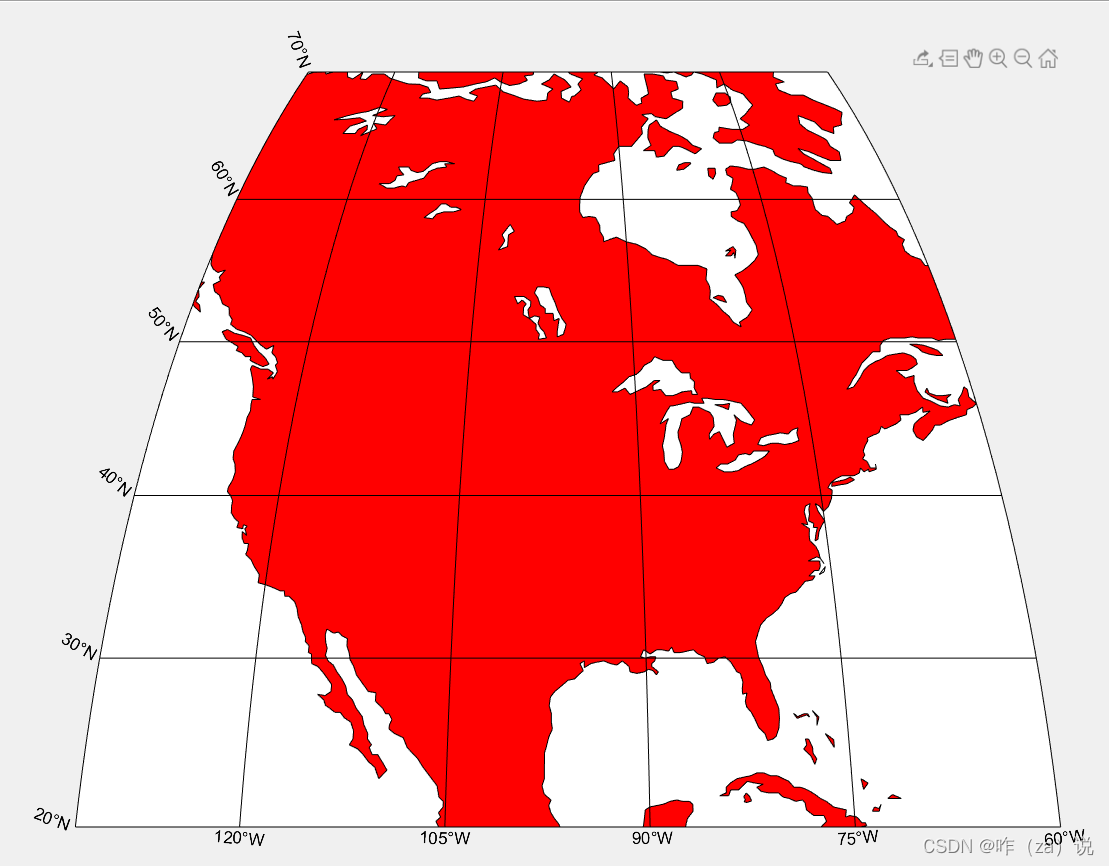
3.14 Transverse Mercator 横轴 Mercator 投影
m_proj('set','Transverse Mercator')
     'Transverse Mercator'
     <,'lon<gitude>',[min max]>
     <,'lat<itude>',[min max]>
     <,'clo<ngitude>',value>
     <,'rec<tbox>', ( 'on' | 'off' )>
%% 示例代码
close all;clc;clear;
m_proj('Transverse Mercator','lat',[20 70],'lon',[-132 -60],'rec','on'); % 输入经纬度范围
m_coast('patch','r');
m_grid('linest','-','xticklabels',[],'yticklabels',[]);
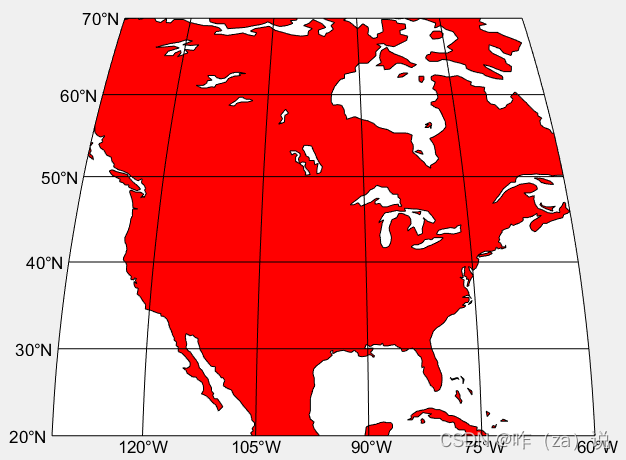
3.15 Sinusoidal 正弦曲线投影
m_proj('set','Sinusoidal')
     'Sinusoidal'
     <,'lon<gitude>',[min max]>
     <,'lat<itude>',[min max]>
     <,'clo<ngitude>',value>
     <,'rec<tbox>', ( 'on' | 'off' )>
%% 示例代码
close all;clc;clear;
m_proj('Sinusoidal','lat',[20 70],'lon',[-132 -60],'rec','on'); % 输入经纬度范围
m_coast('patch','r');
m_grid('linest','-','xticklabels',[],'yticklabels',[]);
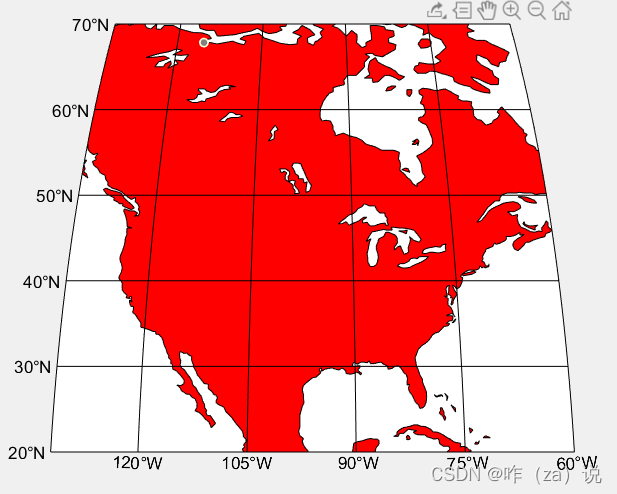
3.16 Gall-Peters 高尔-彼得斯投影
m_proj('set','Gall-Peters')
     'Gall-Peters'
     <,'lon<gitude>',[min max]>
     <,'lat<itude>',[min max]>
     <,'clo<ngitude>',value>
     <,'rec<tbox>', ( 'on' | 'off' )>
%% 示例代码
close all;clc;clear;
m_proj('Gall-Peters','lat',[20 70],'lon',[-132 -60],'rec','on'); % 输入经纬度范围
m_coast('patch','r');
m_grid('linest','-','xticklabels',[],'yticklabels',[]);
3.17 Hammer-Aitoff 埃托夫 (Aitoff) 投影
m_proj('set','Hammer-Aitoff')
     'Hammer-Aitoff'
     <,'lon<gitude>',[min max]>
     <,'lat<itude>',[min max]>
     <,'clo<ngitude>',value>
     <,'rec<tbox>', ( 'on' | 'off' )>
%% 示例代码
close all;clc;clear;
m_proj('Hammer-Aitoff','lat',[20 70],'lon',[-132 -60],'rec','off'); % 输入经纬度范围
m_coast('patch','r');
m_grid('linest','-','xticklabels',[],'yticklabels',[]);
3.18 Mollweide 伪圆柱等面积投影
m_proj('set','Mollweide')
     'Mollweide'
     <,'lon<gitude>',[min max]>
     <,'lat<itude>',[min max]>
     <,'clo<ngitude>',value>
     <,'rec<tbox>', ( 'on' | 'off' )>
%% 示例代码
close all;clc;clear;
m_proj('Mollweide','lat',[20 70],'lon',[-132 -60],'rec','off'); % 输入经纬度范围
m_coast('patch','r');
m_grid('linest','-','xticklabels',[],'yticklabels',[]);
3.19 Robinson Robinson 投影
m_proj('set','Robinson')
     'Robinson'
     <,'lon<gitude>',[min max]>
     <,'lat<itude>',[min max]>
     <,'clo<ngitude>',value>
     <,'rec<tbox>', ( 'on' | 'off' )>
%% 示例代码
close all;clc;clear;
m_proj('Robinson','lat',[20 70],'lon',[-132 -60],'rec','off'); % 输入经纬度范围
m_coast('patch','r');
m_grid('linest','-','xticklabels',[],'yticklabels',[]);
3.20 Kavrayski VII
m_proj('set','Kavrayski VII')
     'Kavrayski VII'
     <,'lon<gitude>',[min max]>
     <,'lat<itude>',[min max]>
     <,'clo<ngitude>',value>
     <,'rec<tbox>', ( 'on' | 'off' )>
%% 示例代码
close all;clc;clear;
m_proj('Kavrayski VII','lat',[20 70],'lon',[-132 -60],'rec','off'); % 输入经纬度范围
m_coast('patch','r');
m_grid('linest','-','xticklabels',[],'yticklabels',[]);
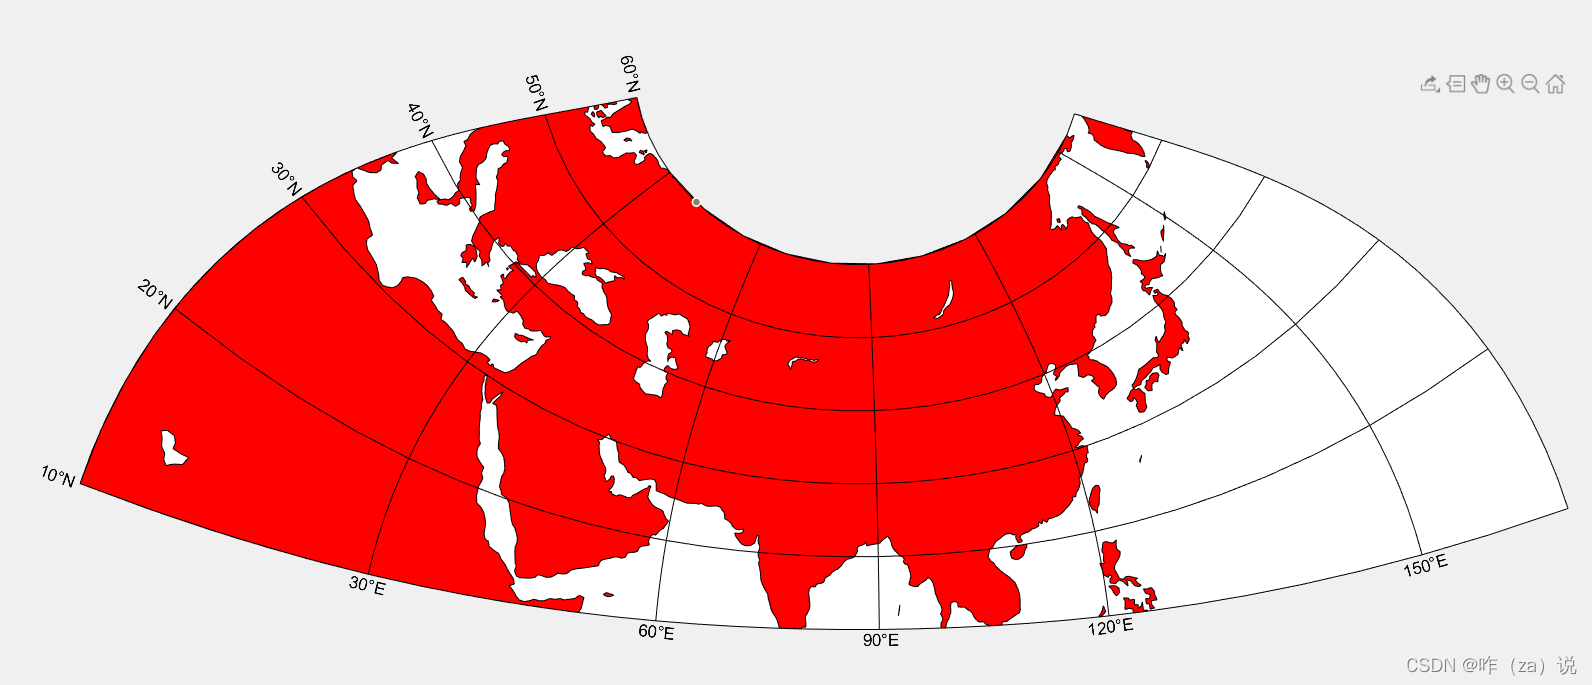
3.21 UTM 通用横轴 Mercator 投影
m_proj('set','UTM')
     'UTM'
     <,'lon<gitude>',[min max]>
     <,'lat<itude>',[min max]>
     <,'zon<e>',value>
     <,'hem<isphere>',[1|0] (0 for N)>
     <,'ell<ipsoid>', one of
         normal
         sphere
          grs80
          grs67
          wgs84
          wgs72
          wgs66
          wgs60
         clrk66
         clrk80
         intl24
         intl67
                               >
     <,'rec<tbox>', ( 'on' | 'off' )>
%% 示例代码
close all;clc;clear;
m_proj('utm','ellipse','grs80','zone',45,'lat',[10 60],'long',[10 160]); % 输入经纬度范围
m_coast('patch','r');
m_grid('linest','-','xticklabels',[],'yticklabels',[]);
4. 结语
本篇把m_map中所有投影方式都做了简单案例,有些参数没有进行尝试,在使用某种投影绘图前可以借助本篇的简单案例进行参数验证,或有助于绘制比较漂亮的图示。
😜
😜😜
😜😜😜😜
![[C++][数据结构][哈希表]详细讲解](https://img-blog.csdnimg.cn/direct/af08739c73c94f6ebec1d6d3d95a646b.png)