目录
- 一、引言
- 二、实例介绍
- 1.柱状图
- 1)简单柱状图
- 2)堆叠柱状图
- 2.线条形式
- 3.折线图(多子图)
- 4.散点图
- 5.水平和垂直线条
- 6.饼状图
- 1)饼状图
- 2)“条形饼”图
一、引言
matplotlib是一个用于绘制数据可视化的Python库。它可以创建各种静态、动态、交互式的图形,用于展示数据的分布、关系、趋势等。matplotlib提供了简单且灵活的API,使得用户能够轻松地根据自己的需求创建各种类型的图表。
matplotlib提供了多种绘图风格和图表类型,包括线图、散点图、柱状图、饼图、等高线图等。用户可以通过简单的命令来设置图表的标题、轴标签、图例等,还可以调整图表的大小、颜色、线型等。matplotlib还支持绘制3D图表和地图,并提供了丰富的图表样式和色彩主题。
matplotlib还与其他Python库紧密集成,如NumPy、pandas和scipy等,使得用户可以方便地在数据分析和科学计算的上下文中使用matplotlib绘制图表。此外,matplotlib还具有良好的文档和社区支持,用户可以轻松地找到大量示例代码和解决方案。
总之,matplotlib是一个功能强大、易于使用且高度可定制的数据可视化库,适用于各种数据分析和科学计算任务。无论是初学者还是专业人士,都可以借助matplotlib轻松地将数据可视化,从而更好地理解和传达数据。

二、实例介绍
在matplotlib中,常用的图形类型包括:
- 折线图(Line plot):用于展示数据随时间或其他连续变量发生变化的趋势。
- 散点图(Scatter plot):用于展示两个变量之间的关系,每个数据点用一个点表示。
- 柱状图(Bar plot):用于展示类别型变量的频次或总数之间的比较。
- 直方图(Histogram):用于展示连续变量的分布情况,将数据分成若干个区间,并计算每个区间中的数据个数或百分比。
- 饼图(Pie chart):用于展示类别型变量的占比情况,每个类别用扇形的面积表示。
- 箱线图(Box plot):用于展示连续变量的分布情况、异常值和离群点。
- 热力图(Heatmap):用于展示两个类别型变量之间的关系,通过颜色深浅来表示不同数值的大小。
- 3D图(3D plot):用于展示三维数据的分布情况,可以通过不同颜色或形状来表示不同数值或类别。
- 框图(Bar chart):用于展示类别型变量的数量或总数之间的比较,类似于柱状图,但可以包含多个类别变量的比较。
以上只是常用的一些图形类型,matplotlib还提供了更多的图形类型和样式选择,可以根据具体需求选择合适的图形。下面介绍集中常用的图形绘制方法。
1.柱状图
1)简单柱状图
这个示例展示了如何使用柱状图的颜色和标签参数来控制柱状图的颜色和图例条目。注意,前面带有下划线的标签不会显示在图例中。
import matplotlib.pyplot as plt
fig, ax = plt.subplots()
fruits = ['apple', 'blueberry', 'cherry', 'orange']
counts = [40, 100, 30, 55]
bar_labels = ['red', 'blue', '_red', 'orange']
bar_colors = ['tab:red', 'tab:blue', 'tab:red', 'tab:orange']
ax.bar(fruits, counts, label=bar_labels, color=bar_colors)
ax.set_ylabel('fruit supply')
ax.set_title('Fruit supply by kind and color')
ax.legend(title='Fruit color')
plt.show()

2)堆叠柱状图
这是一个使用柱状图创建堆叠条形图的示例。
import matplotlib.pyplot as plt
import numpy as np

# data from https://allisonhorst.github.io/palmerpenguins/

species = (
    "Adelie\n $\\mu=$3700.66g",
    "Chinstrap\n $\\mu=$3733.09g",
    "Gentoo\n $\\mu=5076.02g$",
)
weight_counts = {
    "Below": np.array([70, 31, 58]),
    "Above": np.array([82, 37, 66]),
}
width = 0.5

fig, ax = plt.subplots()
bottom = np.zeros(3)

for boolean, weight_count in weight_counts.items():
    p = ax.bar(species, weight_count, width, label=boolean, bottom=bottom)
    bottom += weight_count

ax.set_title("Number of penguins with above average body mass")
ax.legend(loc="upper right")

plt.show()

2.线条形式
简单的线条样式可以使用字符串 “solid”, “dotted”, “dashed” or “dashdot”.来定义。更精细的控制可以通过提供一个破折号元组(offset, (on_off_seq))来实现。例如,(0,(3,10,1,15))表示(3pt行,10pt空间,1pt行,15pt空间),没有偏移,而(5,(10,3))表示(10pt行,3pt空间),但跳过第一个5pt行。详见 Line2D.set_linestyle.
注意: 破折号样式也可以通过Line2D配置。如自定义虚线样式和使用关键字破折号将破折号序列列表传递给property_cycle中的循环器所示。
import matplotlib.pyplot as plt
import numpy as np

linestyle_str = [
     ('solid', 'solid'),      # Same as (0, ()) or '-'
     ('dotted', 'dotted'),    # Same as (0, (1, 1)) or ':'
     ('dashed', 'dashed'),    # Same as '--'
     ('dashdot', 'dashdot')]  # Same as '-.'

linestyle_tuple = [
     ('loosely dotted',        (0, (1, 10))),
     ('dotted',                (0, (1, 1))),
     ('densely dotted',        (0, (1, 1))),
     ('long dash with offset', (5, (10, 3))),
     ('loosely dashed',        (0, (5, 10))),
     ('dashed',                (0, (5, 5))),
     ('densely dashed',        (0, (5, 1))),

     ('loosely dashdotted',    (0, (3, 10, 1, 10))),
     ('dashdotted',            (0, (3, 5, 1, 5))),
     ('densely dashdotted',    (0, (3, 1, 1, 1))),

     ('dashdotdotted',         (0, (3, 5, 1, 5, 1, 5))),
     ('loosely dashdotdotted', (0, (3, 10, 1, 10, 1, 10))),
     ('densely dashdotdotted', (0, (3, 1, 1, 1, 1, 1)))]


def plot_linestyles(ax, linestyles, title):
    X, Y = np.linspace(0, 100, 10), np.zeros(10)
    yticklabels = []

    for i, (name, linestyle) in enumerate(linestyles):
        ax.plot(X, Y+i, linestyle=linestyle, linewidth=1.5, color='black')
        yticklabels.append(name)

    ax.set_title(title)
    ax.set(ylim=(-0.5, len(linestyles)-0.5),
           yticks=np.arange(len(linestyles)),
           yticklabels=yticklabels)
    ax.tick_params(left=False, bottom=False, labelbottom=False)
    ax.spines[:].set_visible(False)

    # For each line style, add a text annotation with a small offset from
    # the reference point (0 in Axes coords, y tick value in Data coords).
    for i, (name, linestyle) in enumerate(linestyles):
        ax.annotate(repr(linestyle),
                    xy=(0.0, i), xycoords=ax.get_yaxis_transform(),
                    xytext=(-6, -12), textcoords='offset points',
                    color="blue", fontsize=8, ha="right", family="monospace")


fig, (ax0, ax1) = plt.subplots(2, 1, figsize=(10, 8), height_ratios=[1, 3])

plot_linestyles(ax0, linestyle_str[::-1], title='Named linestyles')
plot_linestyles(ax1, linestyle_tuple[::-1], title='Parametrized linestyles')

plt.tight_layout()
plt.show()

3.折线图(多子图)
本案例介绍简单折线图,并以子图方式呈现。指定横纵坐标。
import matplotlib.pyplot as plt
import numpy as np

import matplotlib.gridspec as gridspec

fig = plt.figure(tight_layout=True)
gs = gridspec.GridSpec(2, 2)

ax = fig.add_subplot(gs[0, :])
ax.plot(np.arange(0, 1e6, 1000))
ax.set_ylabel('YLabel0')
ax.set_xlabel('XLabel0')

for i in range(2):
    ax = fig.add_subplot(gs[1, i])
    ax.plot(np.arange(1., 0., -0.1) * 2000., np.arange(1., 0., -0.1))
    ax.set_ylabel('YLabel1 %d' % i)
    ax.set_xlabel('XLabel1 %d' % i)
    if i == 0:
        ax.tick_params(axis='x', rotation=55)
fig.align_labels()  # same as fig.align_xlabels(); fig.align_ylabels()

plt.show()

4.散点图
散点图的演示与不同的标记颜色和大小。
import matplotlib.pyplot as plt
import numpy as np

import matplotlib.cbook as cbook

# Load a numpy record array from yahoo csv data with fields date, open, high,
# low, close, volume, adj_close from the mpl-data/sample_data directory. The
# record array stores the date as an np.datetime64 with a day unit ('D') in
# the date column.
price_data = cbook.get_sample_data('goog.npz')['price_data']
price_data = price_data[-250:]  # get the most recent 250 trading days

delta1 = np.diff(price_data["adj_close"]) / price_data["adj_close"][:-1]

# Marker size in units of points^2
volume = (15 * price_data["volume"][:-2] / price_data["volume"][0])**2
close = 0.003 * price_data["close"][:-2] / 0.003 * price_data["open"][:-2]

fig, ax = plt.subplots()
ax.scatter(delta1[:-1], delta1[1:], c=close, s=volume, alpha=0.5)

ax.set_xlabel(r'$\Delta_i$', fontsize=15)
ax.set_ylabel(r'$\Delta_{i+1}$', fontsize=15)
ax.set_title('Volume and percent change')

ax.grid(True)
fig.tight_layout()

plt.show()

5.水平和垂直线条
这个例子展示了函数hlines和vlines。
import matplotlib.pyplot as plt
import numpy as np

# Fixing random state for reproducibility
np.random.seed(19680801)

t = np.arange(0.0, 5.0, 0.1)
s = np.exp(-t) + np.sin(2 * np.pi * t) + 1
nse = np.random.normal(0.0, 0.3, t.shape) * s

fig, (vax, hax) = plt.subplots(1, 2, figsize=(12, 6))

vax.plot(t, s + nse, '^')
vax.vlines(t, [0], s)
# By using ``transform=vax.get_xaxis_transform()`` the y coordinates are scaled
# such that 0 maps to the bottom of the axes and 1 to the top.
vax.vlines([1, 2], 0, 1, transform=vax.get_xaxis_transform(), colors='r')
vax.set_xlabel('time (s)')
vax.set_title('Vertical lines demo')

hax.plot(s + nse, t, '^')
hax.hlines(t, [0], s, lw=2)
hax.set_xlabel('time (s)')
hax.set_title('Horizontal lines demo')

plt.show()

6.饼状图
1)饼状图
画一幅动物的饼状图,并在各部分贴上标签。要添加标签,将标签列表传递给labels参数
import matplotlib.pyplot as plt

labels = 'Frogs', 'Hogs', 'Dogs', 'Logs'
sizes = [15, 30, 45, 10]

fig, ax = plt.subplots()
ax.pie(sizes, labels=labels)

2)“条形饼”图
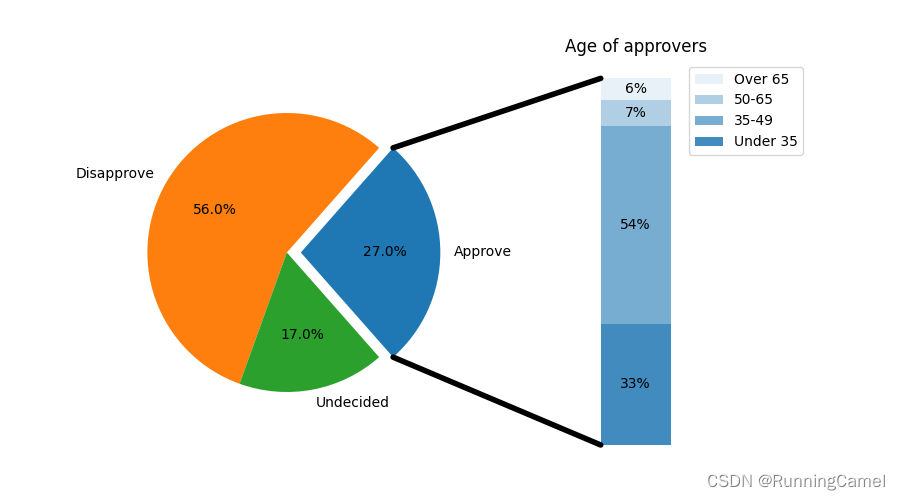
制作一个“条形饼”图,其中饼的第一个部分被“分解”成一个条形图,其中进一步细分了该部分的特征。该示例演示了使用具有多组轴的图形,并使用轴补丁列表添加两个ConnectionPatches以链接子图。
import matplotlib.pyplot as plt
import numpy as np

from matplotlib.patches import ConnectionPatch

# make figure and assign axis objects
fig, (ax1, ax2) = plt.subplots(1, 2, figsize=(9, 5))
fig.subplots_adjust(wspace=0)

# pie chart parameters
overall_ratios = [.27, .56, .17]
labels = ['Approve', 'Disapprove', 'Undecided']
explode = [0.1, 0, 0]
# rotate so that first wedge is split by the x-axis
angle = -180 * overall_ratios[0]
wedges, *_ = ax1.pie(overall_ratios, autopct='%1.1f%%', startangle=angle,
                     labels=labels, explode=explode)

# bar chart parameters
age_ratios = [.33, .54, .07, .06]
age_labels = ['Under 35', '35-49', '50-65', 'Over 65']
bottom = 1
width = .2

# Adding from the top matches the legend.
for j, (height, label) in enumerate(reversed([*zip(age_ratios, age_labels)])):
    bottom -= height
    bc = ax2.bar(0, height, width, bottom=bottom, color='C0', label=label,
                 alpha=0.1 + 0.25 * j)
    ax2.bar_label(bc, labels=[f"{height:.0%}"], label_type='center')

ax2.set_title('Age of approvers')
ax2.legend()
ax2.axis('off')
ax2.set_xlim(- 2.5 * width, 2.5 * width)

# use ConnectionPatch to draw lines between the two plots
theta1, theta2 = wedges[0].theta1, wedges[0].theta2
center, r = wedges[0].center, wedges[0].r
bar_height = sum(age_ratios)

# draw top connecting line
x = r * np.cos(np.pi / 180 * theta2) + center[0]
y = r * np.sin(np.pi / 180 * theta2) + center[1]
con = ConnectionPatch(xyA=(-width / 2, bar_height), coordsA=ax2.transData,
                      xyB=(x, y), coordsB=ax1.transData)
con.set_color([0, 0, 0])
con.set_linewidth(4)
ax2.add_artist(con)

# draw bottom connecting line
x = r * np.cos(np.pi / 180 * theta1) + center[0]
y = r * np.sin(np.pi / 180 * theta1) + center[1]
con = ConnectionPatch(xyA=(-width / 2, 0), coordsA=ax2.transData,
                      xyB=(x, y), coordsB=ax1.transData)
con.set_color([0, 0, 0])
ax2.add_artist(con)
con.set_linewidth(4)

plt.show()
E
N
D
!
\color{#4285f4}{\mathbf{E}}\color{#ea4335}{\mathbf{N}}\color{#fbbc05}{\mathbf{D}}\color{#4285f4}{\mathbf{!}}
END!

