读取文件
根据官网例子Using gsn_csm_contour_map to plot WRF-ARW data绘制:
; It shows how to use gsn_csm_xxxx scripts to do the plotting.
;
; You can use the map projection settings on the WRF file, or you
; can use your own map projection. See USE_WRF_MAP_PROJECTION below.
;----------------------------------------------------------------------
; Note: as of NCL V6.2.0, you don't need these four load commands
;----------------------------------------------------------------------
load "$NCARG_ROOT/lib/ncarg/nclscripts/csm/gsn_code.ncl"
load "$NCARG_ROOT/lib/ncarg/nclscripts/csm/gsn_csm.ncl"
load "$NCARG_ROOT/lib/ncarg/nclscripts/csm/contributed.ncl"
load "$NCARG_ROOT/lib/ncarg/nclscripts/wrf/WRFUserARW.ncl"

begin
;
; This indicates whether to use the native WRF projection on the WRF
; output file, or your own. Cylindricial equidistant is used in this
; example. If you want to change this, you will need to set any
; required map resources, especially those for zooming in on the map.
;
  USE_WRF_MAP_PROJECTION = True

;---Open file. You may need to include ".nc" at the end.
  filename = "/public/home/zhangzilu/Build_WRF/PWRF-4.3/run/out_2020/wrfout_d01_2020-04-15_00:00:00"
 a        = addfile(filename,"r")

  wks = gsn_open_wks("png","wrf_contour_map")   ; "ps", "pdf", "png"

;---Set some resources
  res                      = True
修改色标与图例
根据需求,自己定义色标颜色与levels,并打上标签:
res@cnLineLabelsOn       = False    ; turn off line labels
  res@gsnAddCyclic         = False    ; set to False if plotting regional data
 ; res@tiMainString         = filename
 ;res@cnFillPalette        = "OceanLakeLandSnow"
   gsn_define_colormap(wks,"OceanLakeLandSnow")
;---THESE VALUES WILL LIKELY NEED TO BE CHANGED OR COMMENTED
 res@cnLevelSelectionMode = "ExplicitLevels"   ; set explicit contour levels
  res@cnLevels    = (/1,5.,10.,50.,100.,200.,400.,600.,800.,1000.,1500.,2000.,2500.,3000.,3500/)   ; set levels
  res@cnFillOn    = True                        ; turn on color fill
  res@cnLinesOn   = False                       ; turn off the contour lines
  res@cnFillColors = (/2,5,18,34,50,66,82,98,114,130,146,162,178,194,210,226/)  ; set the colors to be used
  res@lbOrientation =   "horizontal"
  res@tmXBLabelFontHeightF    = 0.02     ;set the size of x-Axis words
  res@tmYLLabelFontHeightF    = 0.02    ;set the size of y-Axis words
  res@cnLevelSpacingF = 1
  res@lbLabelStride = 1
  res@lbLabelStride = 1;保证每个刻度色标标签显示
  res@pmTickMarkDisplayMode = "Always"
  res@pmLabelBarWidthF = 1.1
  res@lbLabelFontHeightF      = 0.015
绘图
if(USE_WRF_MAP_PROJECTION) then
;
; This function looks at the global attributes on the WRF output
; file and sets some map resources based on their values.
;
res = wrf_map_resources(a,res)
res@tfDoNDCOverlay = True ; No lat/lon coordinates required
else
hgt@lat2d = a->XLAT(nt,:,:) ; Lat/lon coordinates required
hgt@lon2d = a->XLONG(nt,:,:)
res@mpProjection = "CylindricalEquidistant" ; default for gsn_csm_contour_map
res@mpMinLatF = min(hgt@lat2d)
res@mpMaxLatF = max(hgt@lat2d)
res@mpMinLonF = min(hgt@lon2d)
res@mpMaxLonF = max(hgt@lon2d)
res@mpCenterLonF = (res@mpMinLonF + res@mpMaxLonF) / 2.
res@mpDataBaseVersion = "MediumRes" ; better map outlines
end if
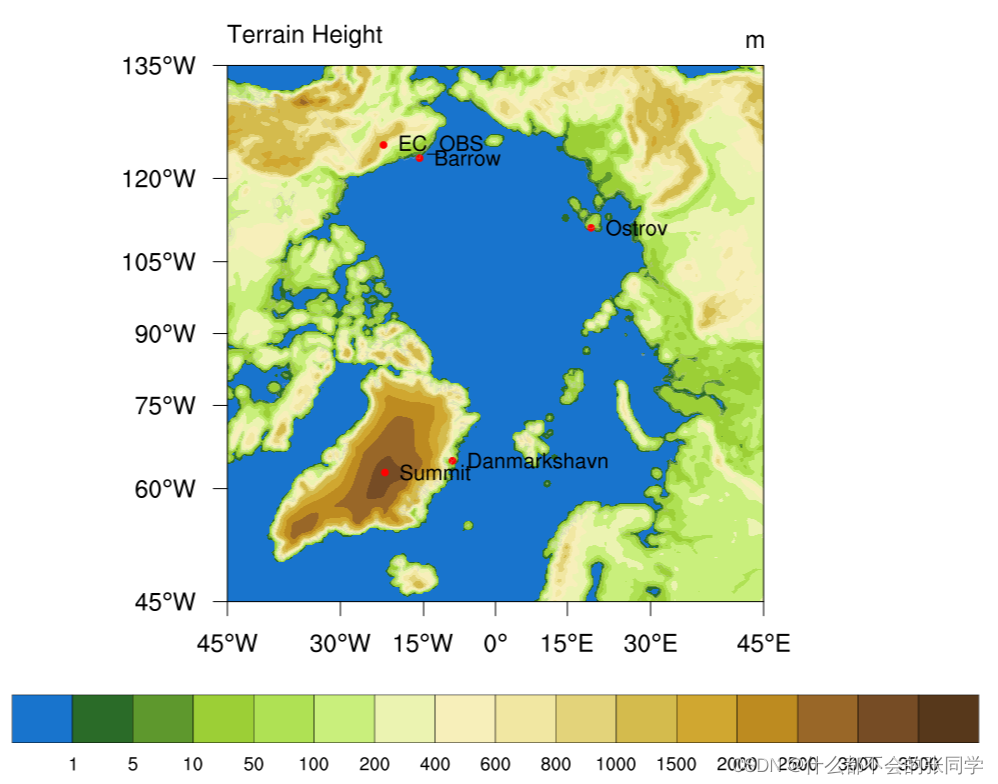
plot =gsn_csm_contour_map(wks,hgt,res)
添加站点与文本
添加站点时应当注意,需要先关闭之前绘制的等值线图,打完点后再绘制:
lata      = (/71.3,72.6,76.8,76,68.6/)
 lona      = (/-156.6,-38.5,-18.7,137.9,-149.3/)
 tstrs = (/"Barrow","Summit", "Danmarkshavn", "Ostrov","EC_OBS"/)
 res@gsnMaximize          = True     ; maximize plot in frame
  res@gsnDraw      = False                ; Don't draw plot
  res@gsnFrame     = False                ; Don't advance frame (page)
mkres               = True
   mkres@gsMarkerColor = "Red"
   txres = True
   mkres@gsMarkerIndex = 16 ; filled dot
   txres@txFontHeightF = 0.015
   txres@txJust        = "CenterLeft"

  mkid = gsn_add_polymarker(wks,plot,lona,lata,mkres)
  txid = gsn_add_text(wks,plot,"   " + tstrs,lona,lata,txres)
draw(plot)
 frame(wks);
绘图: