学习评分函数
想要通过逆向扩散从某个目标分布中抽样——其功能形式未知,我们只能通过抽样来学习——但这需要我们知道对应于目标分布的评分函数。知道评分函数,即这个分布对数的梯度,似乎等同于知道分布本身。我们如何学习评分函数呢?
定义评分学习的目标函数
首先,让我们写下一个合理的目标函数。假设我们有一些参数化的得分函数
s
θ
(
x
,
t
)
\mathbf{s}_{\boldsymbol{\theta}}(\mathbf{x}, t)
sθ(x,t),它依赖于一组参数
θ
\boldsymbol{\theta}
θ。我们希望准确地近似所有
x
\mathbf{x}
x值和所有t值的得分函数,因此我们可能尝试写下如下的目标函数:
J
(
θ
)
:
=
?
1
2
∫
d
x
d
t
[
s
θ
(
x
,
t
)
−
∇
x
log
p
(
x
,
t
)
]
2
.
J(\boldsymbol{\theta}) \stackrel{?}{:=} \frac{1}{2} \int d\mathbf{x} dt \ \left[ \mathbf{s}_{\boldsymbol{\theta}}(\mathbf{x}, t) - \nabla_{\mathbf{x}} \log p(\mathbf{x}, t) \right]^2 \ .
J(θ):=?21∫dxdt [sθ(x,t)−∇xlogp(x,t)]2 .
这个目标函数的问题在于它没有优先考虑任何特定的
x
\mathbf{x}
x值。我们特别感兴趣的是对高概率值的得分函数进行准确的近似,因此对上述目标函数的一个合理修改是:
J
(
θ
)
:
=
?
1
2
∫
d
x
d
t
p
(
x
,
t
)
[
s
θ
(
x
,
t
)
−
∇
x
log
p
(
x
,
t
)
]
2
.
J(\boldsymbol{\theta}) \stackrel{?}{:=} \frac{1}{2} \int d\mathbf{x} dt \ p(\mathbf{x}, t) \ \left[ \mathbf{s}_{\boldsymbol{\theta}}(\mathbf{x}, t) - \nabla_{\mathbf{x}} \log p(\mathbf{x}, t) \right]^2 \ .
J(θ):=?21∫dxdt p(x,t) [sθ(x,t)−∇xlogp(x,t)]2 .
类似地,我们可能会考虑添加一个不同时间的权重因子,因为得分函数偏离精确值的规模可能随时间变化:
J
n
a
i
v
e
(
θ
)
:
=
1
2
∫
d
x
d
t
λ
(
t
)
p
(
x
,
t
)
[
s
θ
(
x
,
t
)
−
∇
x
log
p
(
x
,
t
)
]
2
.
J_{naive}(\boldsymbol{\theta}) := \frac{1}{2} \int d\mathbf{x} dt \ \lambda(t) \ p(\mathbf{x}, t) \ \left[ \mathbf{s}_{\boldsymbol{\theta}}(\mathbf{x}, t) - \nabla_{\mathbf{x}} \log p(\mathbf{x}, t) \right]^2 \ .
Jnaive(θ):=21∫dxdt λ(t) p(x,t) [sθ(x,t)−∇xlogp(x,t)]2 .
这是一个完全合理的目标函数。但我们有一个重要问题:即很难估计
p
(
x
,
t
)
p(\mathbf{x}, t)
p(x,t)的对数的梯度,因为
p
(
x
,
t
)
p(\mathbf{x}, t)
p(x,t)可能强烈依赖于
p
(
x
,
0
)
p(\mathbf{x}, 0)
p(x,0)(即我们的目标分布)。而我们不知道我们的目标分布,这是我们做所有这些的原因!
此时,我们可以使用一个有趣的技巧。尽管上述目标函数相当合理,但它太难以处理;技巧是找到一个具有相同全局最小值的替代目标函数。这由下式提供:
J
m
o
d
(
θ
)
:
=
1
2
∫
d
x
d
x
(
0
)
d
t
p
(
x
,
t
∣
x
(
0
)
,
0
)
p
(
x
(
0
)
)
[
s
θ
(
x
,
t
)
−
∇
x
log
p
(
x
,
t
∣
x
(
0
)
,
0
)
]
2
.
J_{mod}(\boldsymbol{\theta}) := \frac{1}{2} \int d\mathbf{x} d\mathbf{x}^{(0)} dt \ p(\mathbf{x}, t | \mathbf{x}^{(0)}, 0) p(\mathbf{x}^{(0)}) \ \left[ \mathbf{s}_{\boldsymbol{\theta}}(\mathbf{x}, t) - \nabla_{\mathbf{x}} \log p(\mathbf{x}, t | \mathbf{x}^{(0)}, 0) \right]^2 \ .
Jmod(θ):=21∫dxdx(0)dt p(x,t∣x(0),0)p(x(0)) [sθ(x,t)−∇xlogp(x,t∣x(0),0)]2 .
注意到:
KaTeX parse error: {split} can be used only in display mode.
KaTeX parse error: {split} can be used only in display mode.
实际上,我们已经显示了更强的结果:这两个目标函数作为
θ
\boldsymbol{\theta}
θ的函数是相同的,仅相差一个加法常数。
现在我们的目标函数涉及到估计过渡概率对数的梯度,这通常可以通过我们对前向随机过程的了解解析地计算,因此是可用的。
我们将采用的目标函数是最后一个(我们将去掉“mod”下标,以赋予它额外的重要性):
KaTeX parse error: {split} can be used only in display mode.
使用样本近似目标函数
将目标函数或损失函数用期望值来表示的一个好处是,这提示了一种使用样本来近似它的清晰策略:我们可以采取蒙特卡洛类型的方法。
给定一个来自我们目标分布的样本
x
(
0
)
\mathbf{x}^{(0)}
x(0),我们可以做以下事情:
- 从 [0,T] 中均匀抽取一个时间 t。
- 利用我们对转移概率的了解,抽取 x ∼ p ( x , t ∣ x ( 0 ) , 0 ) \mathbf{x} \sim p(\mathbf{x}, t | \mathbf{x}^{(0)}, 0) x∼p(x,t∣x(0),0)。
- 利用我们对转移概率的了解,计算我们样本的 ∇ x log p ( x , t ∣ x ( 0 ) , 0 ) \nabla_{\mathbf{x}} \log p(\mathbf{x}, t | \mathbf{x}^{(0)}, 0) ∇xlogp(x,t∣x(0),0) 。
然后我们就得到了一个近似值
J
(
θ
)
≈
1
2
λ
(
t
)
[
s
θ
(
x
,
t
)
−
∇
x
log
p
(
x
,
t
∣
x
(
0
)
,
0
)
]
2
.
J(\boldsymbol{\theta}) \approx \frac{1}{2} \lambda(t) \left[ \ \mathbf{s}_{\boldsymbol{\theta}}(\mathbf{x}, t) - \nabla_{\mathbf{x}} \log p(\mathbf{x}, t | \mathbf{x}^{(0)}, 0) \ \right]^2 \ .
J(θ)≈21λ(t)[ sθ(x,t)−∇xlogp(x,t∣x(0),0) ]2 .
更一般地,如果我们有一批 S 个样本,我们可以对每一个样本都遵循这个程序来构建近似值
J
(
θ
)
≈
1
2
S
∑
j
=
1
S
λ
(
t
j
)
[
s
θ
(
x
j
,
t
j
)
−
∇
x
log
p
(
x
j
,
t
∣
x
j
(
0
)
,
0
)
]
2
.
J(\boldsymbol{\theta}) \approx \frac{1}{2 S} \sum_{j = 1}^S \lambda(t_j) \left[ \ \mathbf{s}_{\boldsymbol{\theta}}(\mathbf{x}_j, t_j) - \nabla_{\mathbf{x}} \log p(\mathbf{x}_j, t | \mathbf{x}^{(0)}_j, 0) \ \right]^2 \ .
J(θ)≈2S1∑j=1Sλ(tj)[ sθ(xj,tj)−∇xlogp(xj,t∣xj(0),0) ]2 .
幸运的是,对于我们将要使用的解析可行的前向过程,过渡概率的对数通常具有特别简单的形式。例如,对于 VE SDE(见第2节),其定义是通过
x
˙
=
d
[
σ
2
(
t
)
]
d
t
η
(
t
)
,
\dot{\mathbf{x}} = \sqrt{ \frac{d[ \sigma^2(t) ]}{dt} } \ \boldsymbol{\eta}(t) \ ,
x˙=dtd[σ2(t)] η(t) ,
相应的转移概率是
KaTeX parse error: {split} can be used only in display mode.
所以过渡概率的对数的梯度是
∇
x
log
p
(
x
,
t
∣
x
(
0
)
,
0
)
=
−
[
x
−
x
(
0
)
]
σ
2
(
t
)
.
\nabla_{\mathbf{x}} \log p(\mathbf{x}, t | \mathbf{x}^{(0)}, 0) = - \frac{\left[ \mathbf{x} - \mathbf{x}^{(0)} \right]}{\sigma^2(t)} \ .
∇xlogp(x,t∣x(0),0)=−σ2(t)[x−x(0)] .
现在我们可以近似地评估损失函数了,我们可以让计算机来处理梯度……剩下的就是计算时间了**!
** 还有大量大量的实现细节
通过深度神经网络进行函数近似
现在我们有了一个定义明确的优化问题和一个解决它的直接算法,我们可以使用各种工具来使问题的解决更加可行。由于我们需要构建评分函数的某种参数化近似,(深度)神经网络就是这样一种工具。
这种跳到神经网络的做法并不需要对我们上面概述的图景进行任何实质性的概念改变。将神经网络作为评分函数的近似器加入实际上是相当简单的。
我们上面定义的目标函数涉及到在样本
x
\mathbf{x}
x 和
x
(
0
)
\mathbf{x}^{(0)}
x(0) 上评估
∇
x
log
p
(
x
,
t
∣
x
(
0
)
,
0
)
\nabla_{\mathbf{x}} \log p(\mathbf{x}, t | \mathbf{x}^{(0)}, 0)
∇xlogp(x,t∣x(0),0)。当我们有转移概率的封闭形式表达式时,这是最简单的。
混合高斯分布拟合
前面部分的介绍已经把话题推导到了,可以用评分函数来表示函数,并用学习函数提督下降方式来求解函数。那么接下来问题就是我们要用什么具体的表达形式来拟合模型,是用混合高斯、还是狄立克拉分布、还是其他什么函数来拟合。对于扩散模型前面已经介绍了到最后就是对高斯的去噪,所以选择混合高斯来拟合模型是个好选项。这部分就是介绍混合高斯:
1.混合高斯介绍
2.混合高斯扩散过程
3.混合高斯逆扩散过程
4.混合高斯评分函数拟合求解
我们首先选择一个简单但表达力强的模型作为我们的toy model——
n
n
n维的高斯混合模型。
简单性
- 密度和得分都可以通过解析途径轻松计算和评估。
- 在扩散过程中,高斯混合保持为高斯混合。
表现力
- 如我们所知,只要有足够的高斯波峰,你就可以近似任何分布。
- 更进一步,任何点云的高斯核密度估计都是高斯混合!
p
(
x
)
=
∑
i
k
π
i
f
(
x
;
μ
i
,
Σ
i
)
p(x)=\sum_i^k\pi_i f(x;\mu_i,\Sigma_i)
p(x)=∑ikπif(x;μi,Σi)
让 f 表示n维多元高斯的密度。
f
(
x
;
μ
,
Σ
)
=
(
(
2
π
)
n
det
Σ
)
−
1
/
2
exp
(
−
1
2
(
x
−
μ
)
T
Σ
−
1
(
x
−
μ
)
)
f(x;\mu,\Sigma)=((2\pi)^n\det\Sigma)^{-1/2}\exp(-\frac12(x-\mu)^T\Sigma^{-1}(x-\mu))
f(x;μ,Σ)=((2π)ndetΣ)−1/2exp(−21(x−μ)TΣ−1(x−μ))
权重
∑
i
π
i
=
1
\sum_i\pi_i=1
∑iπi=1
解析推导得分函数
让我们简写
f
i
(
x
)
:
=
f
(
x
;
μ
i
,
Σ
i
)
f_i(x):=f(x;\mu_i,\Sigma_i)
fi(x):=f(x;μi,Σi) 为分量i的高斯密度
$\log p(x)=\log \sum_i\pi_i f_i(x)\
<
b
r
/
>
得分函数表述如下
<
b
r
/
>
<br />得分函数表述如下<br />
<br/>得分函数表述如下<br/>\nabla_x \log p(x)=\frac{\sum_i\pi_i \nabla_x f_i(x)}{\sum_i\pi_i f_i(x)}\
=-\frac{\sum_i\pi_i f_i(x)\Sigma_i^{-1}(x-\mu_i)}{\sum_i\pi_i f_i(x)}\
=\sum_i w_i\nabla \log f_i(x)$
它是每个高斯的对数密度梯度的加权平均值
∇
log
f
i
(
x
)
=
−
Σ
i
−
1
(
x
−
μ
i
)
\nabla \log f_i(x)=-\Sigma_i^{-1}(x-\mu_i)
∇logfi(x)=−Σi−1(x−μi), 按每个分量的参与度加权
π
i
f
i
(
x
)
\pi_i f_i(x)
πifi(x).
权重,
w
i
=
π
i
f
i
(
x
)
∑
j
π
j
f
j
(
x
)
=
p
(
x
∣
z
=
i
)
p
(
z
=
i
)
p
(
x
)
=
p
(
z
=
i
∣
x
)
w_i=\frac{\pi_i f_i(x)}{\sum_j\pi_j f_j(x)}=\frac{p(x|z=i)p(z=i)}{p(x)}=p(z=i|x)
wi=∑jπjfj(x)πifi(x)=p(x)p(x∣z=i)p(z=i)=p(z=i∣x).
定义高斯混合模型
import numpy as np
import seaborn as sns
import matplotlib.pyplot as plt
from scipy.stats import multivariate_normal

class GaussianMixture:
  def __init__(self, mus, covs, weights):
    """
    mus: a list of K 1d np arrays (D,)
    covs: a list of K 2d np arrays (D, D)
    weights: a list or array of K unnormalized non-negative weights, signifying the possibility of sampling from each branch.
      They will be normalized to sum to 1. If they sum to zero, it will err.
    """
    self.n_component = len(mus)
    self.mus = mus
    self.covs = covs
    self.precs = [np.linalg.inv(cov) for cov in covs]
    self.weights = np.array(weights)
    self.norm_weights = self.weights / self.weights.sum()
    self.RVs = []
    for i in range(len(mus)):
      self.RVs.append(multivariate_normal(mus[i], covs[i]))
    self.dim = len(mus[0])

  def add_component(self, mu, cov, weight=1):
    self.mus.append(mu)
    self.covs.append(cov)
    self.precs.append(np.linalg.inv(cov))
    self.RVs.append(multivariate_normal(mu, cov))
    self.weights.append(weight)
    self.norm_weights = self.weights / self.weights.sum()
    self.n_component += 1

  def pdf(self, x):
    """
      probability density (PDF) at $x$.
    """
    component_pdf = np.array([rv.pdf(x) for rv in self.RVs]).T
    prob = np.dot(component_pdf, self.norm_weights)
    return prob

  def score(self, x):
    """
    Compute the score $\nabla_x \log p(x)$ for the given $x$.
    """
    component_pdf = np.array([rv.pdf(x) for rv in self.RVs]).T
    weighted_compon_pdf = component_pdf * self.norm_weights[np.newaxis, :]
    participance = weighted_compon_pdf / weighted_compon_pdf.sum(axis=1, keepdims=True)

    scores = np.zeros_like(x)
    for i in range(self.n_component):
      gradvec = - (x - self.mus[i]) @ self.precs[i]
      scores += participance[:, i:i+1] * gradvec

    return scores

  def score_decompose(self, x):
    """
    Compute the grad to each branch for the score $\nabla_x \log p(x)$ for the given $x$.
    """
    component_pdf = np.array([rv.pdf(x) for rv in self.RVs]).T
    weighted_compon_pdf = component_pdf * self.norm_weights[np.newaxis, :]
    participance = weighted_compon_pdf / weighted_compon_pdf.sum(axis=1, keepdims=True)

    gradvec_list = []
    for i in range(self.n_component):
      gradvec = - (x - self.mus[i]) @ self.precs[i]
      gradvec_list.append(gradvec)
      # scores += participance[:, i:i+1] * gradvec

    return gradvec_list, participance

  def sample(self, N):
    """ Draw N samples from Gaussian mixture
    Procedure:
      Draw N samples from each Gaussian
      Draw N indices, according to the weights.
      Choose sample between the branches according to the indices.
    """
    rand_component = np.random.choice(self.n_component, size=N, p=self.norm_weights)
    all_samples = np.array([rv.rvs(N) for rv in self.RVs])
    gmm_samps = all_samples[rand_component, np.arange(N),:]
    return gmm_samps, rand_component, all_samples


def quiver_plot(pnts, vecs, *args, **kwargs):
  plt.quiver(pnts[:, 0], pnts[:,1], vecs[:, 0], vecs[:, 1], *args, **kwargs)

def kdeplot(pnts, label="", ax=None, titlestr=None, **kwargs):
  if ax is None:
    ax = plt.gca()#figh, axs = plt.subplots(1,1,figsize=[6.5, 6])
  sns.kdeplot(x=pnts[:,0], y=pnts[:,1], ax=ax, label=label, **kwargs)
  if titlestr is not None:
    ax.set_title(titlestr)

def visualize_diffusion_distr(x_traj_rev, leftT=0, rightT=-1, explabel=""):
  if rightT == -1:
    rightT = x_traj_rev.shape[2]-1
  figh, axs = plt.subplots(1,2,figsize=[12,6])
  sns.kdeplot(x=x_traj_rev[:,0,leftT], y=x_traj_rev[:,1,leftT], ax=axs[0])
  axs[0].set_title("Density of Gaussian Prior of $x_T$\n before reverse diffusion")
  plt.axis("equal")
  sns.kdeplot(x=x_traj_rev[:,0,rightT], y=x_traj_rev[:,1,rightT], ax=axs[1])
  axs[1].set_title(f"Density of $x_0$ samples after {rightT} step reverse diffusion")
  plt.axis("equal")
  plt.suptitle(explabel)
  return figh

mu1 = np.array([0,1.0])
Cov1 = np.array([[1.0,0.0],
          [0.0,1.0]])
mu2 = np.array([2.0,-1.0])
Cov2 = np.array([[2.0,0.5],
          [0.5,1.0]])

RV1 = multivariate_normal(mu1, Cov1)
RV2 = multivariate_normal(mu2, Cov2)

# mean and covariance of the 1,2,3 Gaussian branch.
mu1 = np.array([0,1.0])
Cov1 = np.array([[1.0,0.0],
          [0.0,1.0]])

mu2 = np.array([2.0,-1.0])
Cov2 = np.array([[2.0,0.5],
          [0.5,1.0]])

gmm = GaussianMixture([mu1,mu2],[Cov1,Cov2],[1.0,1.0])

gmm_samps, rand_component, component_samples = gmm.sample(5000)
scorevecs = gmm.score(gmm_samps)
上面代码是一个使用Python实现高斯混合模型(Gaussian Mixture Model, GMM)的实现。下面我将对代码的主要部分进行解释:
GaussianMixture类:
- 初始化函数
__init__接受均值mus、协方差矩阵covs和权重weights作为参数,用于初始化GMM的组件。 add_component方法用于向GMM中添加一个新的高斯组件。pdf方法计算给定数据点x在GMM下的概率密度函数值。score方法计算给定数据点x在GMM下的梯度(score)。score_decompose方法计算给定数据点x在每个高斯组件下的梯度以及对应的权重。sample方法从GMM中采样N个数据点。
quiver_plot函数:
- 使用
plt.quiver绘制向量场,用于可视化梯度。
kdeplot函数:
- 使用
sns.kdeplot绘制数据点的核密度估计图。
visualize_diffusion_distr函数:
- 可视化扩散过程中的数据分布,包括扩散前的高斯先验分布和扩散后的样本分布。
- 主程序部分:
- 定义了两个高斯分布
RV1和RV2,分别具有不同的均值和协方差矩阵。 - 创建了一个包含两个高斯组件的GMM实例
gmm。 - 从
gmm中采样5000个数据点,并计算这些数据点在GMM下的梯度(score)。
这份代码实现了一个基本的高斯混合模型,并提供了一些辅助函数用于可视化和分析。通过创建GMM实例,可以对数据进行建模,并使用采样和梯度计算等操作来探索和分析数据的特征。
利用上面代码实现的测试例子现在我们得到了一些变量:
scorevecs:每个数据点 x x x的向量 ∇ x log p ( x ) \nabla_x \log p(x) ∇xlogp(x)。gmm_samps:形状为(N,2),从高斯混合模型中采样的数据点。rand_component:形状为(N,),数据来源的分支。all_samples:形状为(2,N,2),两个组件。
我们先来看看密度
figh, ax = plt.subplots(1,1,figsize=[6,6])
kdeplot(component_samples[0,:,:], label="comp1", )
kdeplot(component_samples[1,:,:], label="comp2", )
plt.title("Empirical density of each component")
plt.legend()
plt.axis("image");

figh, ax = plt.subplots(1,1,figsize=[6,6])
kdeplot(gmm_samps, )
plt.title("Empirical density of Gaussian mixture density")
plt.axis("image");
混合高斯概率可视化呈现
得分函数可视化
现在让我们来检查一下得分向量场的组成,以便获得一些直觉。我们想要进行可视化
- ∇ log f i ( x ) \nabla \log f_i(x) ∇logfi(x)
- w i ∇ log f i ( x ) w_i\nabla \log f_i(x) wi∇logfi(x), 其中 w i w_i wi是从参与度计算出的权重
- w i = π i f i ( x ) / ∑ j ( π j f j ( x ) ) w_i=\pi_i f_i(x)/\sum_j(\pi_j f_j(x)) wi=πifi(x)/∑j(πjfj(x))
- ∇ p ( x ) \nabla p(x) ∇p(x)
plt.figure(figsize=[8,8])
quiver_plot(gmm_samps, scorevecs)
plt.title("Score vector field $\log p(x)$")
plt.axis("image");

gmm_samps_few, _, _ = gmm.sample(1000)
scorevecs_few = gmm.score(gmm_samps_few)
gradvec_list, participance = gmm.score_decompose(gmm_samps_few)
混合高斯各分高斯得分函数可视化
plt.figure(figsize=[8,8])
quiver_plot(gmm_samps_few, gradvec_list[0]*participance[:,0:1], color="blue", alpha=0.4, scale=15, label="weighted score of gauss mode1")
quiver_plot(gmm_samps_few, gradvec_list[1]*participance[:,1:2], color="orange", alpha=0.4, scale=15, label="weighted score of gauss mode2")
quiver_plot(gmm_samps_few, scorevecs_few, scale=15, alpha=0.7, width=0.003, label="score of GMM")
plt.title("Score vector field $\log p(x)$")
plt.axis("image");
plt.legend();

混合高斯扩散模型
(正向)扩散过程
连续版本:扩散的随机微分方程
d
x
=
σ
t
d
w
,
t
∈
[
0
,
1
]
d \mathbf{x} = \sigma^t d\mathbf{w}, \quad t\in[0,1]
dx=σtdw,t∈[0,1]
离散版本:扩散的马尔可夫过程
x
t
+
Δ
t
=
x
t
+
σ
t
Δ
t
z
t
\mathbf{x_{t+\Delta t}} = \mathbf{x_{t}}+\sigma^t \sqrt{\Delta t} z_t
xt+Δt=xt+σtΔtzt
x(1)的最终分布将会大致是
N
(
x
;
0
,
σ
2
−
1
2
log
σ
I
)
\mathbf{N}\bigg(\mathbf{x}; \mathbf{0}, \frac{\sigma^2 - 1}{2 \log \sigma}\mathbf{I}\bigg)
N(x;0,2logσσ2−1I)
扩散过程中的概率密度
更准确地说,对于一个高斯混合模型
{
π
i
,
μ
i
,
Σ
i
}
\{\pi_i,\mu_i,\Sigma_i\}
{πi,μi,Σi},经过 t 时间的扩散后,累积的噪声分布将会是
N
(
x
;
0
,
σ
2
t
−
1
2
log
σ
I
)
\mathbf{N}\bigg(\mathbf{x}; \mathbf{0}, \frac{\sigma^{2t} - 1}{2 \log \sigma}\mathbf{I}\bigg)
N(x;0,2logσσ2t−1I)
那么在时间 t 的确切密度将是一个具有参数的高斯混合模型
{
π
i
,
μ
i
,
Σ
i
(
t
)
}
\{\pi_i,\mu_i,\Sigma_i^{(t)}\}
{πi,μi,Σi(t)}, 其中
Σ
i
(
t
)
=
Σ
i
+
σ
2
t
−
1
2
log
σ
I
\Sigma_i^{(t)}=\Sigma_i+\frac{\sigma^{2t} - 1}{2 \log \sigma}I
Σi(t)=Σi+2logσσ2t−1I
我们可以将时间 t 时 x 的边际密度命名为
p
t
(
x
)
p_t(x)
pt(x)。让我们简称为
β
t
2
=
σ
2
t
−
1
2
log
σ
\beta_t^2=\frac{\sigma^{2t} - 1}{2 \log \sigma}
βt2=2logσσ2t−1, 是边际噪声的方差。
利用这种分析性质,让我们定义一个函数diffuse_gmm,将t=0时的gmm转化为t=t’时的gmm。
def marginal_prob_std(t, sigma):
    """Note that this std -> 0, when t->0
  So it's not numerically stable to sample t=0 in the dataset
  Note an earlier version missed the sqrt...
  """
    return torch.sqrt( (sigma**(2*t) - 1) / 2 / torch.log(torch.tensor(sigma)) ) # sqrt fixed Jun.19

def marginal_prob_std_np(t, sigma):
    return np.sqrt( (sigma**(2*t) - 1) / 2 / np.log(sigma) )

def diffuse_gmm(gmm, t, sigma):
  lambda_t = marginal_prob_std_np(t, sigma)**2 # variance
  noise_cov = np.eye(gmm.dim) * lambda_t
  covs_dif = [cov + noise_cov for cov in gmm.covs]
  return GaussianMixture(gmm.mus, covs_dif, gmm.weights)


x0, _, _ = gmm.sample(1000)

sigma = 5
nsteps = 200

x_traj = np.zeros((*x0.shape, nsteps, ))
x_traj[:,:,0] = x0
dt = 1 / nsteps
for i in range(1, nsteps):
  t = i * dt
  eps_z = np.random.randn(*x0.shape)
  x_traj[:,:,i] = x_traj[:,:,i-1] + eps_z * (sigma ** t) * np.sqrt(dt)

figh, axs = plt.subplots(1,2,figsize=[12,6])
sns.kdeplot(x=x_traj[:,0,0], y=x_traj[:,1,0], ax=axs[0])
axs[0].set_title("Density of Target distribution of $x_0$")
plt.axis("equal")
sns.kdeplot(x=x_traj[:,0,-1], y=x_traj[:,1,-1], ax=axs[1])
axs[1].set_title(f"Density of $x_T$ samples after {nsteps} step diffusion")
plt.axis("equal");

figh, ax = plt.subplots(1,1,figsize=[6,6])
plt.plot(x_traj[:,0,:].T,x_traj[:,1,:].T,alpha=0.20,)
plt.title("Diffusion trajectories")
plt.axis("image")
plt.show()
上面代码高斯混合模型(Gaussian Mixture Model, GMM)的扩散过程。代码主要分为几个部分:函数定义、模拟数据生成、数据扩散和可视化。下面是对每部分的详细解释:
函数定义
**marginal_prob_std**** 和 ****marginal_prob_std_np**:
这两个函数计算给定时间t和扩散系数sigma下的标准差。这里的标准差是用于后续计算高斯扩散过程中噪声的方差。两个函数基本相同,只是一个使用 PyTorch 库,另一个使用 NumPy 库。**diffuse_gmm**:
这个函数用于模拟给定时间t下的高斯混合模型的扩散。它首先计算此时的方差(使用marginal_prob_std_np函数),然后将这个方差加到 GMM 的每个组成部分的协方差矩阵上,从而得到扩散后的新 GMM。
模拟数据生成
- 代码首先从 GMM 中采样出初始数据
x0。 - 设置扩散系数
sigma和扩散步数nsteps。
数据扩散过程
- 初始化一个三维数组
x_traj来存储每一步扩散后的数据。第一维和第二维是数据点的坐标,第三维是时间步。 - 使用一个循环来模拟扩散过程。在每一步,基于前一步的数据,加上根据扩散系数和时间步长计算出的高斯噪声,更新数据点的位置。
可视化
- 使用 matplotlib 和 seaborn 创建图表。
- 第一个图表显示初始数据点的密度估计。
- 第二个图表显示扩散结束时数据点的密度估计。
- 第三个图表显示数据点随时间的扩散轨迹。


逆向扩散采样
连续随机微分方程版本
KaTeX parse error: {align*} can be used only in display mode.
离散马尔可夫链版本
KaTeX parse error: {align} can be used only in display mode.
其中
z
t
∼
N
(
0
,
I
)
\mathbf{z}_t \sim \mathcal{N}(\mathbf{0}, \mathbf{I})
zt∼N(0,I)
sampN = 1000
sigma = 5
nsteps = 400

lambdaT = (sigma**2 - 1) / (2 * np.log(sigma)) # marginal_prob_std_np(1.0, sigma)
xT = np.sqrt(lambdaT) * np.random.randn(sampN, 2)
x_traj_rev = np.zeros((*x0.shape, nsteps, ))
x_traj_rev[:,:,0] = xT
dt = 1 / nsteps
for i in range(1, nsteps):
    t = (nsteps - i) * dt # note the time fly back
    # transport the gmm to that at time $t$ and compute score at that time $\nabla \log p_t(x)$
    gmm_t = diffuse_gmm(gmm, t, sigma) # note the time fly back! start from the largest noise scale
    score_xt = gmm_t.score(x_traj_rev[:,:,i-1])
    eps_z = np.random.randn(*x0.shape)
    x_traj_rev[:,:,i] = x_traj_rev[:,:,i-1] + eps_z * (sigma ** t) * np.sqrt(dt) + score_xt * dt * sigma**(2*t)

figh, axs = plt.subplots(1,1,figsize=[6.5, 6])
kdeplot(x_traj_rev[:,:,-1], "Rev Diff", )#ax=axs)
kdeplot(gmm_samps, "original GMM sample", )#ax=axs)
plt.legend()

figh, axs = plt.subplots(1,2,figsize=[12,6])
kdeplot(x_traj_rev[:,:,0], ax=axs[0], titlestr="Density of Gaussian Prior of $x_T$")
plt.axis("equal")
kdeplot(x_traj_rev[:,:,-1], ax=axs[1], titlestr=f"Density of $x_0$ samples after {nsteps} step reverse diffusion")
plt.axis("equal")

def reverse_diffusion_time_dep(score_model_td, sampN=500, sigma=5, nsteps=200, ndim=2, exact=False):
  lambdaT = (sigma**2 - 1) / (2 * np.log(sigma))
  xT = np.sqrt(lambdaT) * np.random.randn(sampN, ndim)
  x_traj_rev = np.zeros((*xT.shape, nsteps, ))
  x_traj_rev[:,:,0] = xT
  dt = 1 / nsteps
  for i in range(1, nsteps):
    t = 1 - i * dt
    tvec = torch.ones((sampN)) * t
    eps_z = np.random.randn(*xT.shape)
    if exact:
      gmm_t = diffuse_gmm(score_model_td, t, sigma)
      score_xt = gmm_t.score(x_traj_rev[:,:,i-1])
    else:
      with torch.no_grad():
        # score_xt = score_model_td(torch.cat((torch.tensor(x_traj_rev[:,:,i-1]).float(),tvec),dim=1)).numpy()
        score_xt = score_model_td(torch.tensor(x_traj_rev[:,:,i-1]).float(), tvec).numpy()
    x_traj_rev[:,:,i] = x_traj_rev[:,:,i-1] + eps_z * (sigma ** t) * np.sqrt(dt) + score_xt * dt * sigma**(2*t)
  return x_traj_rev
上面代码描述了一个混合高斯分布逆向扩散过程,主要用于生成数据样本,以逼近目标分布。这个过程是通过逆时间模拟从一个已知的简单分布(如高斯分布)逐步转化为复杂的目标分布。下面是代码的具体解释:
初始化和设置
sampN是样本数量。sigma是扩散系数,用于控制扩散过程的强度。nsteps是扩散步数,即整个扩散过程的时间分割数。lambdaT计算最初的方差,基于sigma。xT是初始样本,从标准高斯分布生成,并乘以sqrt(lambdaT)以调整其方差。
逆向扩散过程
x_traj_rev初始化为零数组,用于存储每一步的样本状态。x_traj_rev[:,:,0] = xT设置初始状态为xT。- 在循环中,
t从大到小变化,模拟时间的倒流。 gmm_t = diffuse_gmm(gmm, t, sigma)计算在时间t的扩散后的GMM参数。score_xt = gmm_t.score(x_traj_rev[:,:,i-1])计算梯度得分,这是向目标分布靠近的方向。eps_z是随机噪声,模拟扩散过程中的随机扰动。- 更新
x_traj_rev的表达式结合了随机扰动和梯度得分,以逐步引导样本向目标分布靠拢。
可视化
- 使用 KDE(核密度估计)图来可视化逆向扩散过程的开始和结束状态。
- 分别展示了初始的高斯先验分布和逆向扩散结束时的样本分布。
**函数 ****reverse_diffusion_time_dep**
- 这是一个更通用的逆向扩散函数,允许输入一个得分模型
score_model_td,可选的精确计算。 - 功能与前述过程类似,但增加了对得分模型的调用,以便在没有精确 GMM 时使用深度学习模型估计得分。


神经网络近似得分函数求解逆向高斯扩散
现在我们通过实验验证了扩散背后的数学原理是成立的!但这依赖于显式的密度p(x)和得分
∇
p
t
(
x
)
\nabla p_t(x)
∇pt(x)。
我们能用神经网络来近似这些,并且进一步从数据中学习它们吗?
在使用神经网络时,我们需要问两个问题,
- 表示性:我们能否用给定架构的神经网络来表示某个函数(假设有无限的数据)?
- 学习能力:我们能从数据中学习它吗?
关于时间依赖得分的观察
在构建和训练模型之前,让我们看看是否有任何可以利用的结构!
时间依赖的得分函数
s
(
x
,
t
)
:
R
2
×
[
0
,
1
]
→
R
2
,
(
x
,
t
)
↦
∇
x
log
p
t
(
x
)
s(x,t):\mathbb R^2\times [0,1]\to\mathbb R^2,(x,t)\mapsto \nabla_x \log p_t(x)
s(x,t):R2×[0,1]→R2,(x,t)↦∇xlogpt(x)。因此,让我们通过实验来评估得分通常如何随时间变化。
import torch
def sample_X_and_score(gmm, trainN=10000, testN=2000):
  X_train,_,_ = gmm.sample(trainN)
  y_train = gmm.score(X_train)
  X_test,_,_ = gmm.sample(testN)
  y_test = gmm.score(X_test)
  X_train_tsr = torch.tensor(X_train).float()
  y_train_tsr = torch.tensor(y_train).float()
  X_test_tsr = torch.tensor(X_test).float()
  y_test_tsr = torch.tensor(y_test).float()
  return X_train_tsr, y_train_tsr, X_test_tsr, y_test_tsr


def sample_X_and_score_t_depend(gmm, trainN=10000, testN=2000, sigma=5, partition=20, EPS=0.02):
  """Uniformly partition [0,1] and sample t from it, and then
  sample x~ p_t(x) and compute \nabla \log p_t(x)
  finally return the dataset x, score, t (train and test)
  """
  trainN_part, testN_part = trainN //partition, testN //partition
  X_train_col, y_train_col, X_test_col, y_test_col, T_train_col, T_test_col = [], [], [], [], [], []
  for t in np.linspace(EPS, 1.0, partition):
    gmm_dif = diffuse_gmm(gmm, t, sigma)
    X_train_tsr, y_train_tsr, X_test_tsr, y_test_tsr = \
      sample_X_and_score(gmm_dif, trainN=trainN_part, testN=testN_part, )
    T_train_tsr, T_test_tsr = t * torch.ones(trainN_part), t * torch.ones(testN_part)
    X_train_col.append(X_train_tsr)
    y_train_col.append(y_train_tsr)
    X_test_col.append(X_test_tsr)
    y_test_col.append(y_test_tsr)
    T_train_col.append(T_train_tsr)
    T_test_col.append(T_test_tsr)
  X_train_tsr = torch.cat(X_train_col, dim=0)
  y_train_tsr = torch.cat(y_train_col, dim=0)
  X_test_tsr = torch.cat(X_test_col, dim=0)
  y_test_tsr = torch.cat(y_test_col, dim=0)
  T_train_tsr = torch.cat(T_train_col, dim=0)
  T_test_tsr = torch.cat(T_test_col, dim=0)
  return X_train_tsr, y_train_tsr, T_train_tsr, X_test_tsr, y_test_tsr, T_test_tsr

sigma = 10
X_train, y_train, T_train, X_test, y_test, T_test = \
  sample_X_and_score_t_depend(gmm, sigma=sigma, trainN=100000, testN=2000,
                              partition=1000, EPS=0.0001)

T_train

score_norm = y_train.norm(dim=1)
samp_norm = X_train.norm(dim=1)
fig,axs= plt.subplots(1,2,figsize=[12,6])
sns.lineplot(x=T_train, y=score_norm, ax=axs[0])
sns.lineplot(x=T_train, y=score_norm* marginal_prob_std(T_train, sigma), ax=axs[0]) # (sigma**(T_train))
axs[0].set(xlabel="diffusion time t", ylabel="norm s(x,t)", title="Score norm ~ time")
sns.lineplot(x=T_train, y=samp_norm, ax=axs[1])
axs[1].set(xlabel="diffusion time t", ylabel="norm x", title="Sample norm / std ~ time")
这段代码涉及使用混合高斯模型 (Gaussian Mixture Model, GMM) 和扩散过程来生成数据,并计算这些数据的统计量。其中数据点在时间的推移下逐渐扩散,通过可视化不同时间点的数据特性,可以帮助理解数据的扩散行为和动态特性。
函数定义
**sample_X_and_score**:
- 参数:
gmm: 高斯混合模型对象。trainN: 训练集样本数量。testN: 测试集样本数量。
- 功能:
- 从给定的高斯混合模型中采样出训练集和测试集的数据点。
- 使用GMM的
score方法计算这些数据点的概率密度的对数梯度(也称为score)。 - 将数据和score转换为PyTorch张量并返回。
**sample_X_and_score_t_depend**:
- 参数:
gmm: 高斯混合模型对象。trainN,testN: 训练和测试数据的样本数量。sigma: 扩散强度,影响数据扩散的速率。partition: 时间分割数,即将时间区间[0,1]分成多少段来模拟扩散过程。EPS: 避免时间t为0,以确保数学运算的稳定性。
- 功能:
- 在时间区间[0,1]内均匀地采样时间点t。
- 对于每个时间点t,通过
diffuse_gmm函数模拟GMM的扩散,然后生成数据和对应的score。 - 将所有时间点的数据和score集合起来,并返回。
扩散过程模拟
- 代码中假设存在一个
diffuse_gmm函数(未在代码中给出),该函数应该负责模拟GMM在时间t和扩散强度sigma下的扩散行为。
数据可视化
- 使用matplotlib和seaborn库创建图表,展示随着扩散时间t的变化,数据点的score norm(概率密度对数梯度的范数)和数据点本身的范数如何变化。
- 分别为score norm和数据点范数创建了两个子图。
运行模拟
- 设置扩散强度sigma为10,并调用
sample_X_and_score_t_depend函数生成数据。 - 绘制数据点的score norm和数据点范数随时间t的变化情况。

模型预测时间依赖的得分函数
import tqdm
import torch
import torch.nn as nn
import torch.nn.functional as F
from torch.optim import Adam, SGD
from torch.nn.modules.loss import MSELoss

class GaussianFourierProjection(nn.Module):
  """Gaussian random features for encoding time steps."""
  def __init__(self, embed_dim, scale=30.):
    super().__init__()
    # Randomly sample weights during initialization. These weights are fixed
    # during optimization and are not trainable.
    self.W = nn.Parameter(torch.randn(embed_dim // 2) * scale, requires_grad=False)
  def forward(self, x):
    x_proj = x[:, None] * self.W[None, :] * 2 * np.pi
    return torch.cat([torch.sin(x_proj), torch.cos(x_proj)], dim=-1)

class ScoreModel_Time(nn.Module):
  """A time-dependent score-based model."""

  def __init__(self, sigma, ):
    super().__init__()
    self.embed = GaussianFourierProjection(10, scale=1)
    self.net = nn.Sequential(nn.Linear(12, 50),
               nn.Tanh(),
               nn.Linear(50,50),
               nn.Tanh(),
               nn.Linear(50,2))
    self.marginal_prob_std_f = lambda t: marginal_prob_std(t, sigma)

  def forward(self, x, t):
    t_embed = self.embed(t)
    pred = self.net(torch.cat((x,t_embed),dim=1))
    pred = pred / self.marginal_prob_std_f(t)[:, None,]
    return pred

sigma = 10
score_model_analy = ScoreModel_Time(sigma=sigma, )

optim = Adam(score_model_analy.parameters(), lr=0.001)
loss_fun = MSELoss()
pbar = tqdm.notebook.trange(250)
std_vec = marginal_prob_std(T_train, sigma)
for ep in pbar:
  y_pred = score_model_analy(X_train, T_train)
  # loss = loss_fun(y_train, y_pred)
  loss = torch.mean(torch.sum((y_pred - y_train)**2 * std_vec[:, None], dim=(1)))
  optim.zero_grad()
  loss.backward()
  optim.step()
  pbar.set_description(f"step {ep} loss {loss.item():.3f}")
  if ep == 0:
    print(f"step {ep} loss {loss.item():.3f}")
  if ep % 25==0:
    y_pred_test = score_model_analy(X_test, T_test)
    loss_test = loss_fun(y_test, y_pred_test)
    print(f"step {ep} test loss {loss.item():.3f}")

x_traj_rev_analy_pred = reverse_diffusion_time_dep(score_model_analy, sampN=2000, sigma=sigma)
x_traj_rev = reverse_diffusion_time_dep(gmm, sampN=2000, sigma=sigma, exact=True)
visualize_diffusion_distr(x_traj_rev_analy_pred, explabel="Reverse Diffusion fit analytical");
visualize_diffusion_distr(x_traj_rev, explabel="Reverse Diffusion exact score");
上面代码是一个深度学习模型的实现,用于学习和预测在扩散过程中时间依赖的分数(score)模型。这个过程使用了高斯傅里叶投影(Gaussian Fourier Projection)来编码时间步,以及一个神经网络来预测时间依赖的分数。
导入库
tqdm: 用于在训练过程中显示进度条。torch: PyTorch库,用于构建和训练神经网络。nn: 用于构建神经网络层。F: 提供了一系列的函数来应用非线性激活等。Adam,SGD: 优化器,用于优化神经网络。MSELoss: 均方误差损失函数,用于训练中的损失计算。
类定义
- GaussianFourierProjection:
- 用于将时间步编码为高斯随机特征。这种方法有助于模型捕捉时间的周期性和非线性特征。
embed_dim: 嵌入维度。scale: 控制随机特征的缩放。- 在前向传播中,时间
x被投影到正弦和余弦函数上,以生成时间的周期性表示。
- ScoreModel_Time:
- 时间依赖的分数模型。
sigma: 扩散过程中的扩散系数。- 包含时间嵌入层和一个简单的神经网络,用于从时间嵌入和数据特征中预测分数。
- 网络输出通过标准化函数
marginal_prob_std_f进行调整,该函数基于时间t和扩散系数sigma计算边缘概率的标准差。
训练过程
- 初始化模型、优化器和损失函数。
- 使用进度条(
tqdm)迭代250次训练过程。 - 在每个训练步骤中,模型预测训练数据的分数,并计算损失。
- 损失函数考虑了分数的平方误差,乘以由
marginal_prob_std计算的标准差向量。 - 每25步输出测试损失,以监控模型在测试集上的性能。
可视化和评估
- 使用
reverse_diffusion_time_dep函数生成反向扩散轨迹,这是评估模型如何在模拟扩散过程中进行时间逆转的一种方式。 - 可视化函数
visualize_diffusion_distr用于展示和比较分析模型和精确分数模型生成的反向扩散结果。


从样本中学习分数模型(分数匹配)
前面部分模型学习的数据是通过一个已知分布到扩散过程产生,相当于是精准学习一次高斯过程。然而实际使用过程是起始分布是没精确表示的,那么你就无法精准得到每一步扩散的分布是如何的。能给到的就是一堆的相似的数据(比如一堆图数据),那么如何从这一堆样本中学习出如何从噪声中重构出扩散过程,下面工作开始介绍。如何在没有准确分数的情况下根据样本拟合分数?
这个目标称为去噪分数匹配。从数学上讲,它利用了以下目标的等价关系。
KaTeX parse error: Got function '\tilde' with no arguments as subscript at position 100: …ilde x)-\nabla_\̲t̲i̲l̲d̲e̲ ̲x\log p_\sigma(…
在实践中,这是指从数据分布中采样 x,加入噪声 σ,然后对其进行去噪。因为我们在时间 t 时拥有这些数据,
p
t
(
x
~
∣
x
)
=
N
(
x
,
β
t
2
I
)
p_t(\tilde x\mid x)= \mathcal N(x,\beta^2_t I)
pt(x~∣x)=N(x,βt2I), 然后
x
~
=
x
+
β
t
z
,
z
∼
N
(
0
,
I
)
\tilde x=x+\beta_t z,z\sim \mathcal N(0,I)
x~=x+βtz,z∼N(0,I). 目标函数简化为
E
x
∼
p
(
x
)
E
z
∼
N
(
0
,
I
)
1
2
∥
s
θ
(
x
+
β
t
z
)
−
1
β
t
2
(
x
+
β
t
z
−
x
)
∥
2
E
x
∼
p
(
x
)
E
z
∼
N
(
0
,
I
)
1
2
∥
s
θ
(
x
+
β
t
z
)
−
1
β
t
z
∥
2
\mathbb E_{x\sim p(x)}\mathbb E_{z\sim \mathcal N(0,I)}\frac 12\|s_\theta(x+\beta_t z)-\frac{1}{\beta_t^2}(x+\beta_t z -x)\|^2\\ \mathbb E_{x\sim p(x)}\mathbb E_{z\sim \mathcal N(0,I)}\frac 12\|s_\theta(x+\beta_t z)-\frac{1}{\beta_t}z\|^2
Ex∼p(x)Ez∼N(0,I)21∥sθ(x+βtz)−βt21(x+βtz−x)∥2Ex∼p(x)Ez∼N(0,I)21∥sθ(x+βtz)−βt1z∥2
最后,在时间依赖的分数模型中
s
(
x
,
t
)
s(x,t)
s(x,t), 为了在任何时间学习这一点
t
∈
[
ϵ
,
1
]
t\in [\epsilon,1]
t∈[ϵ,1], 我们对所有 t 进行积分
∫
ϵ
1
d
t
E
x
∼
p
(
x
)
E
z
∼
N
(
0
,
I
)
1
2
∥
s
θ
(
x
+
β
t
z
,
t
)
−
1
β
t
z
∥
2
\int_\epsilon^1dt \mathbb E_{x\sim p(x)}\mathbb E_{z\sim \mathcal N(0,I)}\frac 12\|s_\theta(x+\beta_t z, t)-\frac{1}{\beta_t}z\|^2
∫ϵ1dtEx∼p(x)Ez∼N(0,I)21∥sθ(x+βtz,t)−βt1z∥2
(ϵ 设定是为了确保数值稳定,因为
t
→
0
,
β
t
→
0
t\to 0,\beta_t\to 0
t→0,βt→0)
现在所有的期望值都可以通过抽样轻松评估。
更好的训练,会为不同的 t 添加一个权重因子。
∫
ϵ
1
d
t
λ
(
t
)
E
x
∼
p
(
x
)
E
z
∼
N
(
0
,
I
)
1
2
∥
s
θ
(
x
+
β
t
z
,
t
)
−
1
β
t
z
∥
2
\int_\epsilon^1dt \lambda(t)\mathbb E_{x\sim p(x)}\mathbb E_{z\sim \mathcal N(0,I)}\frac 12\|s_\theta(x+\beta_t z, t)-\frac{1}{\beta_t}z\|^2
∫ϵ1dtλ(t)Ex∼p(x)Ez∼N(0,I)21∥sθ(x+βtz,t)−βt1z∥2
现在让我们定义我们的目标函数来拟合模型分数。
def loss_fn(model, x, marginal_prob_std_f, eps=1e-5):
  """The loss function for training score-based generative models.

  Args:
    model: A PyTorch model instance that represents a
      time-dependent score-based model.
    x: A mini-batch of training data.
    marginal_prob_std: A function that gives the standard deviation of
      the perturbation kernel.
    eps: A tolerance value for numerical stability, sample t uniformly from [eps, 1.0]
  """
  random_t = torch.rand(x.shape[0], device=x.device) * (1. - eps) + eps
  z = torch.randn_like(x)
  std = marginal_prob_std_f(random_t,)
  perturbed_x = x + z * std[:, None]
  score = model(perturbed_x, random_t)
  loss = torch.mean(torch.sum((score * std[:, None] + z)**2, dim=(1)))
  return loss

X_train_samp, _, _ = gmm.sample(N=5000)
X_train_samp = torch.tensor(X_train_samp).float()

sigma = 10
score_model_td = ScoreModel_Time(sigma=sigma)
marginal_prob_std_f = lambda t: marginal_prob_std(t, sigma)
optim = Adam(score_model_td.parameters(), lr=0.01)
pbar = tqdm.notebook.trange(500) # 5k samples for 500 iterations.
for ep in pbar:
  loss = loss_fn(score_model_td, X_train_samp, marginal_prob_std_f, 0.05)
  optim.zero_grad()
  loss.backward()
  optim.step()
  pbar.set_description(f"step {ep} loss {loss.item():.3f}")
  if ep == 0:
    print(f"step {ep} loss {loss.item():.3f}")

score_pred_test = score_model_td(X_train, T_train)
x_traj_rev_appr_denois = reverse_diffusion_time_dep(score_model_td, sampN=1000,
                              sigma=sigma, nsteps=200, ndim=2)

x_traj_rev_exact = reverse_diffusion_time_dep(gmm, sampN=1000,
                              sigma=5, nsteps=200, ndim=2, exact=True)

figh, axs = plt.subplots(1,2,figsize=[12,6])
kdeplot(x_traj_rev_appr_denois[:,:,0], ax=axs[0],)
axs[0].set_title("Density of Gaussian Prior of $x_T$\n before reverse diffusion")
plt.axis("equal")
kdeplot(x_traj_rev_appr_denois[:,:,-1], ax=axs[1],)
axs[1].set_title(f"Density of $x_0$ samples after {nsteps} step reverse diffusion\n(using neural network score function\n learned from dataset denoising with varying scales)")
plt.axis("equal")

figh, ax = plt.subplots(1,1,figsize=[7,6])
# sns.kdeplot(x=x_traj_rev_pred[:,0,-1], y=x_traj_rev_pred[:,1,-1], ax=ax, label="RevDiff_NNscore")
# kdeplot(x_traj_rev_exact[:,:,-1], label="RevDiff_exact m")
kdeplot(x_traj_rev_analy_pred[:,:,-1], label="RevDiff_NNscore_analytical")
kdeplot(x_traj_rev_appr_denois[:,:,-1], label="RevDiff_NNscore_denoise")
kdeplot(x_traj_rev[:,:,-1], label="RevDiff_exact")
kdeplot(gmm_samps[:,:,], label="Original")
plt.legend()
ax.set_title(f"Density comparison between Reverse diffusion and original")
plt.axis("equal")
这段代码是基于分数的生成模型的训练过程。主要分为几个部分:
- 定义损失函数(loss_fn):
- 输入包括模型(model),训练数据的小批量(x),标准差函数(marginal_prob_std_f),和一个数值稳定性参数(eps)。
- 首先,为每个数据点随机生成一个时间t(random_t),然后生成一个标准正态分布的随机噪声(z)。
- 使用标准差函数计算当前时间t的标准差(std),并将噪声加权后加到训练数据x上,得到扰动数据(perturbed_x)。
- 使用模型计算扰动数据的分数(score),并计算损失函数,这里使用的是分数和噪声的加权平方和的均值。
- 模型训练过程:
- 使用高斯混合模型(GMM)生成训练样本(X_train_samp)。
- 初始化一个时间依赖的分数模型(score_model_td)和优化器(Adam)。
- 使用进度条(tqdm)迭代训练模型,每次迭代计算损失,执行反向传播和优化器步骤。
- 生成和比较逆向扩散轨迹:
- 使用训练好的模型和原始的GMM模型生成逆向扩散轨迹(x_traj_rev_appr_denois 和 x_traj_rev_exact)。
- 使用核密度估计(kdeplot)绘制不同时间点的样本密度,比较使用神经网络得到的分数函数和精确方法的差异。


近似分析时间依赖的分数(神经网络模型)
sigma = 25
X_train3, y_train3, T_train3, X_test3, y_test3, T_test3 = \
  sample_X_and_score_t_depend(gmm3, sigma=sigma, trainN=50000, testN=2000,
                              partition=500, EPS=0.0001)

score_model_analy3 = ScoreModel_Time(sigma=sigma, )

optim = Adam(score_model_analy3.parameters(), lr=0.001)
loss_fun = MSELoss()
pbar = tqdm.notebook.trange(400)
std_vec = marginal_prob_std(T_train3, sigma)
for ep in pbar:
  y_pred = score_model_analy3(X_train3, T_train3)
  # loss = loss_fun(y_train, y_pred)
  loss = torch.mean(torch.sum((y_pred - y_train3)**2 * std_vec[:, None], dim=(1)))
  optim.zero_grad()
  loss.backward()
  optim.step()
  pbar.set_description(f"step {ep} loss {loss.item():.3f}")
  if ep == 0:
    print(f"step {ep} loss {loss.item():.3f}")
  if ep % 25==0:
    y_pred_test = score_model_analy3(X_test3, T_test3)
    loss_test = loss_fun(y_test3, y_pred_test)
    print(f"step {ep} test loss {loss.item():.3f}")

x_traj_analyt3 = reverse_diffusion_time_dep(score_model_analy3, sampN=2000, sigma=25, nsteps=200, ndim=2, exact=False)
figh = visualize_diffusion_distr(x_traj_analyt3, explabel="Time Dependent NN trained from ground truth score with weighted MSE")

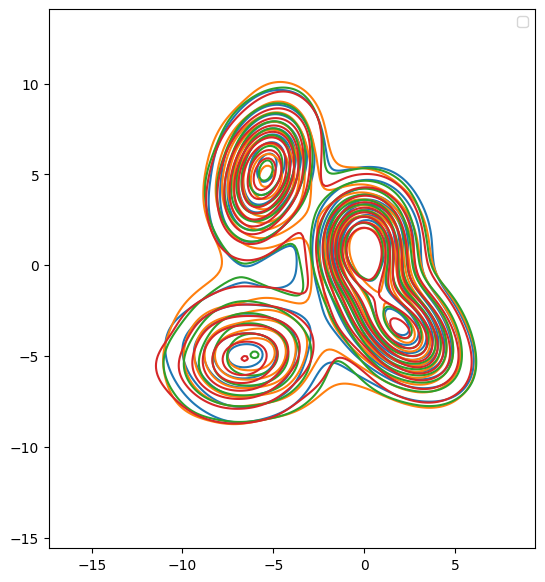
fig, ax = plt.subplots(figsize=[7,7])
kdeplot(x_traj_denoise3[:,:,-1], label="NN weighted denoise")
kdeplot(x_traj_analyt3[:,:,-1], label="NN MSE with analytical")
kdeplot(x_traj_rev3[:,:,-1], label="Exact score")
kdeplot(gmm_samps3, label="Original dist.")
plt.axis("image")
plt.legend()
plt.show()
这段代码主要包括使用PyTorch框架训练一个基于时间依赖的分数模型(ScoreModel_Time),用于生成逆向扩散过程,并可视化生成的分布。
- 数据准备:
- 使用
sample_X_and_score_t_depend函数从高斯混合模型(gmm3)生成训练和测试数据集。这个函数根据给定的标准差(sigma)和其他参数(样本数trainN和testN,分区数partition,数值稳定性参数EPS)生成数据点X和对应的分数y,以及时间标签T。
- 模型初始化:
- 初始化一个时间依赖的分数模型
score_model_analy3,并设置标准差参数。 - 使用Adam优化器进行模型参数的优化,学习率设置为0.001。
- 定义损失函数为均方误差(MSELoss)。
- 模型训练:
- 使用
marginal_prob_std函数计算训练数据时间标签对应的标准差向量(std_vec)。 - 在400次迭代过程中,每次迭代计算预测分数(y_pred),计算加权的均方误差损失,并进行反向传播和参数更新。
- 每25次迭代输出一次测试集上的损失。
- 逆向扩散模拟:
- 使用训练好的模型
score_model_analy3进行逆向扩散模拟,生成逆向扩散轨迹(x_traj_analyt3)。 - 使用
visualize_diffusion_distr函数可视化逆向扩散的分布。
- 结果可视化:
- 使用核密度估计(kdeplot)比较不同方法生成的最终样本分布:通过神经网络进行加权去噪的样本(x_traj_denoise3),使用分析方法的样本(x_traj_analyt3),精确分数方法的样本(x_traj_rev3),以及原始分布样本(gmm_samps3)。
- 设置图像的坐标轴为"image",确保比例一致,添加图例并显示图形。

