MATLAB代码
r_min = 2.5;
r_max = 4.0;
r_step = 0.001;
r_values = r_min:r_step:r_max;
num_iterations = 1000;
num_last_points = 100;
x = 0.5 * ones(size(r_values));
bifurcation_data = zeros(num_last_points, length(r_values));
for i = 1:num_iterations
x = r_values .* x .* (1 - x);
bifurcation_data(i, :) = x;
end
bifurcation_data=bifurcation_data(end-200:end,:);
figure;
plot(r_values, bifurcation_data, '.', 'MarkerSize', 1);
xlabel('Parameter r');
ylabel('Steady States');
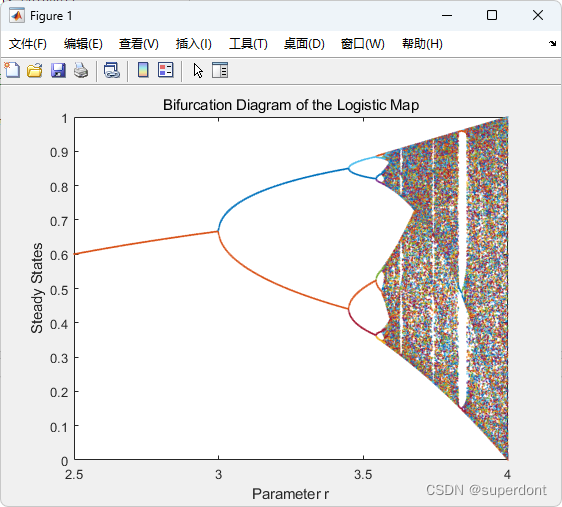
title('Bifurcation Diagram of the Logistic Map');
MATLAB运行结果





![[管理者与领导者-163] :团队管理 - 高效执行力 -1- 高效沟通的架构、关键问题、注意事项](https://img-blog.csdnimg.cn/direct/364a6da3aa4e4fe2affb311e89c33c71.png)

