SCI,CCF,EI及核心期刊绘图宝典,爆款持续更新,助力科研!
本期分享:
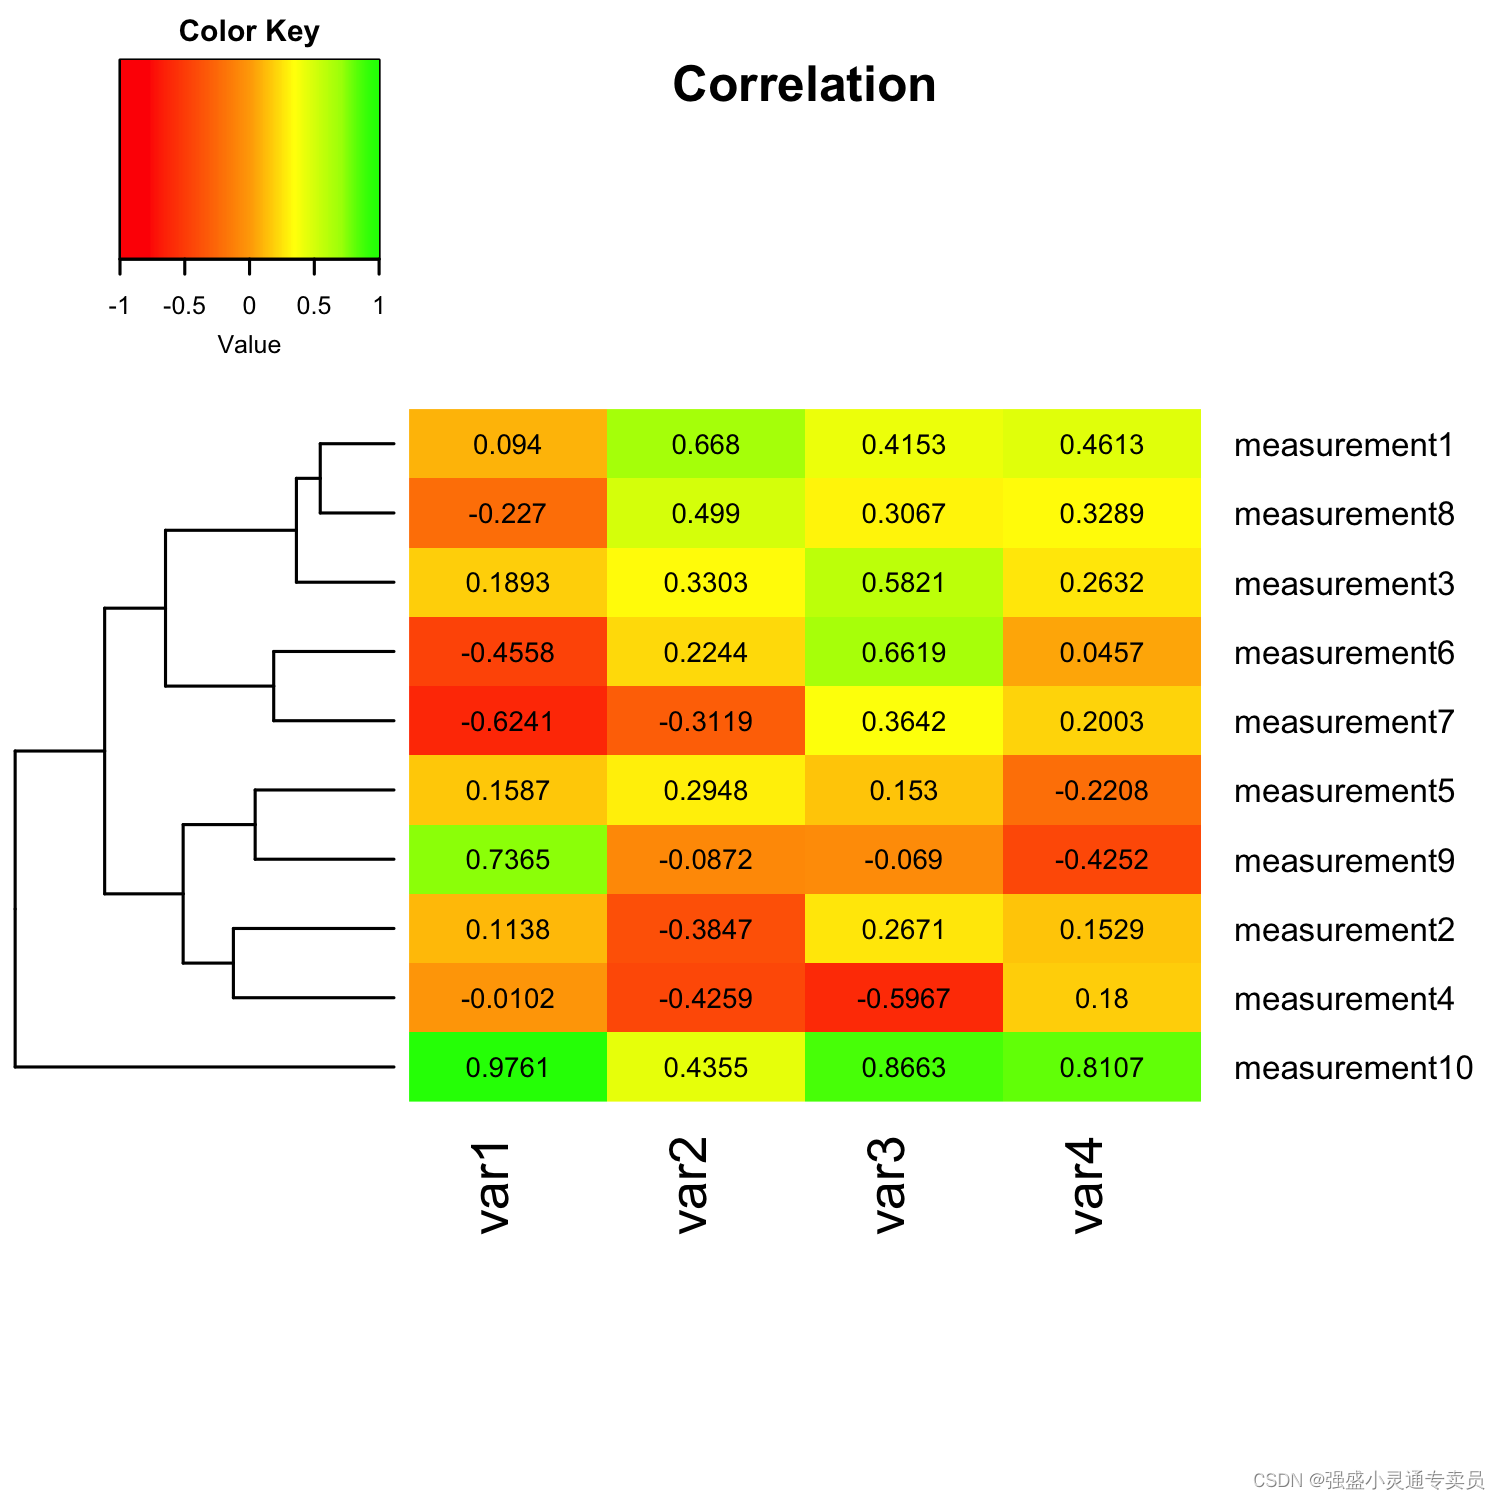
【SCI绘图】【热力图系列1 R】多特征相关性分析热力图R语言实现
1.环境准备
library(gplots)
library(RColorBrewer)
2.数据示例
#########################################################
### reading in data and transform it to matrix format
#########################################################

data <- read.csv("dataset.csv", comment.char="#")
rnames <- data[,1]                            # assign labels in column 1 to "rnames"
mat_data <- data.matrix(data[,2:ncol(data)])  # transform column 2-5 into a matrix
rownames(mat_data) <- rnames                  # assign row names
3.绘图展示
#########################################################
### customizing and plotting heatmap
#########################################################

# creates a own color palette from red to green
my_palette <- colorRampPalette(c("red", "yellow", "green"))(n = 299)

# (optional) defines the color breaks manually for a "skewed" color transition
col_breaks = c(seq(-1,0,length=100),   # for red
  seq(0.01,0.7,length=100),            # for yellow
  seq(0.71,1,length=100))              # for green

# creates a 5 x 5 inch image
png("h1_simple.png",
  width = 5*300,        # 5 x 300 pixels
  height = 5*300,
  res = 300,            # 300 pixels per inch
  pointsize = 8)        # smaller font size

heatmap.2(mat_data,
  cellnote = mat_data,  # same data set for cell labels
  main = "Correlation", # heat map title
  notecol="black",      # change font color of cell labels to black
  density.info="none",  # turns off density plot inside color legend
  trace="none",         # turns off trace lines inside the heat map
  margins =c(12,9),     # widens margins around plot
  col=my_palette,       # use on color palette defined earlier
  breaks=col_breaks,    # enable color transition at specified limits
  dendrogram="row",     # only draw a row dendrogram
  Colv="NA")            # turn off column clustering

##############################################################################
# NOTE
##############################################################################
# The color breaks above will yield a warning
#    "...unsorted 'breaks' will be sorted before use" since they contain
#    (due to the negative numbers). To avoid this warning, you can change the
#    manual breaks to:
#
#  col_breaks = c(seq(0,1,length=100),   # for red
#    seq(1.01,1.7,length=100),           # for yellow
#    seq(1.71,2,length=100))             # for green
#
# However, the problem is then that our heatmap contains negative values
# which will then not be colored correctly. Remember that you don't need to
# provide manual color breaks at all, this is entirely optional.
##############################################################################

dev.off()
完整代码:
library(gplots)
library(RColorBrewer)

#########################################################
### reading in data and transform it to matrix format
#########################################################

data <- read.csv("dataset.csv", comment.char="#")
rnames <- data[,1]                            # assign labels in column 1 to "rnames"
mat_data <- data.matrix(data[,2:ncol(data)])  # transform column 2-5 into a matrix
rownames(mat_data) <- rnames                  # assign row names


#########################################################
### customizing and plotting heatmap
#########################################################

# creates a own color palette from red to green
my_palette <- colorRampPalette(c("red", "yellow", "green"))(n = 299)

# (optional) defines the color breaks manually for a "skewed" color transition
col_breaks = c(seq(-1,0,length=100),   # for red
  seq(0.01,0.7,length=100),            # for yellow
  seq(0.71,1,length=100))              # for green

# creates a 5 x 5 inch image
png("h1_simple.png",
  width = 5*300,        # 5 x 300 pixels
  height = 5*300,
  res = 300,            # 300 pixels per inch
  pointsize = 8)        # smaller font size

heatmap.2(mat_data,
  cellnote = mat_data,  # same data set for cell labels
  main = "Correlation", # heat map title
  notecol="black",      # change font color of cell labels to black
  density.info="none",  # turns off density plot inside color legend
  trace="none",         # turns off trace lines inside the heat map
  margins =c(12,9),     # widens margins around plot
  col=my_palette,       # use on color palette defined earlier
  breaks=col_breaks,    # enable color transition at specified limits
  dendrogram="row",     # only draw a row dendrogram
  Colv="NA")            # turn off column clustering

##############################################################################
# NOTE
##############################################################################
# The color breaks above will yield a warning
#    "...unsorted 'breaks' will be sorted before use" since they contain
#    (due to the negative numbers). To avoid this warning, you can change the
#    manual breaks to:
#
#  col_breaks = c(seq(0,1,length=100),   # for red
#    seq(1.01,1.7,length=100),           # for yellow
#    seq(1.71,2,length=100))             # for green
#
# However, the problem is then that our heatmap contains negative values
# which will then not be colored correctly. Remember that you don't need to
# provide manual color breaks at all, this is entirely optional.
##############################################################################

dev.off()