目录
折线图基础
创建散点和折线图
复杂折现加图例
折线图+柱状图
数据处理
进行差异检验
基础绘图折线
基础绘图箱线
进行合并
双轴柱状与折线图
数据
折线图基础
创建散点和折线图
rm(list = ls())
opar <-par(no.readonly=TRUE)##自带orange数据集
par(mfrow=c(1,2))#拼图
t1 <-subset(Orange,Tree==1)##提取使用数据集
head(t1)
head(t1) Tree age circumference 1 1 118 30 2 1 484 58 3 1 664 87 4 1 1004 115 5 1 1231 120 6 1 1372 142
##散点图
p1 <- plot(t1$age,t1$circumference,
     xlab="Age(days)",
     ylab="Circumference(mm)",
     main="Orange Tree 1 Growth")#标题
p1
##折线图
p2 <-plot(t1$age,t1$circumference,
     xlab="Age(days)",
     ylab="Circumference(mm)",
     main="Orange Tree 1 Growth",
     type = "b")#标题
p2
折线图绘制参数:plot(x,y,type=) lines(x,y,type=)

复杂折现加图例
#使用ggplot 绘制折线图#
data <- Orange

head(Orange)
Tree  age circumference
1    2  118            30
2    2  484            58
3    2  664            87
4    2 1004           115
5    2 1231           120
6    2 1372           142
p <- ggplot(data = Orange, aes(x=age, y=circumference, linetype=Tree, color=Tree)) +
  geom_point() +
  geom_line(lwd = 1) +
  scale_color_brewer(palette = "Set1") + ##颜色配色https://zhuanlan.zhihu.com/p/657907907
  labs(title = "Orange Tree Growth", x = "Age(days)", y = "Circumference(mm)") +
  theme_bw() +
  theme(legend.position = c(0.2,0.8)) ##"right" 图例位置

p

折线图+柱状图
感谢R语言ggplot2 | 学习Nature文章精美配图 | 折线图 | 柱状图 | 误差棒 | 灰色背景 | 图片叠加 - 知乎 (zhihu.com)
数据:https://static-content.springer.com/esm/art%3A10.1038%2Fs41586-021-04194-8/MediaObjects/41586_2021_4194_MOESM11_ESM.xlsx

接受不同处理的HFD喂养小鼠的体重变化:非SMK(n = 37),SMK(n = 38),非SMK + abx(n = 40)和SMK + abx(n = 39)。从四个独立的重复序列中汇总的结果。最后一天,进行单因素方差分析(ANOVA)和Sidak校正;插图显示了烟雾暴露(暴露)或停止烟雾暴露(停止)会话、单因素方差分析和 Sidak 校正时的曲线下面积 (iAUC) 权重变化增量。
下载数据进行处理:R语言长款数据转换(自备)_r语言宽数据变成长数据-CSDN博客
数据处理

rm(list = ls())
library(tidyverse)
library(reshape2)
data <- read.csv('Nature data.CSV',header = T)
head(data)
##折线图转换为长数据:[1] "treat"  "Day"    "value1" "value2" "value3"
#根据"treat"分组  "Day"(也是X轴内容)转换为长数据,将value合并为1列
data1 <- data[,c(1:5)] %>%
  melt(id=c('treat','Day'))

##折线误差棒errorbar上下误差位置
topbar <- function(x){
  return(mean(x)+sd(x)/sqrt(length(x))) #误差采用了mean+-sem
}
bottombar <- function(x){
  return(mean(x)-sd(x)/sqrt(length(x)))
}
head(data1)
treat Day variable value
1 Non_SMK 0 value1 0.0
2 Non_SMK 7 value1 6.7
3 Non_SMK 14 value1 14.0
4 Non_SMK 21 value1 15.6
5 Non_SMK 28 value1 24.0
6 Non_SMK 35 value1 30.0
进行差异检验
连续性变量的组间差异分析_连续变量和连续变量差异性分析-CSDN博客
##检验测试##
tdat <- data[,c(1:5)]
tdat$mean <- rowMeans(select(tdat,c(3:5)))##计算第3-5行的均值,可以用于计算相关性
#单因素方差分析#
race.aov <-aov(mean ~treat,data = tdat)
summary(race.aov)
#Df Sum Sq Mean Sq F value Pr(>F)
#treat        3  751.2   250.4    2.09  0.134
#Residuals   20 2396.6   119.8

##两组间最后一组数据t检验##
group1 <- tdat[tdat$treat =="Non_SMK+abx"& tdat$Day=="35",c(3:5)]
group2 <- tdat[tdat$treat =="SMK+abx" & tdat$Day=="35",c(3:5)]
t.test(group1,group2,var.equal =TRUE)
#t = 12.267, df = 4, p-value = 0.0002536  ****

group3 <- tdat[tdat$treat =="SMK"& tdat$Day=="35",c(3:5)]
t.test(group2,group3,var.equal =TRUE)#一样的
#t = -7.4158, df = 4, p-value = 0.001765 ***
基础绘图折线
#绘图赋值为p
p0 <- ggplot(data1,aes(x=Day,y=value,color=treat))+#Day为X,value值为Y,分组颜色treat
  geom_rect(aes(xmin=21,xmax=40,ymin=(-Inf),ymax=Inf),##后半部分色块设置
            fill='grey90',color='grey90')+
  geom_vline(xintercept =21,linetype=2,cex=1.2)+            #添加虚线
  stat_summary(geom = 'line',fun='mean',cex=2.5)+           #折线
  stat_summary(geom = 'errorbar',                           #误差磅
               fun.min = bottombar,fun.max = topbar,
               width=1,cex=0.8,aes(color=treat))+
  stat_summary(geom = 'point',fun='mean',aes(fill=treat),   #点
               size=5,pch=21,color='black')+
  theme_classic(base_size = 15)+
  theme(legend.position = 'none')#top
p0
##点的颜色修改以及显著性标记的添加##
p1 <- p0+
  scale_color_manual(values = c('#5494cc','#0d898a','#e18283','#f9cc52'))+##线条的颜色
  scale_fill_manual(values = c('red','#0d898a','#e18283','white'))+ ##点的颜色
  scale_y_continuous(breaks = seq(0,60,20),expand = c(0,0))+              #Y轴范围
  scale_x_continuous(breaks = seq(0,40,10),expand = c(0,0))+              #X轴范围
  labs(y='Weight change(%)')+
  theme(axis.line = element_line(size = 1),                               #线条设置
        axis.text = element_text(color = 'black'),
        axis.ticks = element_line(size = 1,color='black'))+
  annotate(geom = 'segment',x=36.2,xend=36.2,y=18,yend=26,cex=1.2)+       ##显著性标注设置-线段
  annotate(geom = 'text',label='***',x=37.5,y=22,size=7,angle=90)+        ##显著性标注设置-数值或***
  annotate(geom = 'segment',x=38,xend = 38,y=18,yend = 40,cex=1.2)+
  annotate(geom = 'text',label='****',x=39.5,y=29,size=7,angle=90)
p1

##折线图图列的添加并且修改了图例形状##
linechart <- p1+
  coord_cartesian(clip = 'off',ylim = c(0,60),xlim = c(0,40))+
  theme(plot.margin = margin(1.5,0.5,0.5,0.5,'cm'))+
  geom_rect(aes(xmin=0,xmax=3,ymin=63,ymax=65),fill='#5494cc',color='black')+
  geom_rect(aes(xmin=10,xmax=13,ymin=63,ymax=65),fill='#0d898a',color='black')+
  geom_rect(aes(xmin=20,xmax=23,ymin=63,ymax=65),fill='#e18283',color='black')+
  geom_rect(aes(xmin=30,xmax=33,ymin=63,ymax=65),fill='#f9cc52',color='black')+
  annotate('text',x=6,y=64,label='Non-SMK',size=4)+
  annotate('text',x=15.2,y=64,label='SMK',size=4)+
  annotate('text',x=26.4,y=64,label='Non-SMK+\nabx',size=4)+
  annotate('text',x=36,y=64,label='SMK+abx',size=4)
linechart


基础绘图箱线
##提取箱线图数据
data2 <- data[,6:9] %>%
  gather(key = treat)
head(data2)
data3 <- data[,10:13] %>%
  gather(key = treat)

#左边柱状图:
leftchart <- ggplot(data2,aes(factor(treat,levels = c('SMK.abx','Non_SMK.abx','SMK','Non_SMK')),
                               value))+
    stat_summary(geom = 'bar',fun = 'mean',fill='white',color='black',width=0.7,cex=1)+
    stat_summary(geom = 'errorbar',
                 fun.min = bottombar,fun.max = topbar,
                 width=0.3,cex=0.8,color='black')+
    geom_jitter(aes(color=factor(treat,levels = c('SMK.abx','Non_SMK.abx','SMK','Non_SMK'))),
                width = 0.1,size=1.5)+
    scale_color_manual(values = c('#f9cc52','#0d898a','#e18283','#5494cc'))+
    labs(x=NULL,y=NULL)+
    scale_y_continuous(limits = c(-40,600),expand = c(0,0))+
    geom_hline(yintercept =0,cex=1)+
    theme_classic(base_size = 15)+
    theme(axis.ticks.y = element_blank(),
          axis.text.y= element_blank(),
          legend.position = 'none',
          axis.line = element_line(size = 1),
          axis.text = element_text(color = 'black'),
          axis.ticks = element_line(size = 1,color='black'))+
    coord_flip()+
    annotate(geom = 'segment',x=1,xend=2,y=530,yend=530,cex=1.2)+
    annotate(geom = 'text',label='****',x=1.5,y=570,size=6,angle=90)+
    annotate(geom = 'segment',x=3,xend =4,y=370,yend =370,cex=1.2)+
    annotate(geom = 'text',label='****',x=3.5,y=410,size=6,angle=90))
leftchart

#右边柱状图:
rightchart <- ggplot(data3,aes(factor(treat,levels = c('SMK.abx.1','Non_SMK.abx.1','SMK.1','Non_SMK.1')),
                               value))+
  stat_summary(geom = 'bar',fun = 'mean',fill='white',color='black',width=0.7,cex=1)+
  stat_summary(geom = 'errorbar',
               fun.min = bottombar,fun.max = topbar,
               width=0.3,cex=0.8,color='black')+
  geom_jitter(aes(color=factor(treat,levels = c('SMK.abx.1','Non_SMK.abx.1','SMK.1','Non_SMK.1'))),
              width = 0.1,size=1.5)+
  scale_color_manual(values = c('#f9cc52','#0d898a','#e18283','#5494cc'))+
  labs(x=NULL,y=NULL)+
  scale_y_continuous(limits = c(-40,500),expand = c(0,0))+
  geom_hline(yintercept =0,cex=1)+
  theme_classic(base_size = 15)+
  theme(axis.ticks.y = element_blank(),
        axis.text.y= element_blank(),
        legend.position = 'none',
        axis.line = element_line(size = 1),
        axis.text = element_text(color = 'black'),
        axis.ticks = element_line(size = 1,color='black'),
        plot.background = element_rect(fill = "transparent",colour = NA),
        panel.background = element_rect(fill = "transparent",colour = NA))+
  coord_flip()+
  annotate(geom = 'segment',x=1,xend=2,y=420,yend=420,cex=1.2)+
  annotate(geom = 'text',label='****',x=1.5,y=460,size=6,angle=90)+
  annotate(geom = 'segment',x=3,xend =4,y=430,yend =430,cex=1.2)+
  annotate(geom = 'text',label='****',x=3.5,y=470,size=6,angle=90)
rightchart

进行合并
#要叠加的图片先用ggplotGrob()函数处理:
leftchart <- ggplotGrob(leftchart)
rightchart <- ggplotGrob(rightchart)

#叠加绘图:
linechart+
  annotation_custom(leftchart,xmin=0,xmax=20.5,ymin=40,ymax=57)+
  annotation_custom(rightchart,xmin=21,xmax=39.5,ymin=40,ymax=57)+
  annotate('text',label='iAUC: Exposure',x=10.5,y=58.5,size=7)+
  annotate('text',label='iAUC: Cessation',x=31,y=58.5,size=7)

感谢:“R语言ggplot2科研绘图”的代码,本文主要是复现流程和差异计算补充!!
双轴柱状与折线图
Nature图表复现|双轴柱状与折线图 (qq.com)
数据
rm(list = ls())
library(tidyverse)
library(gapminder)
library(Hmisc)
library(gapminder)

data <- gapminder
##提取continent=="Asia"的数据
df <- data %>% filter(continent=="Asia") %>%
  select(1,3,4,6) %>% mutate(year=as.character(year))

p <- ggplot() +
  stat_summary(data=df, aes(year, lifeExp), fun = "mean", geom = "bar", alpha = 0.7, fill="#00A08A") +
  # 添加预期寿命(lifeExp)的误差条
  stat_summary(data=df, aes(year, lifeExp), fun.data = "mean_cl_normal", geom = "errorbar", width = .2, color="#00A08A") +
  # 添加人均GDP(gdpPercap)的误差条
  stat_summary(data=df %>% mutate(gdpPercap=gdpPercap/20), aes(year, gdpPercap), fun = mean, geom = "errorbar", width=.2, color="#F98400",
               fun.max = function(x) mean(x) + sd(x) / sqrt(length(x)),
               fun.min = function(x) mean(x) - sd(x) / sqrt(length(x))) +
  # 添加人均GDP(gdpPercap)的平均值点
  stat_summary(data=df %>% mutate(gdpPercap=gdpPercap/20), aes(year, gdpPercap), fun = "mean", geom = "point", size=3, color="#F98400") +
  # 添加人均GDP(gdpPercap)的平均值线
  stat_summary(data=df %>% mutate(gdpPercap=gdpPercap/20), aes(year, gdpPercap, group=1), fun = "mean", geom = "line", color="#F98400") +
  # 设置y轴的比例和标签
  scale_y_continuous(expand = c(0, 1), breaks = scales::pretty_breaks(n = 12),
                     sec.axis = sec_axis(~. * 20, breaks = scales::pretty_breaks(n = 12),
                                         name = "gdpPercap")) +
  # 应用主题
  theme_test() +
  # 自定义主题设置
  theme(panel.background = element_blank(),
        axis.ticks.length.x.bottom = unit(-0.05, "in"),
        axis.ticks.length.y.left = unit(-0.05, "in"),
        axis.ticks.length.y.right = unit(-0.05, "in"),
        axis.line.y.left = element_line(color="#00A08A"),
        axis.line.y.right = element_line(color="#F98400"),
        axis.line.x.bottom = element_line(color="black"),
        axis.line.x.top = element_line(color="grey80"),
        axis.text.y.right = element_text(color="#F98400", margin = margin(l = 5, r = 10)),
        axis.text.y.left = element_text(color="#00A08A", margin = margin(l = 10, r = 5)),
        axis.title.y.left = element_text(color="#00A08A", face="bold"),
        axis.title.y.right = element_text(color="#F98400", face="bold"),
        axis.title.x.bottom = element_blank())
p
dev.off()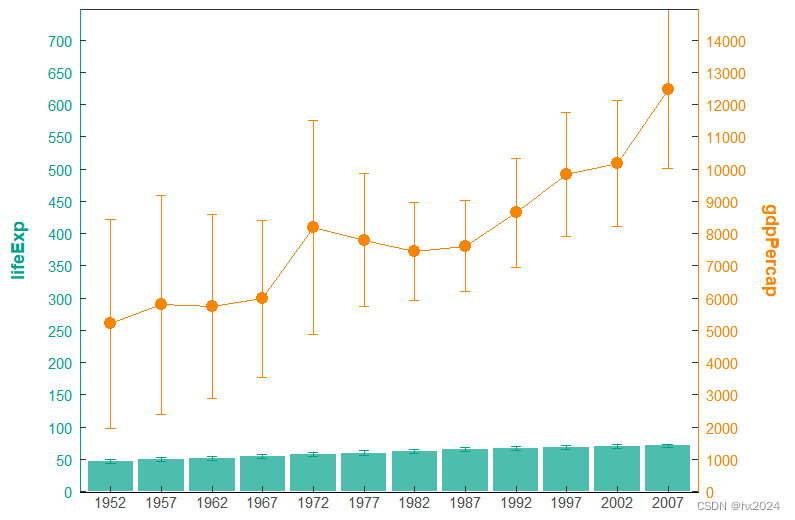
参考:
1:《R语言实战手册》
2:Gut microbiota modulates weight gain in mice after discontinued smoke exposure


