文章目录
- 前言
- ENM初识
- 一、所需软件安装
- 1.1. 下载ArcGIS软件:
- 1.2. 下载 MaxEnt软件:
- 1.3. 下载ENMtools:
- 二、数据准备与处理
- 2.1. 物种分布数据
- 2.2. 环境因子数据
- 2.3. 地图数据
- 2.4. 物种分布点去冗余
- 2.4.1. 使用spThin包中的thin函数
- 2.4.2. 或者使用 ENMTools 去除冗余位点
- 2.4.3. 或者使用 arcgis 去除
- 2.5. 环境因子的进一步筛选
- 三、MaxEnt建模
- 四、MaxEnt 参数优化
- 五、使用Arcgis裁剪(补充)
- 六、适生区划分
- 1. 重分类
- 2. 适生区图绘制
- 七、适生区面积统计
- 八、适生区收缩扩张以及稳定区分析
- 九、适生区质心迁移分析
- 小结:
- 十、 基于rbcL序列的系统发育和单倍型分布分析
- 十一、后续补充与问题解决
- 总结
前言
软件、代码、地图:
链接:https://pan.baidu.com/s/1eqT7axtpTVc2I4wAwOjYvA?pwd=1wht
提取码:1wht
–来自百度网盘超级会员V4的分享
ENM初识
文章:
https://blog.csdn.net/2301_78630677/article/details/135963229
一、所需软件安装
1.1. 下载ArcGIS软件:
推荐文章:https://zhuanlan.zhihu.com/p/670775519

1.2. 下载 MaxEnt软件:
http://lucky-boy.ysepan.com/(这个网站有许多生物信息学相关资源。强烈推荐)
推荐文章:
https://blog.csdn.net/weixin_42191203/article/details/108759365

使用前需要先配置java环境

1.3. 下载ENMtools:
参考视频:
https://www.bilibili.com/video/BV1Sa4y1w7SP/?spm_id_from=333.337.search-card.all.click
二、数据准备与处理
2.1. 物种分布数据
从GBIF网站https://www.gbif.org/zh/下载

或者其它途径(如采样、文献等)
2.2. 环境因子数据
从https://bio-oracle.org/downloads-to-email.php下载的。
参考文献:


我下载了present和 Future (2040-2050):RCP26 、RCP45 、 RCP85 的Surface layers的 ASCII Grid file (.asc)的所有文件

发送到自己的邮箱后,可以点击下载:

由于要一个一个点击下载压缩包,再解压,干脆用代码自动实现一下
#下面的html代码都是来自于页面的下载链接部分的html部分代码

import os
import requests
from bs4 import BeautifulSoup
from zipfile import ZipFile


def download_and_extract_zip(url, save_dir, extract_dir):
    # 确保保存目录存在
    os.makedirs(save_dir, exist_ok=True)
    os.makedirs(extract_dir, exist_ok=True)

    # 文件名从URL最后一部分获取
    local_filename = url.split('/')[-1]
    save_path = os.path.join(save_dir, local_filename)

    # 下载文件
    with requests.get(url, stream=True) as r:
        r.raise_for_status()  # 确保请求成功
        with open(save_path, 'wb') as f:
            for chunk in r.iter_content(chunk_size=8192):
                f.write(chunk)
    print(f"文件已下载到: {save_path}")

    # 解压文件到指定目录
    with ZipFile(save_path, 'r') as zip_ref:
        zip_ref.extractall(extract_dir)
    print(f"文件已解压到: {extract_dir}")

#
#使用BeautifulSoup解析HTML
soup = BeautifulSoup(html_present, 'html.parser')   #当前的
#
# # 查找所有<a>标签,提取以.zip结尾的href属性
links = [a['href'] for a in soup.find_all('a', href=True) if a['href'].endswith('.zip')]
print(links)
print(len(links))
# # 示例使用
save_directory = r"D:\tangzicai_project\huanjing_yinzi\Bio-OIRCLE"  # zip文件的保存目录
#
extract_directory = r'D:\tangzicai_project\huanjing_yinzi\Bio'  # zip文件的解压目录
#
for link in links:
    try:
        download_and_extract_zip(link, save_directory, extract_directory)

    except Exception as e:
        print(f"下载并解压{link}时发生错误: {e}")

        continue


print("=============================================")

soup = BeautifulSoup(html_futurre_RCP26, 'html.parser')  #未来的 RCP26

# 查找所有<a>标签,提取以.zip结尾的href属性
links = [a['href'] for a in soup.find_all('a', href=True) if a['href'].endswith('.zip')]
print(links)
print(len(links))
# 示例使用
save_directory = r"D:\tangzicai_project\huanjing_yinzi\Bio_future_RCP26"  # zip文件的保存目录

extract_directory = r'D:\tangzicai_project\huanjing_yinzi\future_RCP26'  # zip文件的解压目录


for link in links:
    try:
        download_and_extract_zip(link, save_directory, extract_directory)

    except Exception as e:
        print(f"下载并解压{link}时发生错误: {e}")

        continue

print("=============================================")


soup = BeautifulSoup(html_futurre_RCP45, 'html.parser')  #未来的 RCP45
# 查找所有<a>标签,提取以.zip结尾的href属性
links = [a['href'] for a in soup.find_all('a', href=True) if a['href'].endswith('.zip')]
print(links)
print(len(links))

# 示例使用
save_directory = r"D:\tangzicai_project\huanjing_yinzi\Bio_future_RCP45"  # zip文件的保存目录

extract_directory = r'D:\tangzicai_project\huanjing_yinzi\future_RCP45'  # zip文件的解压目录


for link in links:
    try:
        download_and_extract_zip(link, save_directory, extract_directory)

    except Exception as e:
        print(f"下载并解压{link}时发生错误: {e}")

        continue


print("==============================================")

soup = BeautifulSoup(html_futurre_RCP85, 'html.parser')  #未来的 RCP85
# 查找所有<a>标签,提取以.zip结尾的href属性
links = [a['href'] for a in soup.find_all('a', href=True) if a['href'].endswith('.zip')]
print(links)
print(len(links))
# 示例使用
save_directory = r"D:\tangzicai_project\huanjing_yinzi\Bio_future_RCP85"  # zip文件的保存目录

extract_directory = r'D:\tangzicai_project\huanjing_yinzi\future_RCP85'  # zip文件的解压目录


for link in links:
    try:
        download_and_extract_zip(link, save_directory, extract_directory)

    except Exception as e:
        print(f"下载并解压{link}时发生错误: {e}")

        continue
2.3. 地图数据
从中国科学院资源环境科学数据中心https://www.resdc.cn/Default.aspx下载的中国省级行政区划边界地图等

2.4. 物种分布点去冗余
2.4.1. 使用spThin包中的thin函数
在R软件中使用spThin包中的thin函数可以实现排除物种分布原始数据中距离小于5公里的记录

# 安装spThin包
install.packages("spThin")

# 加载spThin包
library(spThin)

# 读取原始数据
raw_GBIF_data <- read.csv("D:/tangzicai_project/Porphyra_fenbuxinxi1.csv", header = TRUE)
summary(raw_GBIF_data)

# 使用thin函数排除距离小于5公里的记录
filtered_data <- thin(loc.data=raw_GBIF_data,lat.col = 'Latitude', long.col = 'Longtitude',spec.col = 'species',thin.par = 5,reps = 5,out.dir ="D:/tangzicai_project/" )
最后就会得到reps次随机稀疏化模拟后的csv文件,任选其一即可


2.4.2. 或者使用 ENMTools 去除冗余位点
参考视频:
https://www.bilibili.com/video/BV1M84y187ms/?spm_id_from=333.337.search-card.all.click
2.4.3. 或者使用 arcgis 去除
参考:
https://www.zhihu.com/question/555446760/answer/2699062065
2.5. 环境因子的进一步筛选
使用ENMtools中的相关性分析以及贡献度对环境因子进一步筛选

点击 Settings:


设置好后,点击 Run,以运行

额外补充:(Maxent error: Error projecting, two layers have different geographic dimensions)解决方法:
打开 asc文件,查看文件的行数和列数以及单元格大小是否相同。如果不一致,则复制标题的那几行使之一样。
参考https://blog.csdn.net/qq_32678749/article/details/124081821

打开结果页面

环境因子的贡献度排列如下:

去掉贡献率为 0 的环境因素,
将剩余因素使用ENMtools的correlation功能完成相关性分析
先设置输出路径:

回到correlation功能模块:

点击“GO”

环境变量的相关系数|r|˃0.8 定义为高度相关 ,从中筛选贡献率最高的用于后续建模


经过筛选后剩余:

三、MaxEnt建模
打开maxent软件,与前面差不太多,只是环境因子变为了筛选后的,


四、MaxEnt 参数优化
利用R语言的ENMeval包来进行maxent的参数优化,选取最佳参数后再在maxent软件中运行maxent模型。
参考视频:https://www.bilibili.com/video/BV1Cu41147zD/?spm_id_from=333.337.search-card.all.click
library(dismo)
install.packages("ENMeval")
library(ENMeval)
library(raster)
library(sp)
library(sf)
library(dplyr)
occs <- read.csv("D:/tangzicai_project/thinned_data_thin.csv") #排除空间自相关之后的经纬度数据,列名依次是:species-Lon-Lat(如果经纬度顺序反了请调整过来)
occs <- occs[,2:3] #提取第二第三列(Lon,Lat)
colnames(occs) <- c("x", "y") #更改列名,为了和背景点(bg)保持一致
setwd("D:/tangzicai_project/huanjing_yinzi/pre")
files=dir(pattern = "*.asc") #指定列出文件中所有asc格式文件(可以是tiff文件)
length(files)


clim=list() #生成一个空list
for (i in 1:length(files)) {
  t_texture <- raster::stack(files[i]) #asc文件导入
  clim[i] <- t_texture
} #循环,所有asc文件生成一个list(clim)
bg <- dismo::randomPoints(clim[[1]], n = 10000) %>% as.data.frame() #生成背景点,背景点数量默认10000
result <- ENMevaluate(occs = occs[,1:2], #经纬度数据
                      envs = clim, #环境图层
                      bg = bg[,1:2], #背景点
                      partitions = 'jackknife', #五种可用"randomkfold","jackknife","block", "checkerboard1", and "checkerboard2"
                      #tune.args = list(fc="L", rm = 1:2),
                      tune.args = list(fc=c("L", "LQ", "H", "LQH", "LQHP", "LQHPT"), rm = c(0.1, seq(0.5, 6, 0.5))),  #调控倍频(regularization multiplier, RM)和特征组合(feature combination, FC)   文献常用参数的类型
                      algorithm = 'maxent.jar')
delta_AICc3 <- evalplot.stats(e = result,
                              stats = c("delta.AICc"),
                              color = "fc",
                              x.var = "rm",
                              error.bars = FALSE) #绘制delta_AICc曲线
pdf('delta_AICc3.pdf', width = 5, height = 4) #生成pdf
print(delta_AICc3) #打印pdf
dev.off() #保存pdf文件
即选取图中使AlCC值最小的点代表的参数,根据最佳的参数带入maxent软件中再次运行。
五、使用Arcgis裁剪(补充)
参考文章:
https://blog.csdn.net/2301_78630677/article/details/136067779
六、适生区划分
1. 重分类
打开arcgis的 "ArcToolbox—— Spatial Analyst工具 —— 重分类—— 重分类”

输入代表当前的栅格数据,然后再点击“分类”

设置类别数和中断值

修改图层属性,划分适生区


2. 适生区图绘制
绘制比例尺
1.打开“ 布局视图”
2. 坐标系选为 “WGS 1984"
3. “显示” 为 “千米”
4. 参考比例为 “当前比例”
5. 确定后,点击 ” 插入——比例尺——黑白相间比例尺“
6. 右键点击比例尺,选择”属性“,修改”主刻度单位”为“千米“ 等


插入图例和指北针
- 点击”插入——图例“
- 选择图例项,设置图例
- 点击”插入——指北针“

插入经纬度框
-
同样右键点击”属性“,选择”格网“,新建格网

-
之后就是按照自己的要求去设置
右下角的小框
点击” 插入——数据框“,这样变新建了一个数据框
之后,将原来内容列表中的数据复制到此新建数据框中,选中调整大小和位置。
最终展示:

七、适生区面积统计
面积计算公式为:像元个数*像元面积
推荐文章:https://zhuanlan.zhihu.com/p/484912410


八、适生区收缩扩张以及稳定区分析
到这里要用到未来的maxent建模结果和现在的结果
- 以现在的和未来的RCP26为例,导入数据

- 同样进行”重分类“ (只不过类别设为1)

- 在“工具栏中点击”转换工具——由栅格转出——栅格转面“


- 在“工具栏中点击”转换工具——分析工具——叠加分析——相交“


- 在“工具栏中点击”转换工具——转为栅格——面转栅格“


-
将序号4代表的非适生区去除,剩下的划分为稳定区、收缩区、增长区

-
最终结果展示:

九、适生区质心迁移分析
同样先进行重分类
之后:

栅格转面

在“工具栏中点击”空间统计工具——度量地理分布——平均中心“

点击菜单栏的”地理处理——合并“

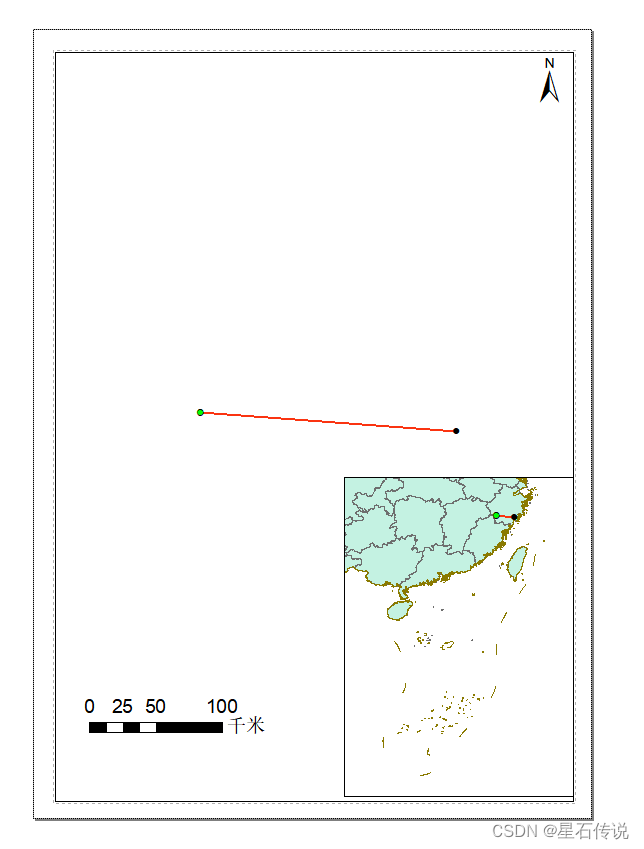
点击工具栏的”数据管理工具——要素——点集转线“

。。。。

小结:
前文粗略的了解了一下使用maxent模型的生态位模拟的大概流程,虽然在实际再正式细致的操作中可能会有一些报错和其余问题,但是大体框架就这样,至于更细致的问题,之后具体问题具体分析吧。
我个人感觉的问题有:
之后要用到更多不同的环境因子,如海拔、太阳辐射等,可能会因为格式等问题引起报错;
环境因子的分辨率要统一,是选择10min 、5min 、2.5min、30s,这是个问题,并且可能要用到重采样
另外在maxent模型调优和后续图片的精美绘制时会耗费时间
最后,总之感觉有太多意外。。。。
十、 基于rbcL序列的系统发育和单倍型分布分析
。。。。。。。。。。


