step1: 导入ggplot2库文件
library(ggplot2)
step2:带入自带的iris数据集
iris <- datasets::iris
step3:查看数据信息
dim(iris)
维度为 [150,5]
head(iris)
查看数据前6行的信息

step4:画图展示
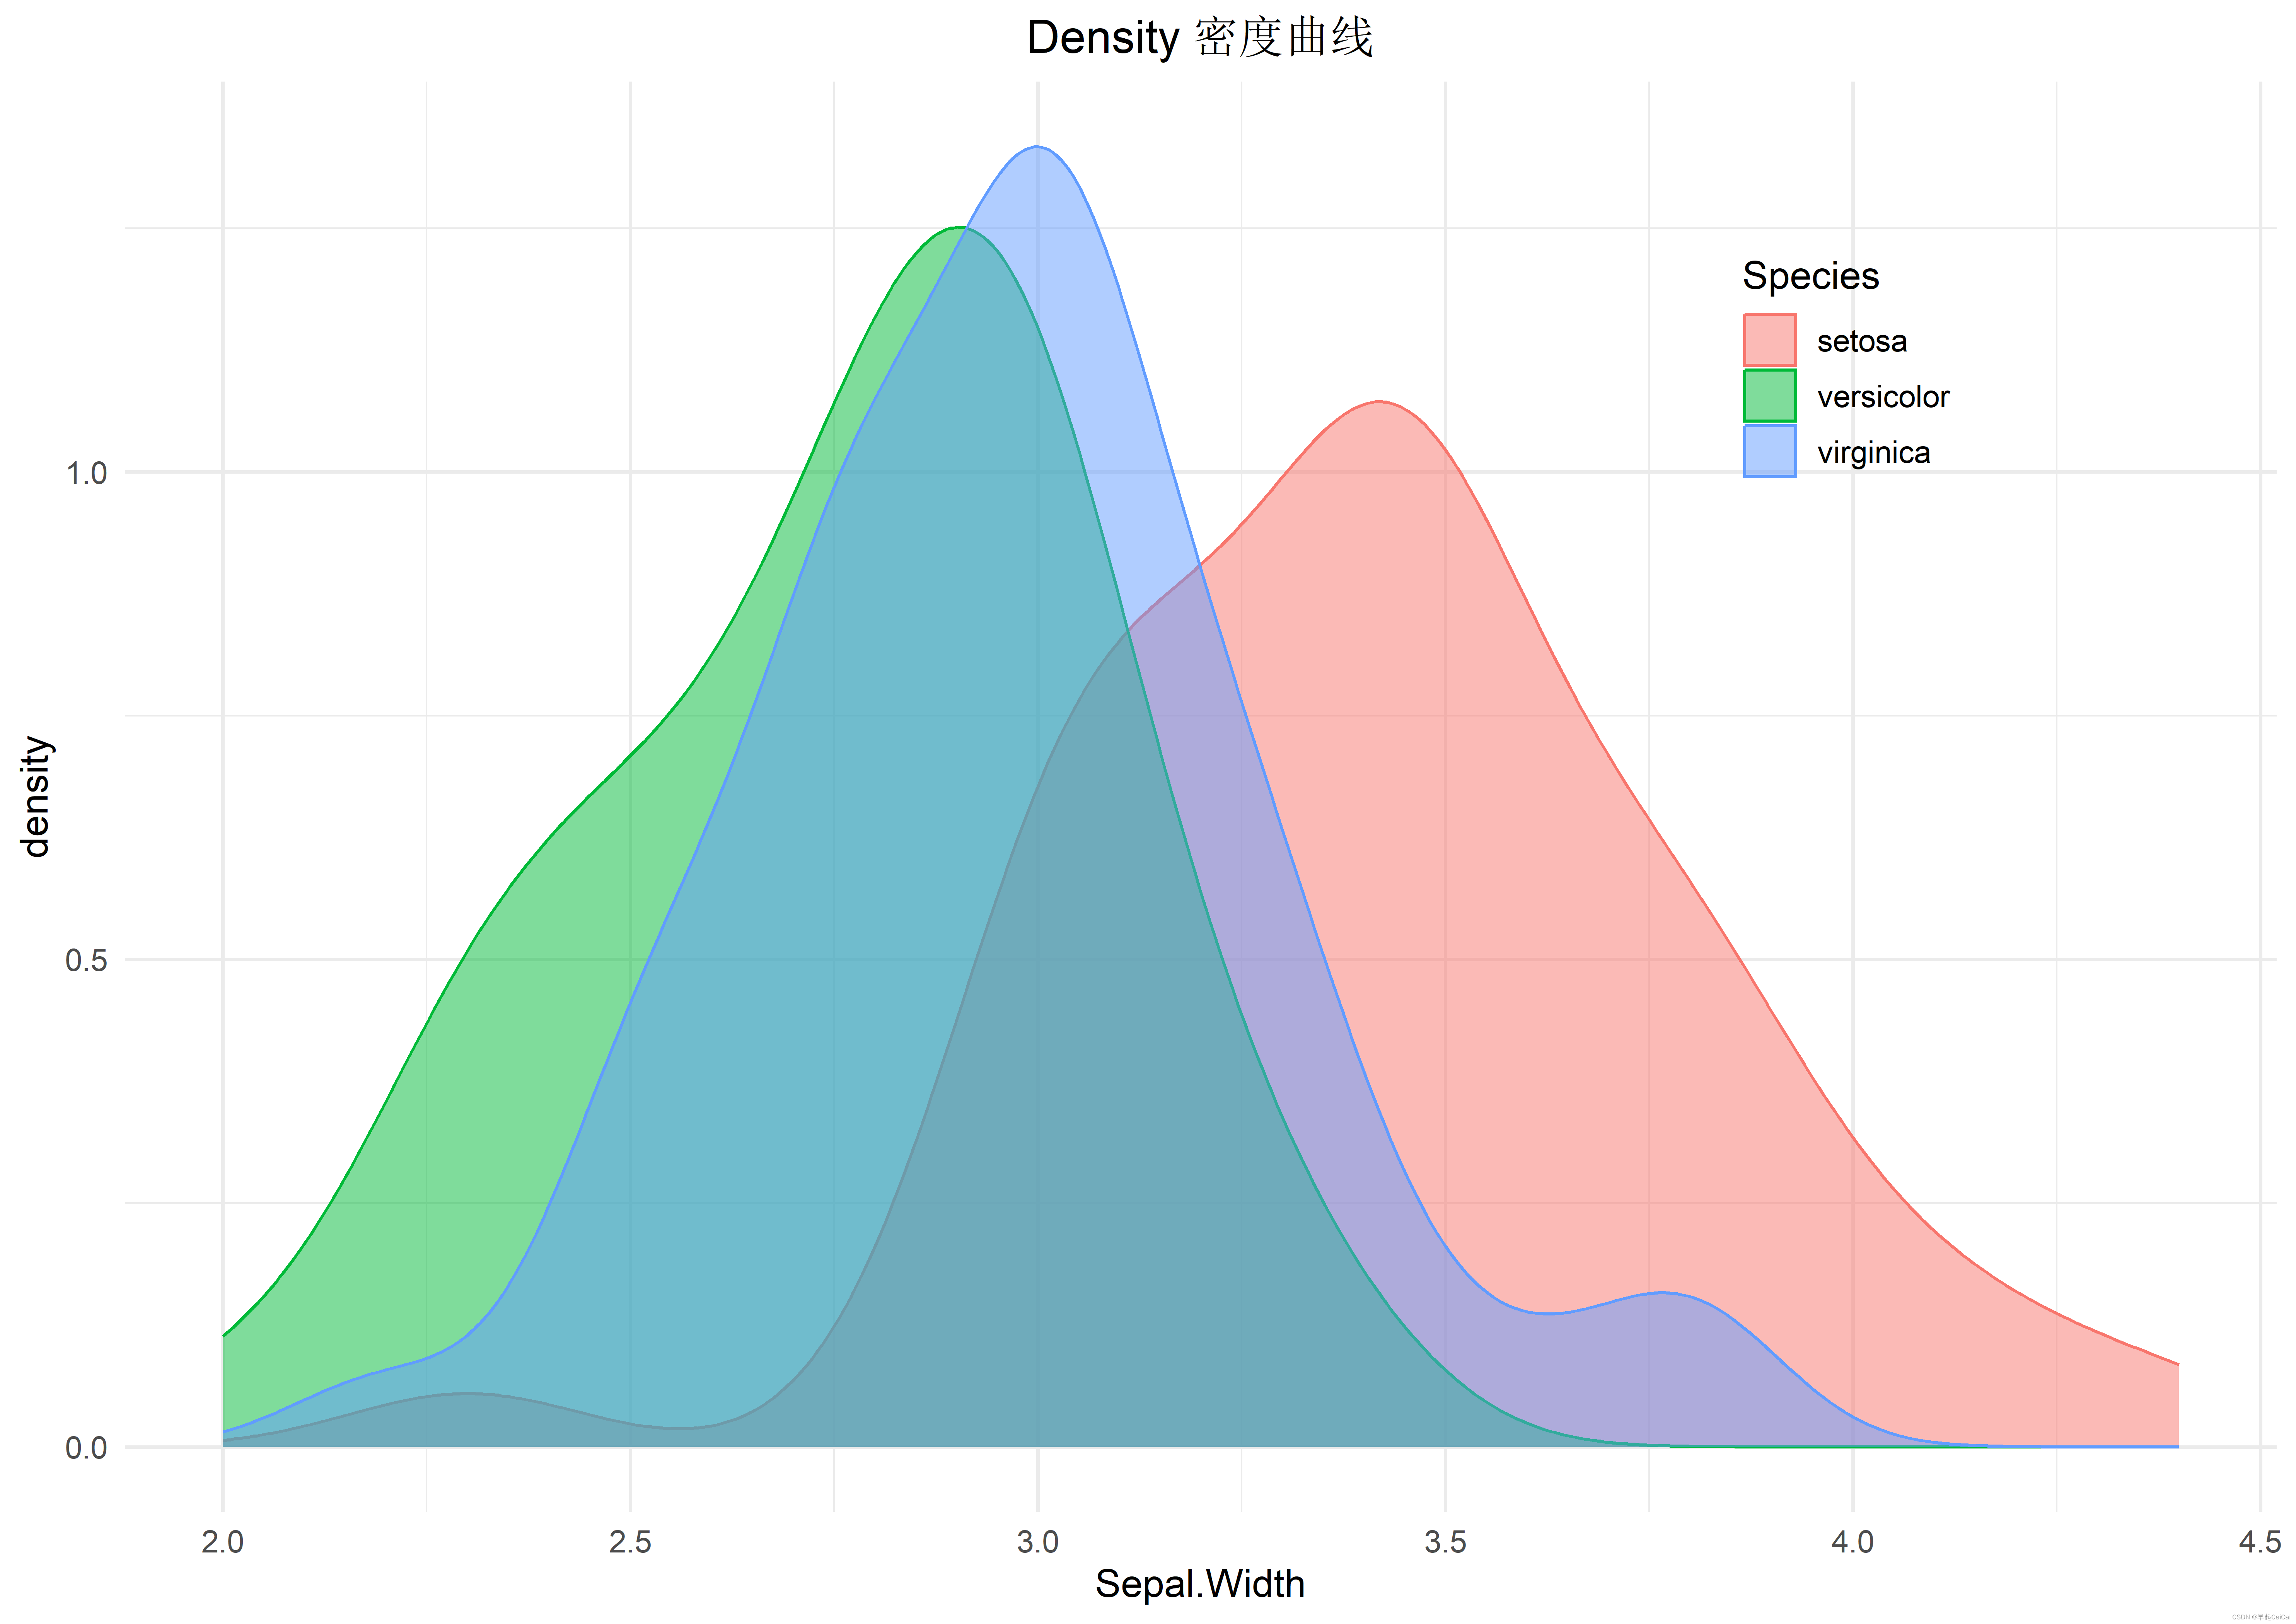
plot2 <- ggplot(iris,aes(Sepal.Width))+
  theme_minimal(base_size = 12)+
  geom_density(aes(colour = Species,fill = Species),alpha = 0.5)+
  labs(title = "Density 密度曲线")+
  theme(plot.title = element_text(hjust = 0.5),
        legend.position = c(0.8,0.8))

plot2
-
ggplot(iris, aes(Sepal.Width)): 这一行代码指定了要绘制的密度曲线图的数据集为iris,并指定了Sepal.Width作为横坐标。 -
theme_minimal(base_size = 12): 这一行代码应用了一个简约的主题(theme_minimal()),并设置了基础字体大小为12。 -
geom_density(aes(colour = Species, fill = Species), alpha = 0.5): 这一行代码添加了密度曲线,并根据Species列的值对曲线进行着色。aes(colour = Species, fill = Species)告诉ggplot函数要根据Species列的值对曲线进行着色。alpha = 0.5设置了曲线的透明度为0.5,使得重叠部分能够更容易地辨认。 -
labs(title = "Density 密度曲线"): 这一行代码为图表添加了一个标题,标题为"Density 密度曲线"。 -
theme(plot.title = element_text(hjust = 0.5), legend.position = c(0.8,0.8)): 这一行代码设置了图表的标题居中显示,并将图例放置在图表的右上角位置。







![[Python] 什么是逻辑回归模型?使用scikit-learn中的LogisticRegression来解决乳腺癌数据集上的二分类问题](https://img-blog.csdnimg.cn/direct/919cc8ec463544e4b958426332efaa51.png)
