使用unicharts实现折线图、区域图、柱状图、饼状图、雷达图、环形图、可拖动折线图
<template>
	<view class="content">
	    <view @tap="gotoPage('line')" class="list-item">
			<text>折线图</text>
		</view>
	    <view @tap="gotoPage('scrollline')" class="list-item">
			<text>可拖动折线图</text>
		</view>
	    <view @tap="gotoPage('column')" class="list-item">
			<text>柱状图</text>
		</view>
	    <view @tap="gotoPage('pie')" class="list-item">
			<text>饼状图</text>
		</view>
	    <view @tap="gotoPage('ring')" class="list-item">
			<text>环形图</text>
		</view>
	    <view @tap="gotoPage('area')" class="list-item">
			<text>区域图</text>
		</view>
	    <view @tap="gotoPage('radar')" class="list-item">
			<text>雷达图</text>
		</view>
	</view>
</template>

区域图效果预览:

区域图主要代码
<template>
	<view class="content">
	   <canvas canvas-id="areaCanvas" class="canvas" @touchstart="touchHandler"></canvas>
	</view>
</template>

<script>
	var uniCharts = require('../../../static/js/uniCharts.js');
	var areaChart = null;
	export default {
		data: {},
		onLoad: function (e) {
				var windowWidth = 320;
				try {
					var res = wx.getSystemInfoSync();
					windowWidth = res.windowWidth;
				} catch (e) {
					console.error('getSystemInfoSync failed!');
				}

				areaChart = new uniCharts({
						canvasId: 'areaCanvas',
						type: 'area',
						categories: ['1', '2', '3', '4', '5', '6'],
						animation: true,
						series: [{
								name: '成交量1',
								data: [32, 45, null, 56, 33, 34],
								format: function (val) {
										return val.toFixed(2) + '万';
								}
						}],
						yAxis: {
								title: '成交金额 (万元)',
								format: function (val) {
										return val.toFixed(2);
								},
								min: 0,
								fontColor: '#8085e9',
								gridColor: '#8085e9',
								titleFontColor: '#f7a35c'
						},
						xAxis: {
								fontColor: '#7cb5ec',
								gridColor: '#7cb5ec'
						},
						extra: {
								legendTextColor: '#cb2431'
						},
						width: windowWidth,
						height: 200
				});
		},
		methods:{
			touchHandler: function (e) {
					console.log(areaChart.getCurrentDataIndex(e));
					areaChart.showToolTip(e);
			},
		}
	}
</script>
折线图效果预览

折线图主要代码
<template>
	<view class="content">
		<canvas canvas-id="lineCanvas" class="canvas" :disable-scroll="true" @touchstart="touchHandler"></canvas>
		<button type="primary" @tap="updateData">更新数据</button>
	</view>
</template>
<script>
	var uniCharts = require('../../../static/js/uniCharts.js');
	var lineChart = null;
	export default {
		data: {
		},
		onLoad: function (e) {
			var windowWidth = 320;
			try {
				var res = uni.getSystemInfoSync();
				windowWidth = res.windowWidth;
			} catch (e) {
				console.error('getSystemInfoSync failed!');
			}

			var simulationData = this.createSimulationData();
			lineChart = new uniCharts({
				canvasId: 'lineCanvas',
				type: 'line',
				categories: simulationData.categories,
				animation: true,
				// background: '#f5f5f5',
				series: [{
					name: '成交量1',
					data: simulationData.data,
					format: function (val, name) {
						return val.toFixed(2) + '万';
					}
				}, {
					name: '成交量2',
					data: [2, 0, 0, 3, null, 4, 0, 0, 2, 0],
					format: function (val, name) {
						return val.toFixed(2) + '万';
					}
				}],
				xAxis: {
					disableGrid: true
				},
				yAxis: {
					title: '成交金额 (万元)',
					format: function (val) {
						return val.toFixed(2);
					},
					min: 0
				},
				width: windowWidth,
				height: 200,
				dataLabel: false,
				dataPointShape: true,
				extra: {
					lineStyle: 'curve'
				}
			});
		},
		methods:{

			touchHandler: function (e) {
				console.log(lineChart.getCurrentDataIndex(e));
				lineChart.showToolTip(e, {
					// background: '#7cb5ec',
					format: function (item, category) {
						return category + ' ' + item.name + ':' + item.data
					}
				});
			},
			createSimulationData: function () {
				var categories = [];
				var data = [];
				for (var i = 0; i < 10; i++) {
					categories.push('2016-' + (i + 1));
					data.push(Math.random()*(20-10)+10);
				}
				// data[4] = null;
				return {
					categories: categories,
					data: data
				}
			},
			updateData: function () {
				var simulationData = this.createSimulationData();
				var series = [{
					name: '成交量1',
					data: simulationData.data,
					format: function (val, name) {
						return val.toFixed(2) + '万';
					}
				}];
				lineChart.updateData({
					categories: simulationData.categories,
					series: series
				});
			},
		}
	}
</script>
柱状图预览效果

柱状图主要代码
<template>
	<view class="content">
		<view class="title">
			<text>{{chartTitle}}</text>
			<view v-if="!isMainChartDisplay" class="back-btn" @tap="backToMainChart">返回</view>
		</view>
	    <canvas canvas-id="columnCanvas" class="canvas" @touchstart="touchHandler"></canvas>
	    <view style="text-align:center">点击数据每一项查看详情</view>
	</view>
</template>

<script>
	var uniCharts = require('../../../static/js/uniCharts.js');
	var columnChart = null;
	var chartData = {
	    main: {
	        title: '总成交量',
	        data: [15, 20, 45, 37],
	        categories: ['2012', '2013', '2014', '2015']
	    },
	    sub: [{
	        title: '2012年度成交量',
	        data: [70, 40, 65, 100, 34, 18],
	        categories: ['1', '2', '3', '4', '5', '6']
	    }, {
	        title: '2013年度成交量',
	        data: [55, 30, 45, 36, 56, 13],
	        categories: ['1', '2', '3', '4', '5', '6']
	    }, {
	        title: '2014年度成交量',
	        data: [76, 45, 32, 74, 54, 35],
	        categories: ['1', '2', '3', '4', '5', '6']
	    }, {
	        title: '2015年度成交量',
	        data: [76, 54, 23, 12, 45, 65],
	        categories: ['1', '2', '3', '4', '5', '6']
	    }]
	};
	export default {
		data: {
				chartTitle: '总成交量',
				isMainChartDisplay: true
		},
		onReady: function (e) {
			var windowWidth = 320;
			try {
			  var res = uni.getSystemInfoSync();
			  windowWidth = res.windowWidth;
			} catch (e) {
			  console.error('getSystemInfoSync failed!');
			}

			columnChart = new uniCharts({
				canvasId: 'columnCanvas',
				type: 'column',
				animation: true,
				categories: chartData.main.categories,
				series: [{
					name: '成交量',
					data: chartData.main.data,
					format: function (val, name) {
						return val.toFixed(2) + '万';
					}
				}],
				yAxis: {
					format: function (val) {
						return val + '万';
					},
					title: 'hello',
					min: 0
				},
				xAxis: {
					disableGrid: false,
					type: 'calibration'
				},
				extra: {
					column: {
						width: 15
					}
				},
				width: windowWidth,
				height: 200,
			});
		},
		methods:{
			setData:function(obj){
				let that = this;
				Object.keys(obj).forEach(function(key){
					 that.$set(that.$data,key,obj[key])

				});
			},
			backToMainChart: function () {
				this.setData({
					chartTitle: chartData.main.title,
					isMainChartDisplay: true
				});
				columnChart.updateData({
					categories: chartData.main.categories,
					series: [{
						name: '成交量',
						data: chartData.main.data,
						format: function (val, name) {
							return val.toFixed(2) + '万';
						}
					}]
				});
			},
			touchHandler: function (e) {
				var index = columnChart.getCurrentDataIndex(e);
				if (index > -1 && index < chartData.sub.length && this.isMainChartDisplay) {
					this.setData({
						chartTitle: chartData.sub[index].title,
						isMainChartDisplay: false
					});
					columnChart.updateData({
						categories: chartData.sub[index].categories,
						series: [{
							name: '成交量',
							data: chartData.sub[index].data,
							format: function (val, name) {
								return val.toFixed(2) + '万';
							}
						}]
					});

				}
			},
		}
	}
</script>

<style>
	.title {
		text-align: center;
		position: relative;
		margin-top: 20rpx;
		margin-bottom: 20rpx;
	}
	.back-btn {
		margin-left: 20rpx;
		color: red;
	}
</style>
饼状图效果预览
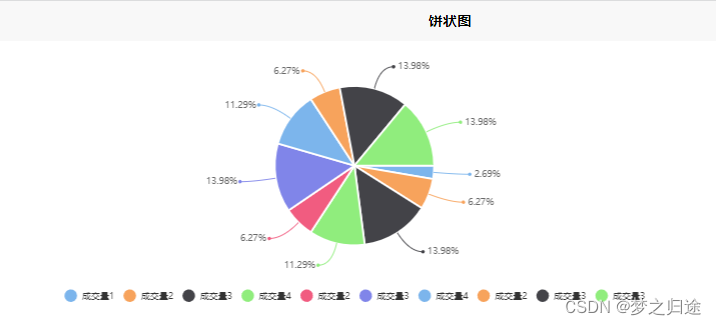
饼状图主要代码
<template>
	<view class="content">
	   <canvas canvas-id="pieCanvas" class="canvas" @touchstart="touchHandler"></canvas>
	</view>
</template>

<script>
	var uniCharts = require('../../../static/js/uniCharts.js');
	var pieChart = null;
	export default {
		data: {},
		onLoad: function (e) {
			var windowWidth = 320;
			try {
				var res = wx.getSystemInfoSync();
				windowWidth = res.windowWidth;
			} catch (e) {
				console.error('getSystemInfoSync failed!');
			}

			pieChart = new uniCharts({
				animation: true,
				canvasId: 'pieCanvas',
				type: 'pie',
				series: [{
					name: '成交量1',
					data: 15,
				}, {
					name: '成交量2',
					data: 35,
				}, {
					name: '成交量3',
					data: 78,
				}, {
					name: '成交量4',
					data: 63,
				}, {
					name: '成交量2',
					data: 35,
				}, {
					name: '成交量3',
					data: 78,
				}, {
					name: '成交量4',
					data: 63,
				}, {
					name: '成交量2',
					data: 35,
				}, {
					name: '成交量3',
					data: 78,
				}, {
					name: '成交量3',
					data: 78,
				}],
				width: windowWidth,
				height: 300,
				dataLabel: true,
			});
		},
		methods:{
			touchHandler: function (e) {
					console.log(pieChart.getCurrentDataIndex(e));
			},
		}
	}
</script>
雷达图预览效果

雷达图主要代码
<template>
	<view class="content">
	   <canvas canvas-id="radarCanvas" class="canvas"  @touchstart="touchHandler"></canvas>
	</view>
</template>

<script>
	var uniCharts = require('../../../static/js/uniCharts.js');
	var radarChart = null;
	export default {
		data: {},
		onLoad: function (e) {
			var windowWidth = 320;
			try {
				var res = wx.getSystemInfoSync();
				windowWidth = res.windowWidth;
			} catch (e) {
				console.error('getSystemInfoSync failed!');
			}

			radarChart = new uniCharts({
				canvasId: 'radarCanvas',
				type: 'radar',
				categories: ['1', '2', '3', '4', '5', '6'],
				series: [{
					name: '成交量1',
					data: [90, 110, 125, 95, 87, 122]
				}],
				width: windowWidth,
				height: 200,
				extra: {
					radar: {
						max: 150
					}
				}
			});
		},
		methods:{
			touchHandler: function (e) {
					console.log(radarChart.getCurrentDataIndex(e));
			},
		}
	}
</script>
环形图预览效果
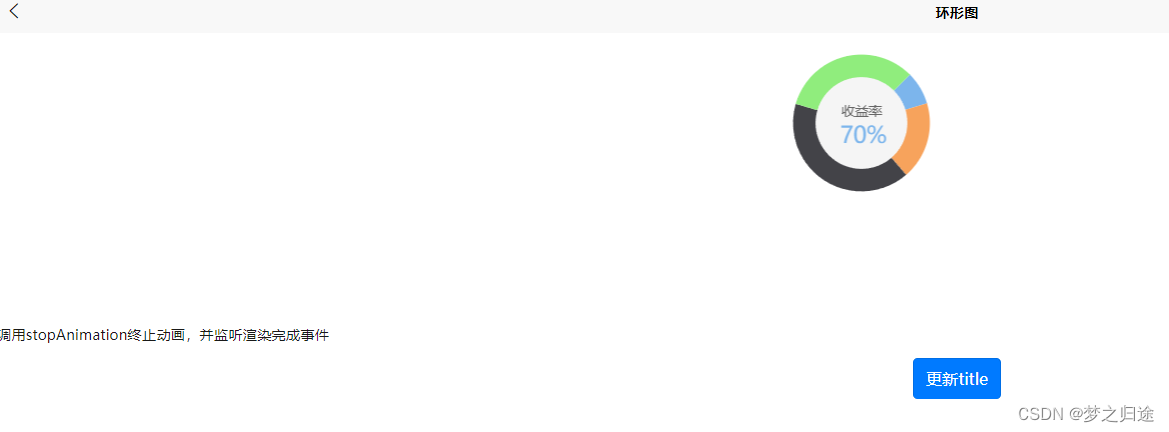
环形图主要代码
<template>
	<view class="content">
		<canvas canvas-id="ringCanvas" class="canvas" @touchstart="touchHandler"></canvas>
		<view>调用stopAnimation终止动画,并监听渲染完成事件</view>
		<button type="primary" @tap="updateData" style="margin-top:30rpx">更新title</button>
	</view>
</template>
<script>
	var uniCharts = require('../../../static/js/uniCharts.js');
	var ringChart = null;
	export default {
		data: {
		},
		onReady: function (e) {
			var windowWidth = 320;
			try {
				var res = uni.getSystemInfoSync();
				windowWidth = res.windowWidth;
			} catch (e) {
				console.error('getSystemInfoSync failed!');
			}

			ringChart = new uniCharts({
				animation: true,
				canvasId: 'ringCanvas',
				type: 'ring',
				extra: {
					ringWidth: 25,
					pie: {
						offsetAngle: -45
					}
				},
				title: {
					name: '70%',
					color: '#7cb5ec',
					fontSize: 25
				},
				subtitle: {
					name: '收益率',
					color: '#666666',
					fontSize: 15
				},
				series: [{
					name: '成交量1',
					data: 15,
					stroke: false
				}, {
					name: '成交量2',
					data: 35,
					 stroke: false
				}, {
					name: '成交量3',
					data: 78,
					stroke: false
				}, {
					name: '成交量4',
					data: 63,
					 stroke: false
				}],
				disablePieStroke: true,
				width: windowWidth,
				height: 200,
				dataLabel: false,
				legend: false,
				background: '#f5f5f5',
				padding: 0
			});
			ringChart.addEventListener('renderComplete', () => {
				console.log('renderComplete');
			});
			setTimeout(() => {
				ringChart.stopAnimation();
			}, 500);
		},
		methods:{
			touchHandler: function (e) {
				console.log(ringChart.getCurrentDataIndex(e));
			},
			updateData: function () {
				ringChart.updateData({
					title: {
						name: '80%'
					},
					subtitle: {
						color: '#ff0000'
					}
				});
			},
		}
	}
</script>
可拖动折线图预览效果

可拖动折线图主要代码
<template>
	<view class="content">
		<canvas canvas-id="lineCanvas" :disable-scroll="true" class="canvas" @touchstart="touchHandler" @touchmove="moveHandler" @touchend="touchEndHandler"></canvas>
	</view>
</template>
<script>
	var uniCharts = require('../../../static/js/uniCharts.js');
	var lineChart = null;
	var startPos = null;
	export default {
		data: {
		},
		onLoad: function (e) {
			var windowWidth = 320;
			try {
				var res = uni.getSystemInfoSync();
				windowWidth = res.windowWidth;
			} catch (e) {
				console.error('getSystemInfoSync failed!');
			}

			var simulationData = this.createSimulationData();
			lineChart = new uniCharts({
				canvasId: 'lineCanvas',
				type: 'line',
				categories: simulationData.categories,
				animation: false,
				series: [{
					name: '成交量1',
					data: simulationData.data,
					format: function (val, name) {
						return val.toFixed(2) + '万';
					}
				}],
				xAxis: {
					disableGrid: false
				},
				yAxis: {
					title: '成交金额 (万元)',
					format: function (val) {
						return val.toFixed(2);
					},
					min: 0
				},
				width: windowWidth,
				height: 200,
				dataLabel: true,
				dataPointShape: true,
				enableScroll: true,
				extra: {
					lineStyle: 'curve'
				}
			});
		},
		methods:{
			touchHandler: function (e) {
				lineChart.scrollStart(e);
			},
			moveHandler: function (e) {
				lineChart.scroll(e);
			},
			touchEndHandler: function (e) {
				lineChart.scrollEnd(e);
				lineChart.showToolTip(e, {
					format: function (item, category) {
						return category + ' ' + item.name + ':' + item.data
					}
				});
			},
			createSimulationData: function () {
				var categories = [];
				var data = [];
				for (var i = 0; i < 10; i++) {
					categories.push('201620162-' + (i + 1));
					data.push(Math.random()*(20-10)+10);
				}
				return {
					categories: categories,
					data: data
				}
			},
		}
	}
</script>
说明
如果本项目对您有帮助,欢迎 “点赞,关注” 支持一下 谢谢~
源码获取关注公众号「码农园区」,回复 【uniapp源码】






![[学习笔记]IK分词器的学习](https://img-blog.csdnimg.cn/09bbda8be10d4d4bb3d54baeeb39f004.png#pic_center)
