三相电机参数:
0.75KW,额定电流是2A,功率因数0.71,效率78.9%。制式S1.
1.负载不变时的线电压与线电流的关系

1.1相关数据与python代码:
'''
这里记录了一系列的实验:
第一组实验:近乎空载,改变电机的输入电压,查看电流的变化
第二组实验,增大负载(带动电机,励磁电流为0.50A),改变输入电压,查看电流的变化
第三组实验,增大负载(带动电机,励磁电流为0.90A),改变输入电压,查看电流的变化

'''
import matplotlib.pyplot as plt

curr_noload_50Hz = {"360":11.63, "370":12.06, "380":12.59, "390":13.12,"400":13.69, "410":14.38};
curr_500mAload_50Hz = {"360":11.91, "370":12.33, "380":12.76, "390":13.30,"400":13.90, "410":14.45};
curr_900mAload_50Hz = {"360":12.93, "370":13.33, "380":13.68, "390":14.12,"400":14.62, "410":15.18};

# 数据
freqs = ["360", "370", "380", "390", "400", "410"]
curr_noload = [11.63, 12.06, 12.59, 13.12, 13.69, 14.38]
curr_500mA = [11.91, 12.33, 12.76, 13.30, 13.90, 14.45]
curr_900mA = [12.93, 13.33, 13.68, 14.12, 14.62, 15.18]

curr_noload = [curr * 0.1 for curr in curr_noload]
curr_500mA = [curr * 0.1 for curr in curr_500mA]
curr_900mA = [curr * 0.1 for curr in curr_900mA]

# 绘制线图
plt.plot(freqs, curr_noload, label="curr_noload")
plt.plot(freqs, curr_500mA, label="curr_500mA")
plt.plot(freqs, curr_900mA, label="curr_900mA")

# 图的标题和坐标轴标签
plt.title("Current vs. Voltage of 3Phase-engine")
plt.xlabel("Voltage")
plt.ylabel("Current (A)")

# 图例
plt.legend()

# 显示图像
plt.show()
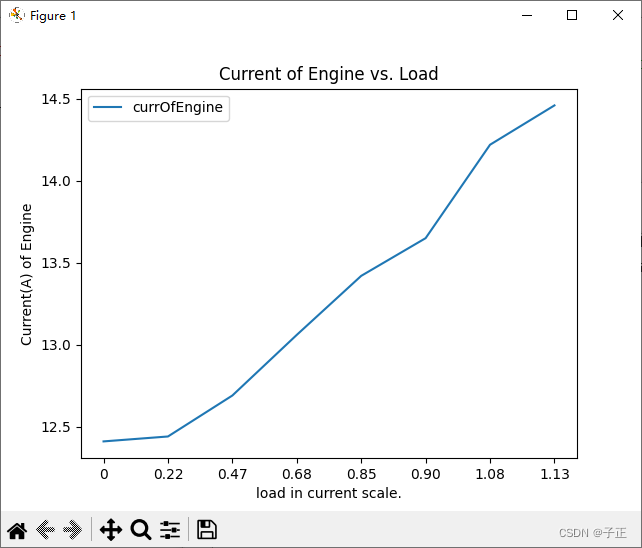
2.负载不同的输入电流源曲线:
2.1 数据与代码
import matplotlib.pyplot as plt

#第四组实验,电压固定为380V,改变负载电机的励磁电流,查看电流变化
curr_withfixVoltage = {"0": 12.41, "0.22":12.44, "0.47":12.69, "0.68": 13.06, "0.85":13.42,"0.90":13.65, "1.08":14.22,"1.13":14.46}

# 数据
loadInCurr = [key for key in curr_withfixVoltage.keys()]
currOfEngine = [item for item in curr_withfixVoltage.values()]

# 绘制线图
plt.plot(loadInCurr, currOfEngine, label="currOfEngine")

# 图的标题和坐标轴标签
plt.title("Current of Engine vs. Load")
plt.xlabel("load in current scale.")
plt.ylabel("Current(A) of Engine")

# 图例
plt.legend()

# 显示图像
plt.show()
