let datas = [
  { DivideScore: 7, UserScore: 7.2, Name: '目标制定' },
  { DivideScore: 7, UserScore: 7, Name: '具体性' },
  { DivideScore: 7, UserScore: 7.5, Name: '可衡量性' },
  { DivideScore: 7, UserScore: 7, Name: '可实现性' },
  { DivideScore: 7, UserScore: 7, Name: '时间限定' }
];
let aveList = datas.map((n) => {
  return n.DivideScore;
});
let uList = datas.map((n) => {
  return n.UserScore;
});
let nameList = datas.map((n) => {
  return n.Name;
});
option = {
  xAxis: {
    type: 'category',
    data: nameList
  },
  yAxis: {
    type: 'value',
    max: 10,
    axisLabel: {
      formatter: '{value} 分'
    }
  },
  series: [
    {
      type: 'line',
      data: uList,
      color: '#326092',
      label: {
        show: true,
        fontSize: 16,
        position: 'top'
      },
      markLine: {
        itemStyle: {
          color: '#3dc6c8'
        },
        label: {
          fontSize: 16,
          formatter: '平均分',
          itemStyle: {
            color: '#3dc6c8'
          },
          padding: [0, 0, 2.2, 0],
          position: 'end'
        },
        data: [
          [
            {
              name: '两点之间的线',
              coord: [0, aveList[0]]
            },
            {
              name: '两点之间的线',
              coord: [4, aveList[0]]
            }
          ]
        ]
      }
    }
  ]
};

let datas = [
  { UserScore: 13, Name: '11-23' },
  { UserScore: 15, Name: '11-24' },
  { UserScore: 19, Name: '11-25' },
  { UserScore: 26, Name: '11-26' },
  { UserScore: 18, Name: '11-27' },
  { UserScore: 15, Name: '11-28' },
  { UserScore: 14, Name: '11-29' }
];
let uList = datas.map((n) => {
  return n.UserScore;
});
let nameList = datas.map((n) => {
  return n.Name;
});

option = {
  tooltip: {
    trigger: 'axis'
  },
  xAxis: {
    type: 'category',
    boundaryGap: false,
    data: nameList,
    axisLabel: {
      textStyle: {
        color: '#333',
        fontSize: 20
      }
    },
    // x轴颜色
    axisLine: {
      show: false
    },
    axisTick: {
      show: false
    }
  },
  yAxis: {
    type: 'value',
    boundaryGap: [0, '30%'],
    max: 40,
    // y轴文字颜色
    axisLabel: {
      show: false,
      formatter: '{value} °C'
    },
    axisLine: {
      show: false
    },
    axisTick: {
      show: false
    },
    // 取消网格线
    splitLine: {
      show: false
    }
  },
  series: [
    {
      name: '实时温度',
      type: 'line',
      symbolSize: 8, //折线点的大小
      data: uList,
      label: {
        normal: {
          show: true,
          fontSize: 20,
          position: 'top',
          formatter: '{c} °C'
        }
      },
      color: '#0097F5'
    }
  ]
};

option = {
    tooltip: {
      trigger: 'axis'
    },
    legend: {
      data: [
        { name: '土壤含水量', icon: 'circle' },
        { name: '土壤温度', icon: 'circle' },
        { name: '土壤电导率', icon: 'circle' }
      ],
      itemWidth: 6, //宽度
      itemHeight: 6, //高度
      itemGap: 30, //间距
      textStyle: {
        color: '#333',
        fontSize: 20,
        lineHight: 20
      }
    },
    xAxis: [
      {
        type: 'category',
        axisTick: {
          alignWithLabel: true
        },
        axisLine: {
          onZero: false,
          lineStyle: {
            color: '#333'
          }
        },
        axisLabel: {//坐标轴刻度标签的相关设置。
          textStyle: {
            color: '#333',
            fontSize:20
          },
          formatter: function (params) {
            var newParamsName = "";// 最终拼接成的字符串
            var paramsNameNumber = params.length;// 实际标签的个数
            var provideNumber = 10;// 每行能显示的字的个数
            var rowNumber = Math.ceil(paramsNameNumber / provideNumber);// 换行的话,需要显示几行,向上取整
            /**
             * 判断标签的个数是否大于规定的个数, 如果大于,则进行换行处理 如果不大于,即等于或小于,就返回原标签
             */
            // 条件等同于rowNumber>1
            if (paramsNameNumber > provideNumber) {
              /** 循环每一行,p表示行 */
              for (var p = 0; p < rowNumber; p++) {
                var tempStr = "";// 表示每一次截取的字符串
                var start = p * provideNumber;// 开始截取的位置
                var end = start + provideNumber;// 结束截取的位置
                // 此处特殊处理最后一行的索引值
                if (p == rowNumber - 1) {
                  // 最后一次不换行
                  tempStr = params.substring(start, paramsNameNumber);
                } else {
                  // 每一次拼接字符串并换行
                  tempStr = params.substring(start, end) + "\n";
                }
                newParamsName += tempStr;// 最终拼成的字符串
              }

            } else {
              // 将旧标签的值赋给新标签
              newParamsName = params;
            }
            //将最终的字符串返回
            return newParamsName
          }

        },
        data: ['2020/11/24 09:56:23', '2020/11/25 09:56:23', '2020/11/26 09:56:23', '2020/11/27 09:56:23']
      }
    ],
    yAxis: [
      {
        type: 'value',
        // y轴文字颜色
        axisLabel: {
          textStyle: {
            color: '#333',
            fontSize:20
          }
        }
      }
    ],
    series: [
      {
        name: '土壤含水量',
        type: 'line',
        smooth: true,
        data: [320, 332, 301, 334]
      },
      {
        name: '土壤温度',
        type: 'line',
        smooth: true,
        data: [120, 132, 101, 134]
      },
      {
        name: '土壤电导率',
        type: 'line',
        smooth: true,
        data: [862, 1018, 964, 1026],
        markLine: {
          lineStyle: {
            type: 'dashed'
          },
          data: [
            [{ type: 'min' }, { type: 'max' }]
          ]
        }
      },
    ]
  };
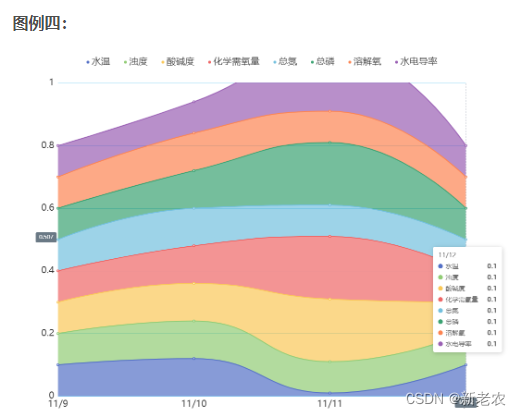
option = {
    tooltip: {
      trigger: 'axis',
      axisPointer: {
        type: 'cross',
        label: {
          backgroundColor: '#6a7985'
        }
      }
    },
    legend: {
      orient: 'horizontal',
      data: [
        {
          name: '水温',
          icon: 'circle'// 用圆点替换
        },
        {
          name: '浊度',
          icon: 'circle'
        },
        {
          name: '酸碱度',
          icon: 'circle'
        },
        {
          name: '化学需氧量',
          icon: 'circle'
        },
        {
          name: '总氮',
          icon: 'circle'
        },
        {
          name: '总磷',
          icon: 'circle'
        },
        {
          name: '溶解氧',
          icon: 'circle'
        },
        {
          name: '水电导率',
          icon: 'circle'
        }
      ],
      itemWidth: 6, //宽度
      itemHeight: 6, //高度
      itemGap: 30,  //间距
      textStyle: {
        color: '#333',
        fontSize: 16,
        lineHight: 20
      }
    },
    grid: {
      top: 100,
      left: 5,
      right: 30,
      bottom: 5,
      containLabel: true
    },
    xAxis: [
      {
        type: 'category',
        boundaryGap: false,
        data: ['11/9', '11/10', '11/11', '11/12'],
        axisLabel: {
          color: '#333',
          fontSize: 18
        },
        axisLine: {
          show: false
        },
        axisTick: {
          show: false
        }
      }
    ],
    yAxis: [
      {
        type: 'value',
        max: 1.0,
        min: 0,
        axisLabel: {
          color: '#333',
          fontSize: 16
        },
        axisLine: {
          show: false
        },
        axisTick: {
          show: false
        },
        // 网格颜色
        splitLine: {
          lineStyle: {
            color: '#00A0E9',
            opacity: 0.5
          }
        }
      }
    ],
    series: [
      {
        name: '水温',
        smooth: true,
        type: 'line',
        stack: '总量',
        areaStyle: {},
        data: [0.1, 0.12, 0.01, 0.1]
      },
      {
        name: '浊度',
        smooth: true,
        type: 'line',
        stack: '总量',
        areaStyle: {},
        data: [0.1, 0.12, 0.1, 0.1]
      },
      {
        name: '酸碱度',
        smooth: true,
        type: 'line',
        stack: '总量',
        areaStyle: {},
        data: [0.1, 0.12, 0.2, 0.1]
      },
      {
        name: '化学需氧量',
        smooth: true,
        type: 'line',
        stack: '总量',
        areaStyle: {},
        data: [0.1, 0.12, 0.2, 0.1]
      },
      {
        name: '总氮',
        smooth: true,
        type: 'line',
        stack: '总量',
        areaStyle: {},
        data: [0.1, 0.12, 0.1, 0.1]
      },
      {
        name: '总磷',
        smooth: true,
        type: 'line',
        stack: '总量',
        areaStyle: {},
        data: [0.1, 0.12, 0.2, 0.1]
      },
      {
        name: '溶解氧',
        smooth: true,
        type: 'line',
        stack: '总量',
        areaStyle: {},
        data: [0.1, 0.12, 0.1, 0.1]
      },
      {
        name: '水电导率',
        smooth: true,
        type: 'line',
        stack: '总量',
        areaStyle: {},
        data: [0.1, 0.1, 0.2, 0.1]
      },
    ]
  };

option = {
  xAxis: {
    type: 'category',
    boundaryGap: false,
    axisLabel: {
      textStyle: {
        color: '#999', //坐标的字体颜色
        fontSize: 20
      }
    },
    data: ['6月21日', '6月22日', '6月23日', '6月24日', '6月25日', '6月26日', '6月27日']
  },
  yAxis: {
    type: 'value',
    axisLabel: {
      textStyle: {
        color: '#aaa', //坐标的字体颜色
        fontSize: 20
      }
    },
    axisLine: {
      show: false
    },
    axisTick: {
      show: false
    }
  },
  tooltip: {
    trigger: 'axis'
  },
  series: [
    {
      data: [108, 100, 90, 78, 108, 128, 132],
      type: 'line',
      symbolSize: 5, //设定实心点的大小
      symbolColor: '#2e6bd3',
      areaStyle: {
        color: new echarts.graphic.LinearGradient(0, 0, 0, 1, [
          {
            offset: 0,
            color: 'rgb(48, 115,230)'
          },
          {
            offset: 1,
            color: 'rgb(13, 34, 66)'
          }
        ])
      },
      label: {
        show: true,
        position: 'top',
        textStyle: {
          color: '#999',
          fontSize: 20
        }
      },
      lineStyle: {
        color: '#2e6bd3'
      }
    }
  ]
};

option = {
  grid: {
    top: '20%',
    left: '5%',
    right: '5%',
    bottom: '3%'
  },
  title: {
    text: '期待的我',
    left: 'center'
  },
  xAxis: {
    type: 'category',
    data: ['D', 'I', 'S', 'C'],
    show: true,    // 是否显示x轴
    position: 'top',    // x轴的位置(top/bottom)
    axisTick: {
        show: false    // 是否显示坐标轴刻度
    },
    axisLabel: {
        show: true,     // 是否显示刻度标签
        interval: '0',    // 坐标轴刻度标签的显示间隔,在类目轴中有效.0显示所有
        color: '#fff',// 刻度标签文字的颜色
        width: 35,
        lineHeight: 35,    // 行高
        borderRadius: 10,
        fontSize: 20,    // 文字字体大小
        backgroundColor: '#999'

    },
    splitLine: {
        show: true,    // 是否显示分隔线。默认数值轴显示,类目轴不显示
        interval: '0',    // 坐标轴刻度标签的显示间隔,在类目轴中有效.0显示所有
        color: ['#ccc'],
        width: 3, // 分隔线线宽
        type: 'solid', // 坐标轴线线的类型(solid实线类型;dashed虚线类型;dotted点状类型)
    }
  },
  yAxis: {
    type: 'value',
    show: true,
    max: 10,
    axisLabel: {
        show: false
    },
    splitArea: {
        show: true, // 是否显示分隔区域
        interval: 0, // 坐标轴刻度标签的显示间隔,在类目轴中有效.0显示所有
        areaStyle: {
            // color分隔区域颜色。分隔区会按数组中颜色顺序依次循环设置颜色。默认是一个深浅的间隔色
            color: ['rgba(250,250,250,0.3)','rgba(200,200,200,0.3)'],
            opacity: 1, // 图形透明度。支持从0到1的数字,为0时不绘制该图形
        },
    }
  },
  visualMap: {
    show: false,
    dimension: 0,
    pieces: [
      {
        lte: 0,
        color: '#ff0000'
      },
      {
        gt: 0,
        lte: 1,
        color: '#fca906'
      },
      {
        gt: 1,
        lte: 2,
        color: '#00b050'
      },
      {
        gt: 2,
        lte: 3,
        color: '#00b1f2'
      }
    ]
  },
  series: [
    {
      type: 'line',
      lineStyle: {
          color: "#333", //线条颜色
      },
      symbol: 'circle',
      symbolSize: 20,
      data: [5, 7, 2, 8],
      itemStyle: {
        normal: {
            label: {
                show: true, // 是否显示
                position: 'right', // 显示位置
                color: '#333',
                fontSize: 20
            }
        }
    },
    markLine: {
        lineStyle: {
            type: 'solid',
        },
        // symbol: ['none', 'none'],
        label: { show: false },
        data: [
          {
            xAxis: 0,
            lineStyle: {
                color: '#ff0000'
            }
          },
          {
            xAxis: 1,
            lineStyle: {
               color: '#fca906',

            }
          },
          {
            xAxis: 2,
            lineStyle: {
               color: '#00b050'
            }
          },
          {
            xAxis: 3,
            lineStyle: {
               color: '#00b1f2',
               barWidth:260
            }
          }
        ]
      }
    }
  ]
};

option = {
  backgroundColor: '#173565',
  visualMap: [
    {
      show: false,
      type: 'continuous',
      seriesIndex: 0,
      min: 0,
      max: 400
    },
    {
      show: false,
      type: 'continuous',
      seriesIndex: 1,
      dimension: 0,
      min: 0,
      max: 100
    }
  ],
  title: [
    {
      top: '2%',
      left: 'center',
      text: '初中',
      textStyle: {
        color: '#fff',
        fontSize: 15
      }
    },
    {
      top: '55%',
      left: 'center',
      text: '高中',
      textStyle: {
        color: '#fff',
        fontSize:15
      }
    }
  ],
  tooltip: {
    trigger: 'axis'
  },
  xAxis: [
    {
      boundaryGap: false,
      axisLabel: {
        fontSize: 12,
        color: '#fff'
      },
      axisLine: {
        show: true
      },
      splitLine: {
        show: false
      },
      data: ['初一一班', '初一一班', '初一一班', '初一一班', '初一一班', '初一一班', '初一一班']
    },
    {
      gridIndex: 1,
      boundaryGap: false,
      axisLabel: {
        fontSize: 12,
        color: '#fff'
      },
      axisLine: {
        show: true
      },
      splitLine: {
        show: false
      },
      data: ['初一一班', '初一一班', '初一一班', '初一一班', '初一一班', '初一一班', '初一一班']
    }
  ],
  yAxis: [
    {
      type: 'value',
      boundaryGap: true,
      axisLabel: {
        fontSize: 12,
        color: '#fff'
      },
      axisLine: {
        show: true
      },
      splitLine: {
        show: false
      }
    },
    {
      gridIndex: 1,
      type: 'value',
      boundaryGap: true,
      axisLabel: {
        fontSize: 12,
        color: '#fff'
      },
      axisLine: {
        show: true
      },
      splitLine: {
        show: false
      }
    }
  ],
  grid: [
    {
      top: '10%',
      bottom: '55%',
      left: '7%',
      right: '7%'
    },
    {
      top: '60%',
      bottom: '5%',
      left: '7%',
      right: '7%'
    }
  ],
  series: [
    {
      type: 'line',
      smooth: true,
      data: [120, 132, 101, 134, 90, 230, 210],
      symbol: 'circle', //拐点样式
      symbolSize: 4, //拐点大小
      // 折线条的样式
      lineStyle: {
        color: 'rgba(0,0,0,0)'
      },
      // 折线拐点的样式
      itemStyle: {
        normal: { // 静止时:
          color: '#fff',
          borderColor: "#fff",//拐点的边框颜色
          borderWidth: 4
        },
        emphasis: { // 鼠标经过时:
          color: '#fff',
        }
      },
      areaStyle: {
        color: {
          type: 'linear',
          x: 0,
          y: .5,
          x2: 0,
          y2: 1,
          colorStops: [{
              offset: 0, color: '#00EAD1' // 0% 处的颜色
          }, {
              offset: 1, color: '#0055CB' // 100% 处的颜色
          }],
          global: false // 缺省为 false
        }
      }
    },
    {
      type: 'line',
      smooth: true,
      data: [120, 132, 101, 134, 90, 230, 210],
      symbol: 'circle', //拐点样式
      symbolSize: 4, //拐点大小
      // 折线条的样式
      lineStyle: {
        color: 'rgba(0,0,0,0)'
      },
      // 折线拐点的样式
      itemStyle: {
        normal: { // 静止时:
          color: '#fff',
          borderColor: "#fff",//拐点的边框颜色
          borderWidth: 4
        },
        emphasis: { // 鼠标经过时:
          color: '#fff',
        }
      },
      areaStyle: {
        opacity: 1,
        color: new echarts.graphic.LinearGradient(0, .5, 0, 1, [
          {
            offset: 0,
            color: '#FFAB2E'
          },
          {
            offset: 1,
            color: '#33B6FF'
          }
        ])
      },
      xAxisIndex: 1,
      yAxisIndex: 1
    }
  ]
};
在这里插入图片描述
option = {
  backgroundColor: '#131724',
  legend: {
    data: ['高中', '初中'],
    x: 'right',
    y: '0%',
    itemGap: 20,
    orient: 'vertical',
    textStyle: {
      color: '#fff',
      fontSize: 14
    }
  },
  tooltip: {
    trigger: 'item',
    formatter: '[{a}] {b}<br/>考试数量:{c}',
    position: 'top',
    backgroundColor: 'rgba(0,0,0,.3)',
    borderColor: 'rgba(255,255,255,.2)',
    color: '#fff',
    extraCssText: 'box-shadow: 0 0 0 rgba(255,255,255, .5); color: #fff;',
    zIndex: 400
  },
  xAxis: [
    {
      boundaryGap: true,
      axisLabel: {
        fontSize: 14,
        color: '#4FFFFA',
        interval: 0,
        rotate: 0,
        padding: [0, 0, 0, -30]
      },
      axisLine: {
        show: true,
        lineStyle: {
          color: '#2F4276'
        }
      },
      axisTick: {
        show: false
      },
      splitLine: {
        show: false
      },
      data: ['高一', '高二', '高三']
    },
    {
      boundaryGap: true,
      axisLabel: {
        fontSize: 14,
        color: '#4FFFFA',
        interval: 0,
        rotate: 0,
        padding: [0, 0, 0, 40]
      },
      position: 'bottom',
      axisLine: {
        show: true,
        lineStyle: {
          color: '#2F4276'
        }
      },
      axisTick: {
        show: false
      },
      splitLine: {
        show: false
      },
      data: ['初一', '初二', '初三']
    }
  ],
  yAxis: [
    {
      type: 'value',
      max: 10,
      name: '(班/数量)',
      // 居中
      nameLocation: 'end',
      // 坐标轴名称与轴线之间的距离。
      nameGap: 13,
      nameTextStyle: {
        color: '#2CFFF9',
        fontSize: 10,
        padding: [0, 0, 0, -30]
      },
      nameRotate: 360,
      axisLabel: {
        fontSize: 14,
        color: '#4FFFFA'
      },
      axisLine: {
        show: true,
        lineStyle: {
          color: '#2F4276'
        }
      },
      splitLine: {
        show: false
      }
    }
  ],
  grid: {
    top: '10%',
    bottom: '10%',
    left: '7%',
    right: '7%'
  },
  series: [
    {
      name: '初中',
      type: 'line',
      smooth: true,
      // 折线条的样式
      lineStyle: {
        color: {
          type: 'linear',
          x: 0,
          y: 0.5,
          x2: 0,
          y2: 1,
          colorStops: [
            {
              offset: 0,
              color: '#84A7FF' // 0% 处的颜色
            },
            {
              offset: 0.5,
              color: '#0368FF' // 50% 处的颜色
            },
            {
              offset: 1,
              color: '#5783F6' // 100% 处的颜色
            }
          ],
          global: false // 缺省为 false
        }
      },
      // 折线拐点的样式
      itemStyle: {
        normal: {
          // 静止时:
          color: 'rgba(0,0,0,0)'
        }
      },
      emphasis: {
        focus: 'series'
      },
      data: [
        { name: '初一', value: 5 },
        { name: '初二', value: 8 },
        { name: '初三', value: 3 }
      ]
    },
    {
      name: '高中',
      type: 'line',
      smooth: true,
      // 折线条的样式
      lineStyle: {
        color: {
          type: 'linear',
          x: 0,
          y: 0.5,
          x2: 0,
          y2: 1,
          colorStops: [
            {
              offset: 0,
              color: '#FF31C5' // 0% 处的颜色
            },
            {
              offset: 0.5,
              color: '#9003FF' // 50% 处的颜色
            },
            {
              offset: 1,
              color: '#FF849A' // 100% 处的颜色
            }
          ],
          global: false // 缺省为 false
        }
      },
      // 折线拐点的样式
      itemStyle: {
        normal: {
          // 静止时:
          color: 'rgba(0,0,0,0)'
        }
      },
      data: [
        { name: '高一', value: 1 },
        { name: '高二', value: 2 },
        { name: '高三', value: 9 }
      ]
    }
  ]
};

let yData = [20, 80, 60, 77];
let xTime = ['2023.3.28', '2023.4.28', '2023.5.28', '2023.6.15'];
option = {
  backgroundColor: '#000',
  tooltip: {
    trigger: 'axis',
    formatter: function (param) {
      let resultTooltip =
          "<div style='border:1px solid rgba(255,255,255,.2);padding:5px;border-radius:3px;'>" +
          "<div>" + param[0].name + "</div>" +
          "<div style='padding-top:5px; font-size:10px;color:#999;'>" +
          "<span style='display: inline-block; width: 10px; height:10px; border-radius: 50%;background: " + param[0].color + ";'></span>" +
          "<span style=''> " + param[0].seriesName + ":</span>" +
          "<span style='font-size:16px;color:" + param[0].color + "'>" + param[0].value + "</span></span>" +
          "</div>";
      return resultTooltip
    },
    position: 'right',
    padding: [5, 8],
    textStyle: {
      color: '#eee',
      fontSize: 13
    },
    axisPointer: {
      type: 'line',
      label: { show: true, backgroundColor: 'transparent' },
      lineStyle: {
        color: {
          type: 'linear',
          x: 0,
          y: 0,
          x2: 0,
          y2: 1,
          colorStops: [
            { offset: 0, color: 'rgba(100, 101, 171, 0)' },
            { offset: 0.5, color: 'rgba(100, 101, 171, 0.2)' },
            { offset: 0.999999, color: 'rgba(100, 101, 171, 1)' },
            { offset: 1, color: 'rgba(100, 101, 171, 1)' }
          ],
          global: false
        },
        type: 'solid',
        width: 40
      }
    },
    backgroundColor: 'rgba(13,5,30,.6)',
    extraCssText: 'z-index:1' // 层级
  },
  legend: {
    show: false,
    data: ['得分'],
    icon: 'circle',
    x: 'center',
    y: '0',
    itemGap: 20,
    // orient: 'vertical', // 纵向分布
    textStyle: {
      color: '#fff',
      fontSize: 12
    }
  },
  grid: {
    top: '15%',
    left: '3%',
    right: '6%',
    bottom: '2%',
    containLabel: true
  },
  xAxis: {
    type: 'category',
    boundaryGap: false,
    name: '时间',
    nameLocation: 'center',
    nameTextStyle: {
      color: '#8F8F8F',
      fontSize: 12,
      padding: [0, 0, 0, 1505]
    },
    data: xTime,
    axisLabel: {
      fontSize: 10,
      color: '#8F8F8F'
    },
    axisLine: {
      show: false
    },
    splitLine: {
      show: true,
      lineStyle: {
        color: 'rgba(62, 100, 151, 0.29)'
      }
    },
    axisTick: {
      show: false
    }
  },
  yAxis: {
    type: 'value',
    name: '百分制',
    nameLocation: 'end',
    nameGap: 10,
    max: 100,
    nameTextStyle: {
      color: '#8F8F8F',
      fontSize: 12,
      padding: [0, 0, 5, -45]
    },
    boundaryGap: true,
    interval: 10, //间隔
    axisLabel: {
      fontSize: 12,
      color: '#8F8F8F'
    },
    axisLine: {
      show: false
    },
    splitLine: {
      show: true,
      lineStyle: {
        color: 'rgba(62, 100, 151, 0.29)'
      }
    },
    axisTick: {
      show: false
    }
  },
  series: [
    {
      name: '得分',
      data: yData,
      type: 'line',
      symbolSize: 0.2, // 原点大小
      smooth: true,
      zlevel: 1, // 层级
      label: {
        normal: {
          position: 'right',
          show: true,
          color: '#eee',
          fontSize: 13,
          formatter: function (params) {
            return params.data + '分';
          }
        }
      },
      // 折线拐点的样式
      itemStyle: {
        normal: {
          // 静止时:
          color: '#0088FF',
          borderColor: '#0088FF', //拐点的边框颜色
          borderWidth: 2
        },
        emphasis: {
          // 鼠标经过时:
          color: '#4CF8C5'
        }
      },
      areaStyle: {
        color: new echarts.graphic.LinearGradient(0, 0.1, 0, 1, [
          {
            offset: 0,
            color: 'rgba(0, 199, 242, .9)'
          },
          {
            offset: 1,
            color: 'rgba(0, 199, 242, .2)'
          }
        ])
      },
      emphasis: {
        focus: 'series'
      }
    }
  ]
};


