Turf是一个用于空间分析的JavaScript库。它包括传统的空间操作、用于创建GeoJSON数据的辅助函数以及数据分类和统计工具。Turf可以作为客户端插件添加到您的网站,也可以使用Node.js在服务器端运行Turf。

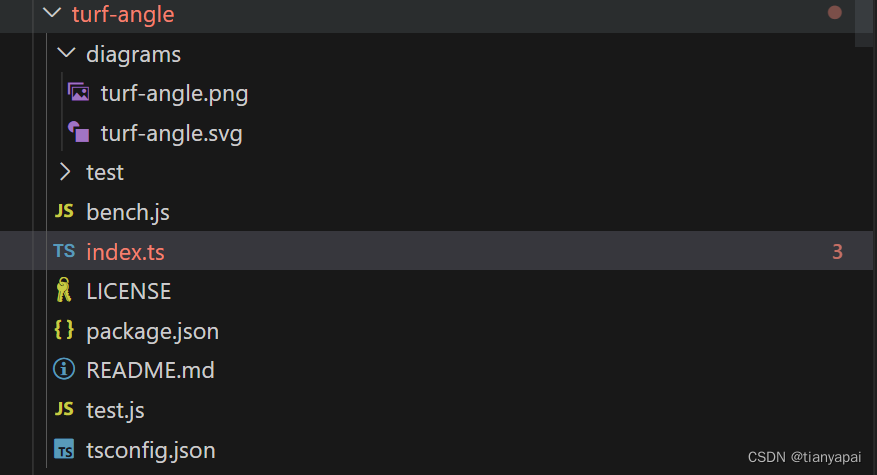
Turf是一个模块化的js类库,所有的模块都是在packages下面,每个模块下面都包含一个index.ts的源码文件,这个源码是使用typescript编写.

对于上面这个实例,本章将通过源码的方式进行解析,首先调用的是turf.pointGrid这个函数,

这个模块中的index.ts文件,代码中定义了pointGrid函数,这个函数接受如下几个参数
// 基于box边界,通过细分的方式插入点
function pointGrid<P = GeoJsonProperties>(
  bbox: BBox,      // 东南西北作为边界
  cellSide: number,// 细分时的步长
  options: {
    units?: Units; // 单位
    mask?: Feature<Polygon | MultiPolygon>; // 多边形掩码,插值点在这个范围内才算
    properties?: P;    // 属性
  } = {}
): FeatureCollection<Point, P> {
 // Default parameters
  // 默认使用千米
  if (options.mask && !options.units) options.units = "kilometers";

  // Containers
  // 结果
  var results = [];

  // 东南西北四个边界(经纬度)
  var west = bbox[0];
  var south = bbox[1];
  var east = bbox[2];
  var north = bbox[3];

  // 计算两点之间的球面距离

  // 一个单元占整个距离的百分比
  var xFraction = cellSide / distance([west, south], [east, south], options);
  // 一个单元的角度制下的距离
  var cellWidth = xFraction * (east - west);

  // 一个单元占整个距离的百分比
  var yFraction = cellSide / distance([west, south], [west, north], options);
  // 一个单元的角度制下的距离
  var cellHeight = yFraction * (north - south);

  // 宽度(角度)
  var bboxWidth = east - west;
  // 高度(角度)
  var bboxHeight = north - south;

  // 列数
  var columns = Math.floor(bboxWidth / cellWidth);
  // 行数
  var rows = Math.floor(bboxHeight / cellHeight);

  // adjust origin of the grid
  // 多出来的一部分的中间
  var deltaX = (bboxWidth - columns * cellWidth) / 2;
  var deltaY = (bboxHeight - rows * cellHeight) / 2;

  // 当前x
  var currentX = west + deltaX;

  // 计算插值点
  while (currentX <= east) {
    // 当前y
    var currentY = south + deltaY;
    while (currentY <= north) {
      // 封装要素点
      var cellPt = point([currentX, currentY], options.properties);
      if (options.mask) {
        // 点是否在掩码范围被内,只有在这个范围内才添加
        if (within(cellPt, options.mask)) results.push(cellPt);
      } else {
        // 添加到结果中
        results.push(cellPt);
      }
      currentY += cellHeight;
    }
    currentX += cellWidth;
  }

  // 封装成要素集合
  return featureCollection(results);
}
计算distance的类是turf-distance文件夹下的index.ts
// 计算距离
function distance(
  from: Coord | Point,
  to: Coord | Point,
  options: {
    units?: Units;
  } = {}
) {
  // 获取坐标数组
  var coordinates1 = getCoord(from);
  // 获取坐标数组
  var coordinates2 = getCoord(to);
  // 计算维度
  var dLat = degreesToRadians(coordinates2[1] - coordinates1[1]);
  // 计算精度
  var dLon = degreesToRadians(coordinates2[0] - coordinates1[0]);
  // 角度转换为弧度
  var lat1 = degreesToRadians(coordinates1[1]);
  var lat2 = degreesToRadians(coordinates2[1]);

  // 计算两点之间的角度
  var a =
    Math.pow(Math.sin(dLat / 2), 2) +
    Math.pow(Math.sin(dLon / 2), 2) * Math.cos(lat1) * Math.cos(lat2);

  // 弧长公式Rθ
  return radiansToLength(
    2 * Math.atan2(Math.sqrt(a), Math.sqrt(1 - a)),
    options.units
  );
}
计算等值线的类是turf-isolines文件夹下的index.ts
// 生成等值线
function isolines(
  pointGrid: FeatureCollection<Point>,// 网格点
  breaks: number[],
  options?: {
    zProperty?: string;
    commonProperties?: GeoJsonProperties;
    breaksProperties?: GeoJsonProperties[];
  }
) {
  // Optional parameters
  options = options || {};
  if (!isObject(options)) throw new Error("options is invalid");
  const zProperty = options.zProperty || "elevation";
  const commonProperties = options.commonProperties || {};
  const breaksProperties = options.breaksProperties || [];

  // Input validation
  collectionOf(pointGrid, "Point", "Input must contain Points");
  if (!breaks) throw new Error("breaks is required");
  if (!Array.isArray(breaks)) throw new Error("breaks must be an Array");
  if (!isObject(commonProperties))
    throw new Error("commonProperties must be an Object");
  if (!Array.isArray(breaksProperties))
    throw new Error("breaksProperties must be an Array");

  // Isoline methods
  // 等值线方法

  // 将网格点,按照z值构建一个只包含z值的矩阵
  const matrix = gridToMatrix(pointGrid, { zProperty: zProperty, flip: true });
  // 创建等值线
  const createdIsoLines = createIsoLines(
    matrix,
    breaks,
    zProperty,
    commonProperties,
    breaksProperties
  );
  // 重新缩放等值线
  const scaledIsolines = rescaleIsolines(createdIsoLines, matrix, pointGrid);

  // 封装成要素
  return featureCollection(scaledIsolines);
}
将所有的点构建一个z值的矩阵

export default function gridToMatrix(grid, options) {
  // Optional parameters
  options = options || {};
  if (!isObject(options)) throw new Error("options is invalid");
  var zProperty = options.zProperty || "elevation";
  var flip = options.flip;
  var flags = options.flags;

  // validation
  collectionOf(grid, "Point", "input must contain Points");

  // 按照经纬度排序
  var pointsMatrix = sortPointsByLatLng(grid, flip);

  var matrix = [];
  // create property matrix from sorted points
  // looping order matters here
  // 从排序点创建属性矩阵循环此处的顺序问题
  for (var r = 0; r < pointsMatrix.length; r++) {
    var pointRow = pointsMatrix[r];
    var row = [];
    for (var c = 0; c < pointRow.length; c++) {
      var point = pointRow[c];
      // Check if zProperty exist
      if (point.properties[zProperty]) row.push(point.properties[zProperty]);
      else row.push(0);
      // add flags
      if (flags === true) point.properties.matrixPosition = [r, c];
    }
    matrix.push(row);
  }

  return matrix;
}
// 创建等值线
function createIsoLines(
  matrix: number[][],
  breaks: number[],
  zProperty: string,
  commonProperties: GeoJsonProperties,
  breaksProperties: GeoJsonProperties[]
): Feature<MultiLineString>[] {
  const results = [];
  // 遍历中断点
  for (let i = 1; i < breaks.length; i++) {
    // 作为阈值
    const threshold = +breaks[i]; // make sure it's a number

    const properties = { ...commonProperties, ...breaksProperties[i] };
    properties[zProperty] = threshold;
    // 应该是按照矩阵中的四个点计算是否可以计算出这个阈值的插值点
    const isoline = multiLineString(isoContours(matrix, threshold), properties);

    results.push(isoline);
  }
  return results;
}
// 等压线
export default function isoContours(data, threshold, options) {
  /* process options */
  options = options ? options : {};

  var optionKeys = Object.keys(defaultSettings);

  for (var i = 0; i < optionKeys.length; i++) {
    var key = optionKeys[i];
    var val = options[key];
    val =
      typeof val !== "undefined" && val !== null ? val : defaultSettings[key];

    settings[key] = val;
  }

  if (settings.verbose)
    console.log(
      "MarchingSquaresJS-isoContours: computing isocontour for " + threshold
    );

    // 计算等压线网格
  var ret = contourGrid2Paths(computeContourGrid(data, threshold));

  if (typeof settings.successCallback === "function")
    settings.successCallback(ret);

  return ret;
}
/* assume that x1 == 1 && x0 == 0 */
// 线性插值
function interpolateX(y, y0, y1) {
return (y - y0) / (y1 - y0);
}
/* compute the isocontour 4-bit grid */
// 计算等压线4为的网格
function computeContourGrid(data, threshold) {
// 行数、列数
var rows = data.length - 1;
var cols = data[0].length - 1;
//
var ContourGrid = { rows: rows, cols: cols, cells: [] };
// 遍历行数
for (var j = 0; j < rows; ++j) {
ContourGrid.cells[j] = [];
// 遍历列数
for (var i = 0; i < cols; ++i) {
/* compose the 4-bit corner representation */
var cval = 0;
//取出相邻的四个点
var tl = data[j + 1][i];
var tr = data[j + 1][i + 1];
var br = data[j][i + 1];
var bl = data[j][i];
if (isNaN(tl) || isNaN(tr) || isNaN(br) || isNaN(bl)) {
continue;
}
// 检索阈值是否在四个高度内部,还是外部,四个值都高于阈值8421=15,或者四个值都低于阈值在外部0
cval |= tl >= threshold ? 8 : 0;
cval |= tr >= threshold ? 4 : 0;
cval |= br >= threshold ? 2 : 0;
cval |= bl >= threshold ? 1 : 0;
/* resolve ambiguity for cval == 5 || 10 via averaging */
var flipped = false;
// 在对角线上
if (cval === 5 || cval === 10) {
// 计算平均值
var average = (tl + tr + br + bl) / 4;
// 两个对角线上的中点值偏离比较远,
if (cval === 5 && average < threshold) {
cval = 10; // 取另外一个对角线来确定
flipped = true;
} else if (cval === 10 && average < threshold) {
cval = 5;
flipped = true;
}
}
/* add cell to ContourGrid if it contains edges */
// 如果单元格包含边,则将其添加到ContourGrid
// 阈值在四个点内部
if (cval !== 0 && cval !== 15) {
var top, bottom, left, right;
top = bottom = left = right = 0.5;
/* interpolate edges of cell */
if (cval === 1) { // 一个点在上,其他三个点都在下面
// 插值左边
left = 1 - interpolateX(threshold, tl, bl);
// 插值下边
bottom = 1 - interpolateX(threshold, br, bl);
} else if (cval === 2) {
bottom = interpolateX(threshold, bl, br);
right = 1 - interpolateX(threshold, tr, br);
} else if (cval === 3) {
left = 1 - interpolateX(threshold, tl, bl);
right = 1 - interpolateX(threshold, tr, br);
} else if (cval === 4) {
top = interpolateX(threshold, tl, tr);
right = interpolateX(threshold, br, tr);
} else if (cval === 5) {
top = interpolateX(threshold, tl, tr);
right = interpolateX(threshold, br, tr);
bottom = 1 - interpolateX(threshold, br, bl);
left = 1 - interpolateX(threshold, tl, bl);
} else if (cval === 6) {
bottom = interpolateX(threshold, bl, br);
top = interpolateX(threshold, tl, tr);
} else if (cval === 7) {
left = 1 - interpolateX(threshold, tl, bl);
top = interpolateX(threshold, tl, tr);
} else if (cval === 8) {
left = interpolateX(threshold, bl, tl);
top = 1 - interpolateX(threshold, tr, tl);
} else if (cval === 9) {
bottom = 1 - interpolateX(threshold, br, bl);
top = 1 - interpolateX(threshold, tr, tl);
} else if (cval === 10) {
top = 1 - interpolateX(threshold, tr, tl);
right = 1 - interpolateX(threshold, tr, br);
bottom = interpolateX(threshold, bl, br);
left = interpolateX(threshold, bl, tl);
} else if (cval === 11) {
top = 1 - interpolateX(threshold, tr, tl);
right = 1 - interpolateX(threshold, tr, br);
} else if (cval === 12) {
left = interpolateX(threshold, bl, tl);
right = interpolateX(threshold, br, tr);
} else if (cval === 13) {
bottom = 1 - interpolateX(threshold, br, bl);
right = interpolateX(threshold, br, tr);
} else if (cval === 14) {
left = interpolateX(threshold, bl, tl);
bottom = interpolateX(threshold, bl, br);
} else {
console.log(
"MarchingSquaresJS-isoContours: Illegal cval detected: " + cval
);
}
ContourGrid.cells[j][i] = {
cval: cval, // 代表的是top、right、bottom、left中哪两个值有效果
flipped: flipped,
top: top,
right: right,
bottom: bottom,
left: left,
};
}
}
}
return ContourGrid;
}// 计算等值点组成的路径
function contourGrid2Paths(grid) {
var paths = [];
var path_idx = 0;
var epsilon = 1e-7;
grid.cells.forEach(function (g, j) {
g.forEach(function (gg, i) {
if (typeof gg !== "undefined" && !isSaddle(gg) && !isTrivial(gg)) {
var p = tracePath(grid.cells, j, i);
var merged = false;
/* we may try to merge paths at this point */
if (p.info === "mergeable") {
/*
search backwards through the path array to find an entry
that starts with where the current path ends...
*/
var x = p.path[p.path.length - 1][0],
y = p.path[p.path.length - 1][1];
for (var k = path_idx - 1; k >= 0; k--) {
if (
Math.abs(paths[k][0][0] - x) <= epsilon &&
Math.abs(paths[k][0][1] - y) <= epsilon
) {
for (var l = p.path.length - 2; l >= 0; --l) {
paths[k].unshift(p.path[l]);
}
merged = true;
break;
}
}
}
if (!merged) paths[path_idx++] = p.path;
}
});
});
return paths;
}总结:
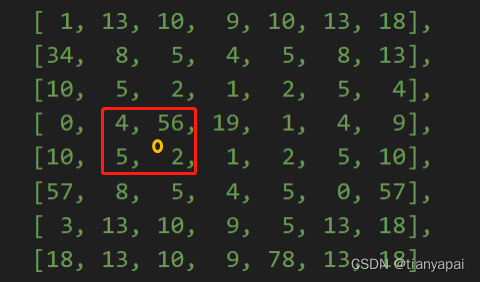
具体的做法是按照给定的采样点,插值(例如反距离权重)成矩阵,将高度值构建成矩阵,将矩阵中的四个相邻的值取出来,按照给定的阈值进行线性插值定位,计算z值对应的经纬度,这就构成一个插值后的xyz值,将这些值按照路径拼起来就是等直线了
参考:
等值线 | Turf.js中文网
GitHub - Turfjs/turf: A modular geospatial engine written in JavaScript
等值线 | Turf.js中文网

