目录
- 1 简介
- 2 安装
- 3 基础概念
- 3.1 画布Graph
- 3.2 基类Cell
- 3.3 节点Node
- 3.4 边Edge
- 4 使用
- 4.1 创建节点
- 4.2 节点连线
- 4.3 事件系统
- 5 总结
1 简介
AntV是一个数据可视化(https://x6.antv.antgroup.com/)的工具(https://antv.vision/zh/ ),可以方便的创建图表或者其他图形,让我们的页面开发比较轻松的让数据可视化。进入网站后,我们可以看到七个模块:
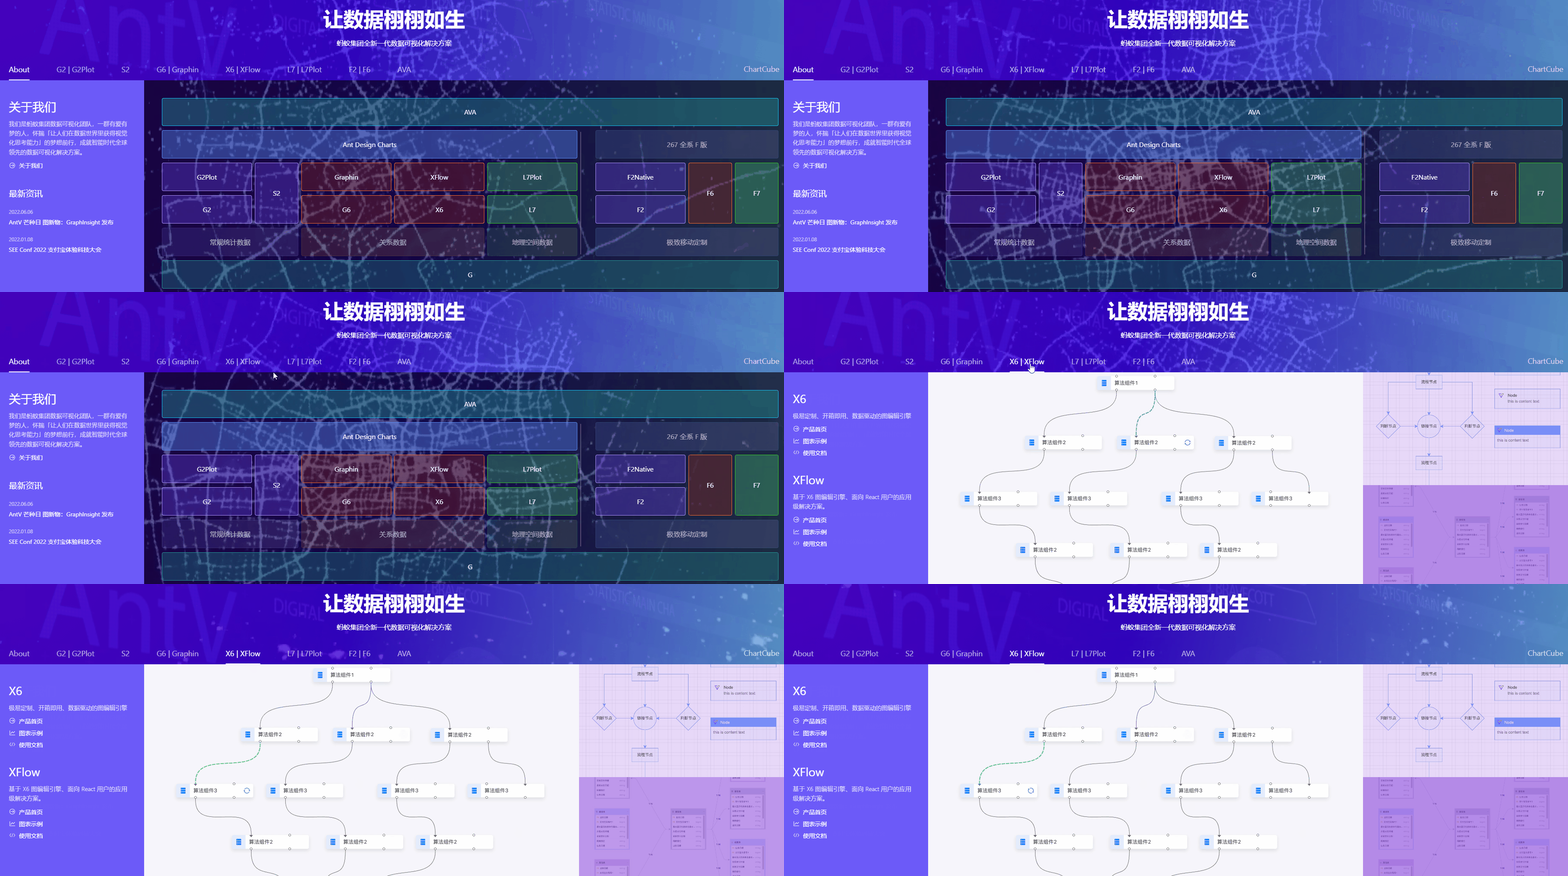
G2:数据驱动,高度易用,可扩展的可视化图形语法
S2:开箱即用的多维可视分析表格
G6:便捷的关系数据可视化引擎与图分析工具
X6:极易定制、开箱即用、数据驱动的图编辑引擎
L7:高性能、高渲染质量的地理空间数据可视化框架
F2:专注于移动端的可视化解决方案,兼容
H5/小程序/Weex 等多端环境 AVA:AVA 是为了更简便的可视分析而生的技术框架
2 安装
通过npm或yarn 命令安装x6
# npm
$npm install @anv/x6 --save
# yarn
$yarn add @antv/x6
安装完成之后,使用import或require进行引用。
import { Graph } from 'antv/x6'
3 基础概念
3.1 画布Graph
在x6中,Graph是图的载体,它包含图上的所有元素(节点、边等),同时挂载了图的相关操作(如交互监听、元素操作等)。
const graph = new Graph({
  panning:true //支持平移
  selecting: {
    enabled: true, //支持选中
    multiple: true,
    movable: true, //支持拖动
  }
}
graph.zoom(0.2) //在原来缩放级别上增加0.2
graph.zoom(-0.2) //在原来缩放级别上减少0.2
3.2 基类Cell
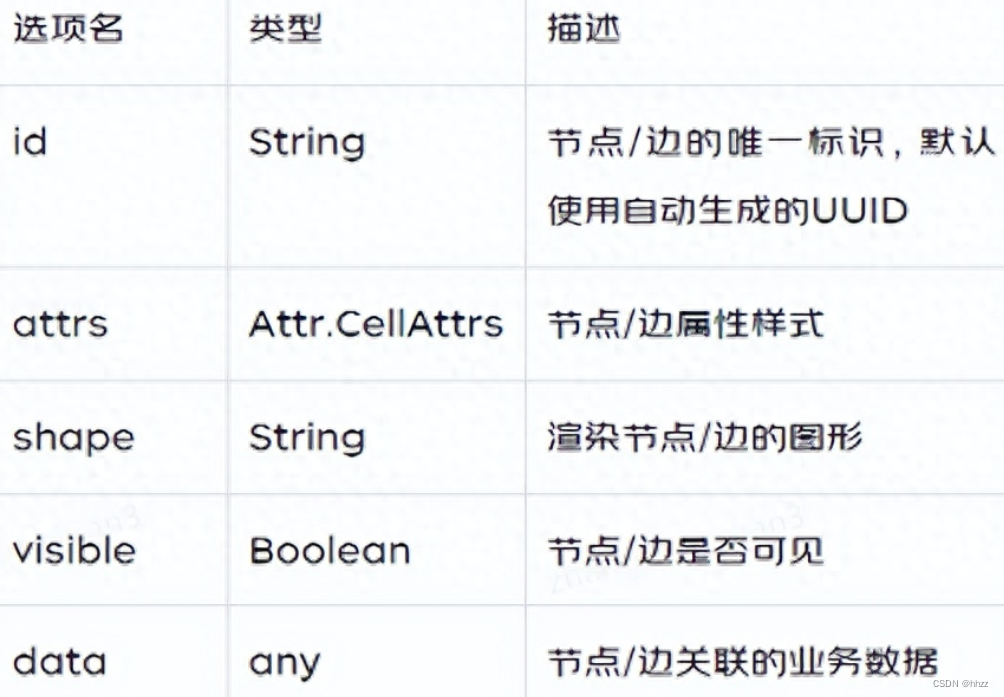
基类Cell定义了节点和边共同属性和方法,如属性样式、可见性、业务数据。

cell有一些基础选项:
3.3 节点Node
node是所有节点的基类,继承自Cell,并定义了节点的通用属性和方法。
size:定义节点大小,是一个包含width和height属性的对象,可以通过size()方法来获取和设置节点大小。
position:节点位置,是一个包含x和y属性的对象。
angle:节点的旋转角度,旋转中心为节点的中心。
3.4 边Edge
source: 源对象。
target: 目标对象。source 和 target 都可以是任何元素,区别是,source 是起点,target 是终点。 例如,con-nector 中的箭头总是从 source 指向 target。
connector: 连接线。
vertices:路径点,是一个数组。边从起点开始,按顺序经过路径点,最后到达终点。
4 使用
4.1 创建节点
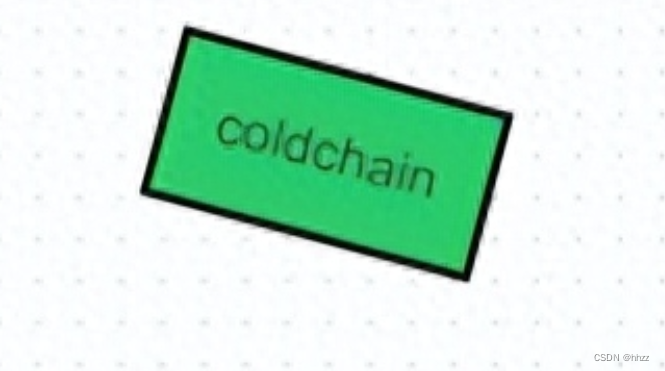
1.使用构造函数。 X6 的 Shape 命名空间中内置了一些基础节点,如 Rect、Circle、Ellipse 等,可以使用这些节点的构造函数来创建节点。
import { Shape } from '@antv/x6'

// 创建节点
const rect = new Shape.Rect({
  x: 100,
  y: 200,
  width: 80,
  height: 40,
  angle: 15,
  attrs: {
    body: {
      fill: '#2ECC71', // 背景颜色
      stroke: '#000', // 边框颜色
    },
    label: {
      text: 'coldchain', // 文本
      fill: '#333', // 文字颜色
      fontSize: 13, // 文字大小
    },
  },
})

// 添加到画布
graph.addNode(rect)
2.使用VUE节点
Graph.registerNode("my-count", {  //将vue组件注册到系统中
  inherit: "vue-shape",  //指定节点类型为vue-shape
  x: 200,
  y: 150,
  width: 150,
  height: 100,
  component: {
    template: `<Count />`,
    components: {
      Count,
    },
  },
});

graph.addNode({
  id: "1",
  shape: "my-count", //将节点的 shape 属性指定为注册的节点名称
  x: 400,
  y: 150,
  width: 150,
  height: 100,
  data: {
    num: 0,
  },
});
这样,我们就可以自定义节点,大大增加了节点的可扩展性。
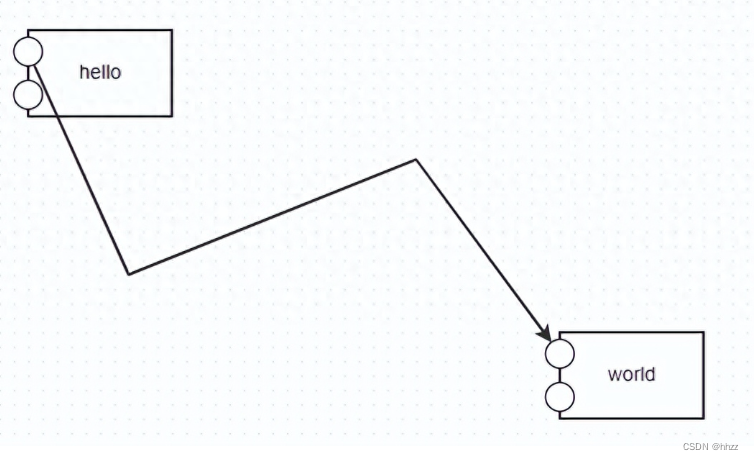
4.2 节点连线
const rect1 = graph.addNode({
      x: 30,
      y: 30,
      width: 100,
      height: 60,
      label: 'hello',
      id:'coldChain01',
      ports: [  //设置连接桩
        { id: 'port1' },
        { id: 'port2' },
      ],
    })

    const rect2 = graph.addNode({
      x: 400,
      y: 240,
      width: 100,
      height: 60,
      label: 'world',
      id:'coldChain02',
      ports: [
        { id: 'port3' },
        { id: 'port4' },
      ],
    })

    graph.addEdge({
      source: {cell:'coldChain01',port:'port1'}, //起点id和连接桩id
      target: {cell:'coldChain02',port:'port3'}, //终点id和连接桩id
      vertices: [
        { x: 100, y: 200 },
        { x: 300, y: 120 },
      ],
    })
  }
4.3 事件系统
antv-x6支持丰富的鼠标事件,如下:
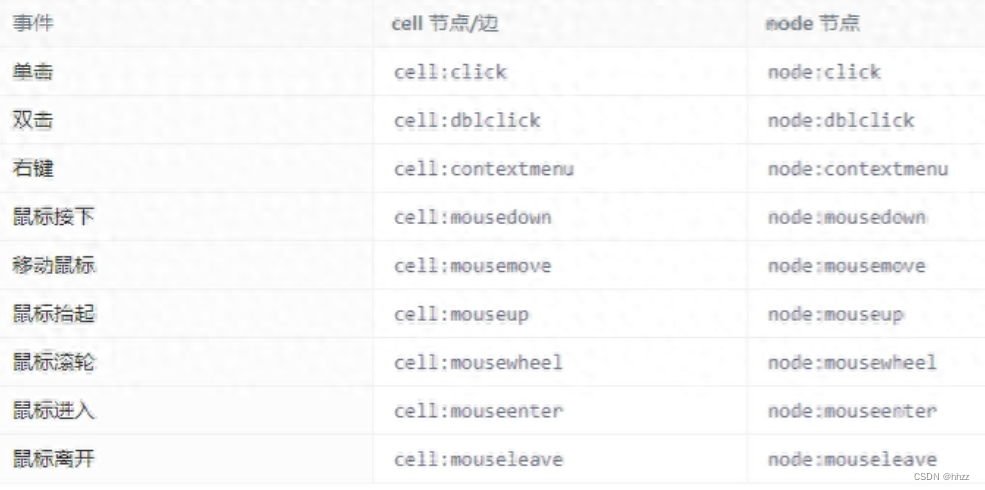
graph.on('cell:click', ({ e, x, y, cell, view }) => { })
通过graph.on函数即可实现对事件的监听,例如流程图中就用到了单击、双击、鼠标移入、移出等事件。除此之外,antv-x6还支持自定义事件。
node.attr({
  // 表示一个删除按钮,点击时删除该节点
  image: {
    event: 'node:delete',
    xlinkHref: 'trash.png',
    width: 20,
    height: 20,
  },
})
graph.on('node:delete', ({ view, e }) => {
  e.stopPropagation()
  view.cell.remove()
})

5 总结
antv-x6是一个功能强大、可扩展性高的可视化工具,提供了一系列开箱即用的交互软件和简单易用的节点定制能力,能够帮助使用者便捷地创建流程图、ER图等交互性较强的应用。本次分享介绍了x6的基本功能,更多高级功能有待我们进一步学习和探索。

