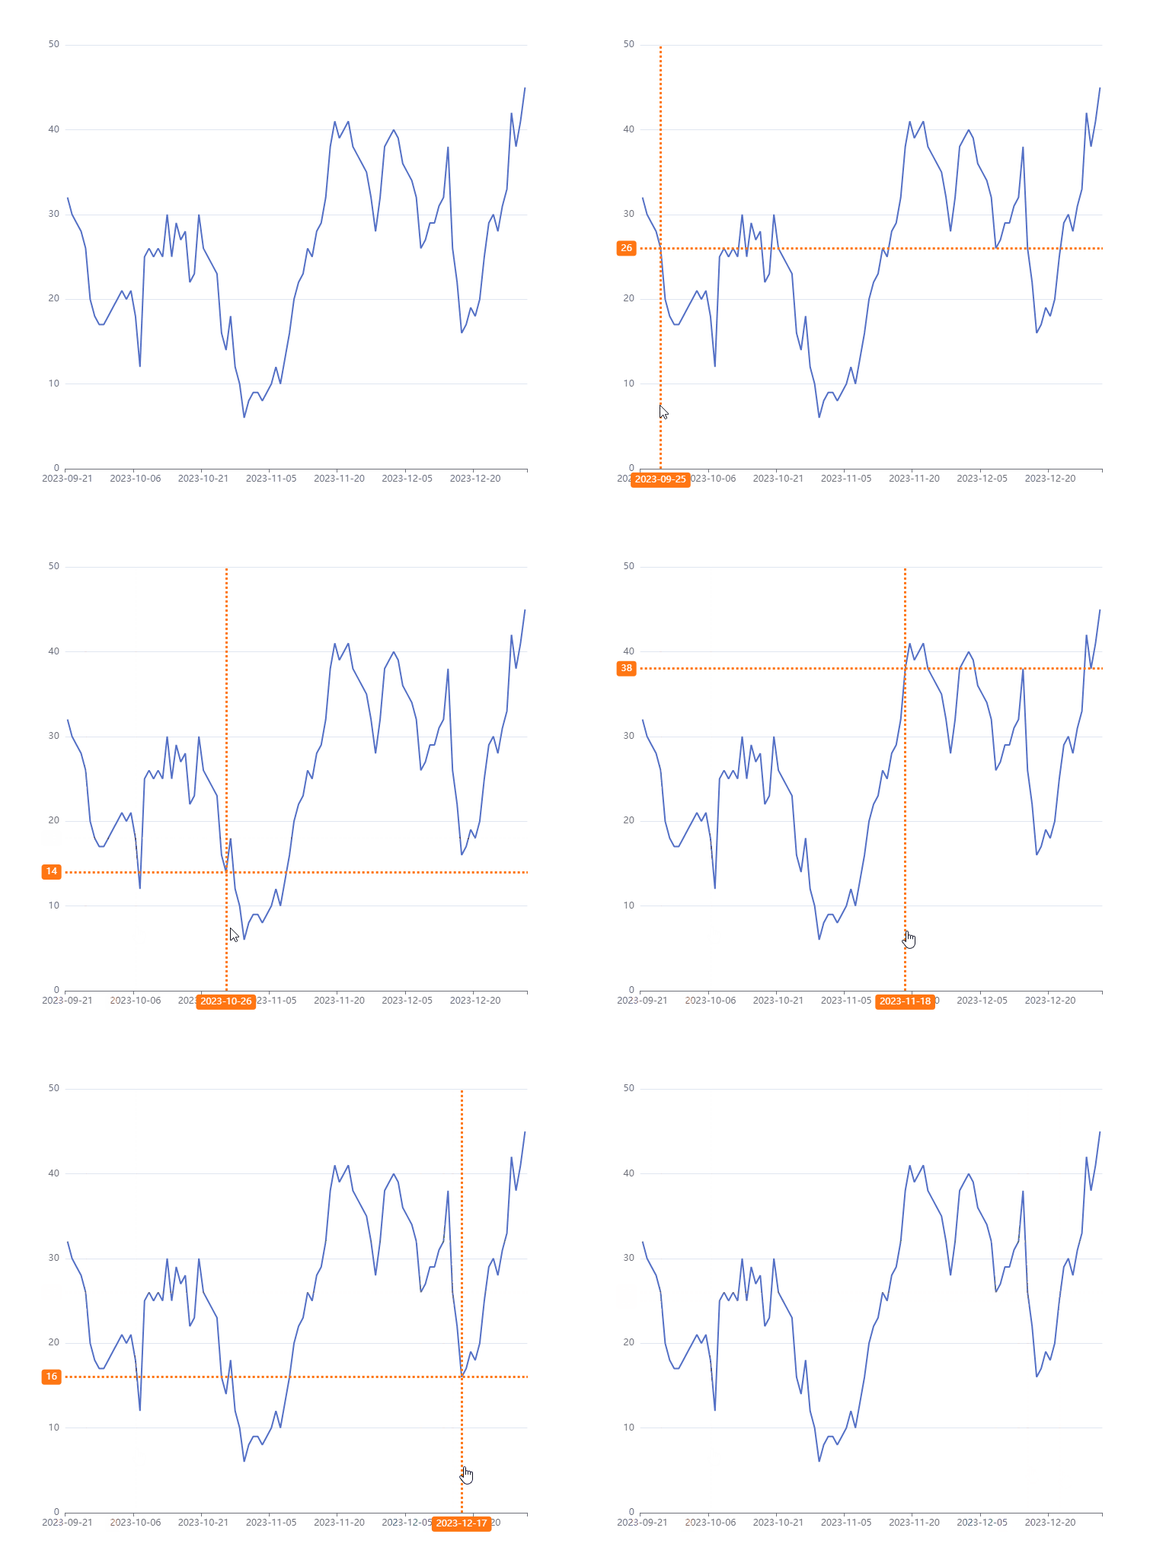
产品有个需求,需要在echart折线上展示横纵向坐标系,echart的axisPointer默认是展示在鼠标当前位置的,不符合需求,所以是使用markline实现的
先上效果图
实现思路
- 横纵线的x轴线是比较容易的,因为echart的axixPointer的位置是鼠标当前坐标作的,所以x轴线直接用toltip的axisPointer
tooltip: {
trigger: "axis",
triggerOn: "mousemove",
backgroundColor: "#FFFFFF",
formatter: function () {},
axisPointer: {
type: "line",
label: {
show: true,
backgroundColor: "#FF7613",
borderRadius: 4,
fontSize: 11,
padding: [4, 5]
},
lineStyle: {
color: "#FF7613",
type: "dotted",
width: 3
}
}
},
- y轴线则使用的series的markLine,只需要把默认的箭头去掉接口
series: [
{
type: "line",
data: data,
symbol: "none",
label: {
show: false
},
markLine: {
symbol: "none",
animation: false,
label: {
normal: {
show: true,
position: "start",
backgroundColor: "#FF7613",
borderRadius: 4,
fontSize: 12,
padding: [4, 6],
color: "#FFFFFF"
}
},
lineStyle: {
normal: {
color: "#FF7613",
type: "dotted",
width: 3
}
},
emphasis: {
label: {
normal: {
show: false
}
},
lineStyle: {
normal: {
color: "#FF7613",
type: "dotted",
width: 1
}
}
},
data: []
}
}
]
- 第二步的markLine的data是空数组,这样是不会展示的线的
- 需要在鼠标移动过程中实时画线,所以需要监听echart的mousemove事件,获取当前鼠标位置再转换成对应的坐标,最终得到实际的x轴位置(也就是当前x轴的下标),然后读取series的data[x]即可
- 在展示markLine时候,需要展示axisPopinter,通过echart的dispatchAction(showtip)展示
- 下面代码有注释每一步的作用
myChart.getZr().on("mousemove", (params) => {
let pointInPixel = [params.offsetX, params.offsetY];
let x = myChart.convertFromPixel({ seriesIndex: 0 }, pointInPixel)[0];
const xAxis = option.xAxis;
const xData = xAxis.data;
if (x > xData.length - 1) {
x = xData.length - 1;
} else if (x < 0) {
x = 0;
}
const markLineValue = option.series[0].data[x];
const { series } = option;
series[0].markLine.data = [
{
yAxis: markLineValue
}
];
myChart.dispatchAction({
type: "showTip",
seriesIndex: 0,
dataIndex: x
});
myChart.setOption({ series }, { lazyUpdate: true });
});
- 还需要添加一下鼠标移出mouseout事件,把markLine和axisPointer隐藏
myChart.getZr().on("mouseout", () => {
const { series } = option;
series[0].markLine.data = [];
myChart.setOption({ series }, { lazyUpdate: true });
});
window.addEventListener("resize", myChart.resize);
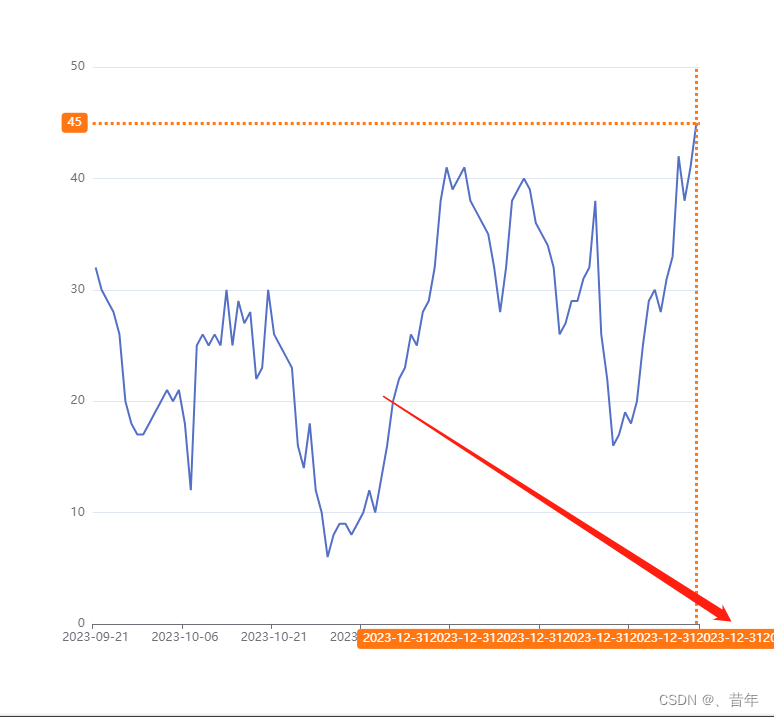
解释一下为什么不用markline做x轴的线,因为markLine的label会被echart遮挡(并不像axisPointer的label会自适应位置),可以调整grid的right,使右边空出来地方来展示label,但是这样web端还好,对于移动端就有点尴尬,浪费空间,建议使用axisPointer
const dom = document.getElementById("chart-container");
var myChart = echarts.init(dom, null, {
renderer: "canvas",
useDirtyRect: false
});
const data = [ 32, 30, 29, 28, 26, 20, 18, 17, 17, 18, 19, 20, 21, 20, 21, 18, 12, 25, 26, 25, 26, 25, 30, 25, 29, 27, 28, 22, 23, 30, 26, 25, 24, 23, 16, 14, 18, 12, 10, 6, 8, 9, 9, 8, 9, 10, 12, 10, 13, 16, 20, 22, 23, 26, 25, 28, 29, 32, 38, 41, 39, 40, 41, 38, 37, 36, 35, 32, 28, 32, 38, 39, 40, 39, 36, 35, 34, 32, 26, 27, 29, 29, 31, 32, 38, 26, 22, 16, 17, 19, 18, 20, 25, 29, 30, 28, 31, 33, 42, 38, 41, 45];
const xData = [ "2023-09-21", "2023-09-22", "2023-09-23", "2023-09-24", "2023-09-25", "2023-09-26", "2023-09-27", "2023-09-28", "2023-09-29", "2023-09-30", "2023-10-01", "2023-10-02", "2023-10-03", "2023-10-04", "2023-10-05", "2023-10-06", "2023-10-07", "2023-10-08", "2023-10-09", "2023-10-10", "2023-10-11", "2023-10-12", "2023-10-13", "2023-10-14", "2023-10-15", "2023-10-16", "2023-10-17", "2023-10-18", "2023-10-19", "2023-10-20", "2023-10-21", "2023-10-22", "2023-10-23", "2023-10-24", "2023-10-25", "2023-10-26", "2023-10-27", "2023-10-28", "2023-10-29", "2023-10-30", "2023-10-31", "2023-11-01", "2023-11-02", "2023-11-03", "2023-11-04", "2023-11-05", "2023-11-06", "2023-11-07", "2023-11-08", "2023-11-09", "2023-11-10", "2023-11-11", "2023-11-12", "2023-11-13", "2023-11-14", "2023-11-15", "2023-11-16", "2023-11-17", "2023-11-18", "2023-11-19", "2023-11-20", "2023-11-21", "2023-11-22", "2023-11-23", "2023-11-24", "2023-11-25", "2023-11-26", "2023-11-27", "2023-11-28", "2023-11-29", "2023-11-30", "2023-12-01", "2023-12-02", "2023-12-03", "2023-12-04", "2023-12-05", "2023-12-06", "2023-12-07", "2023-12-08", "2023-12-09", "2023-12-10", "2023-12-11", "2023-12-12", "2023-12-13", "2023-12-14", "2023-12-15", "2023-12-16", "2023-12-17", "2023-12-18", "2023-12-19", "2023-12-20", "2023-12-21", "2023-12-22", "2023-12-23", "2023-12-24", "2023-12-25", "2023-12-26", "2023-12-27", "2023-12-28", "2023-12-29", "2023-12-30", "2023-12-31"];
const option = {
tooltip: {
trigger: "axis",
triggerOn: "mousemove",
backgroundColor: "#FFFFFF",
formatter: function () {},
axisPointer: {
type: "line",
label: {
show: true,
backgroundColor: "#FF7613",
borderRadius: 4,
fontSize: 11,
padding: [4, 5]
},
lineStyle: {
color: "#FF7613",
type: "dotted",
width: 3
}
}
},
grid: {
left: "10%",
right: "10%",
bottom: "10%",
top: "10%",
containLabel: true
},
xAxis: {
type: "category",
data: xData
},
yAxis: {
type: "value"
},
series: [
{
type: "line",
data: data,
symbol: "none",
label: {
show: false
},
markLine: {
symbol: "none",
animation: false,
label: {
normal: {
show: true,
position: "start",
backgroundColor: "#FF7613",
borderRadius: 4,
fontSize: 12,
padding: [4, 6],
color: "#FFFFFF"
}
},
lineStyle: {
normal: {
color: "#FF7613",
type: "dotted",
width: 3
}
},
emphasis: {
label: {
normal: {
show: false
}
},
lineStyle: {
normal: {
color: "#FF7613",
type: "dotted",
width: 1
}
}
},
data: []
}
}
]
};
myChart.setOption(option);
myChart.getZr().on("mousemove", (params) => {
let pointInPixel = [params.offsetX, params.offsetY];
let x = myChart.convertFromPixel({ seriesIndex: 0 }, pointInPixel)[0];
const xAxis = option.xAxis;
const xData = xAxis.data;
if (x > xData.length - 1) {
x = xData.length - 1;
} else if (x < 0) {
x = 0;
}
const markLineValue = option.series[0].data[x];
const { series } = option;
series[0].markLine.data = [
{
yAxis: markLineValue
}
];
myChart.dispatchAction({
type: "showTip",
seriesIndex: 0,
dataIndex: x
});
myChart.setOption({ series }, { lazyUpdate: true });
});
myChart.getZr().on("mouseout", () => {
const { series } = option;
series[0].markLine.data = [];
myChart.setOption({ series }, { lazyUpdate: true });
});
window.addEventListener("resize", myChart.resize);








![[Git入门]---gitee注册及代码提交](https://img-blog.csdnimg.cn/893e5841d7e545b1bba839e9cc795b53.png)

