这系列文章主要是完成一个图谱的自定义修改(最近太忙了长篇分段更新自己使用流程)
1. 连接线修改成动态,并添加跟随线移动的光圈
2. 自定义卡片样式和文字内容
3. 自定义伸缩节点的样式,并添加动画样式
3. 自定义弹窗样式
4. 自定义弹窗样式
5. 更新图谱
6. 设置分支跟踪定位功能
antv-G6知识图谱安装--使用(实例)
- 官网地址➡️[添加链接描述](https://g6.antv.antgroup.com/manual/introduction)
- 前言
- 1. 安装---引入antv/g6
- 2. 官网指引
- 3. 找一个实例作自定义修改
- 1. 先择一个dome图谱
- 2. 在vue2+js中使用
- 1. 创建vue文件并引入`import G6 from '@antv/g6';`
- 2. 复制官网图谱实例(附上代码)
- 3. 设置流动线,链接线上自定义一个运动的小球
- 1. 官网dome地址
- 2. 结合官网修改代码
- 3. 运行后样式
- 4 . 更新图谱
- 5. 支点跟随--聚焦一个节点
- 1. 官网地址
- 2. graph.render();后添加聚焦节点代码
- 3. 运行后效果
- 下篇地址[自定义卡片--收缩节点并添加动画--自定义弹窗样式](https://blog.csdn.net/men_gqi/article/details/132476175?spm=1001.2014.3001.5502)
官网地址➡️添加链接描述
前言
提示:antv-G6初次使用(实例+分析注释)项目需要时间紧,直接网上找的加上官网信息,主要内容都有注释
1. 安装—引入antv/g6
- 在项目中使用 NPM 包引入
npm install --save @antv/g6
- 在需要用的 G6 的 JS 文件中导入:
import G6 from '@antv/g6';

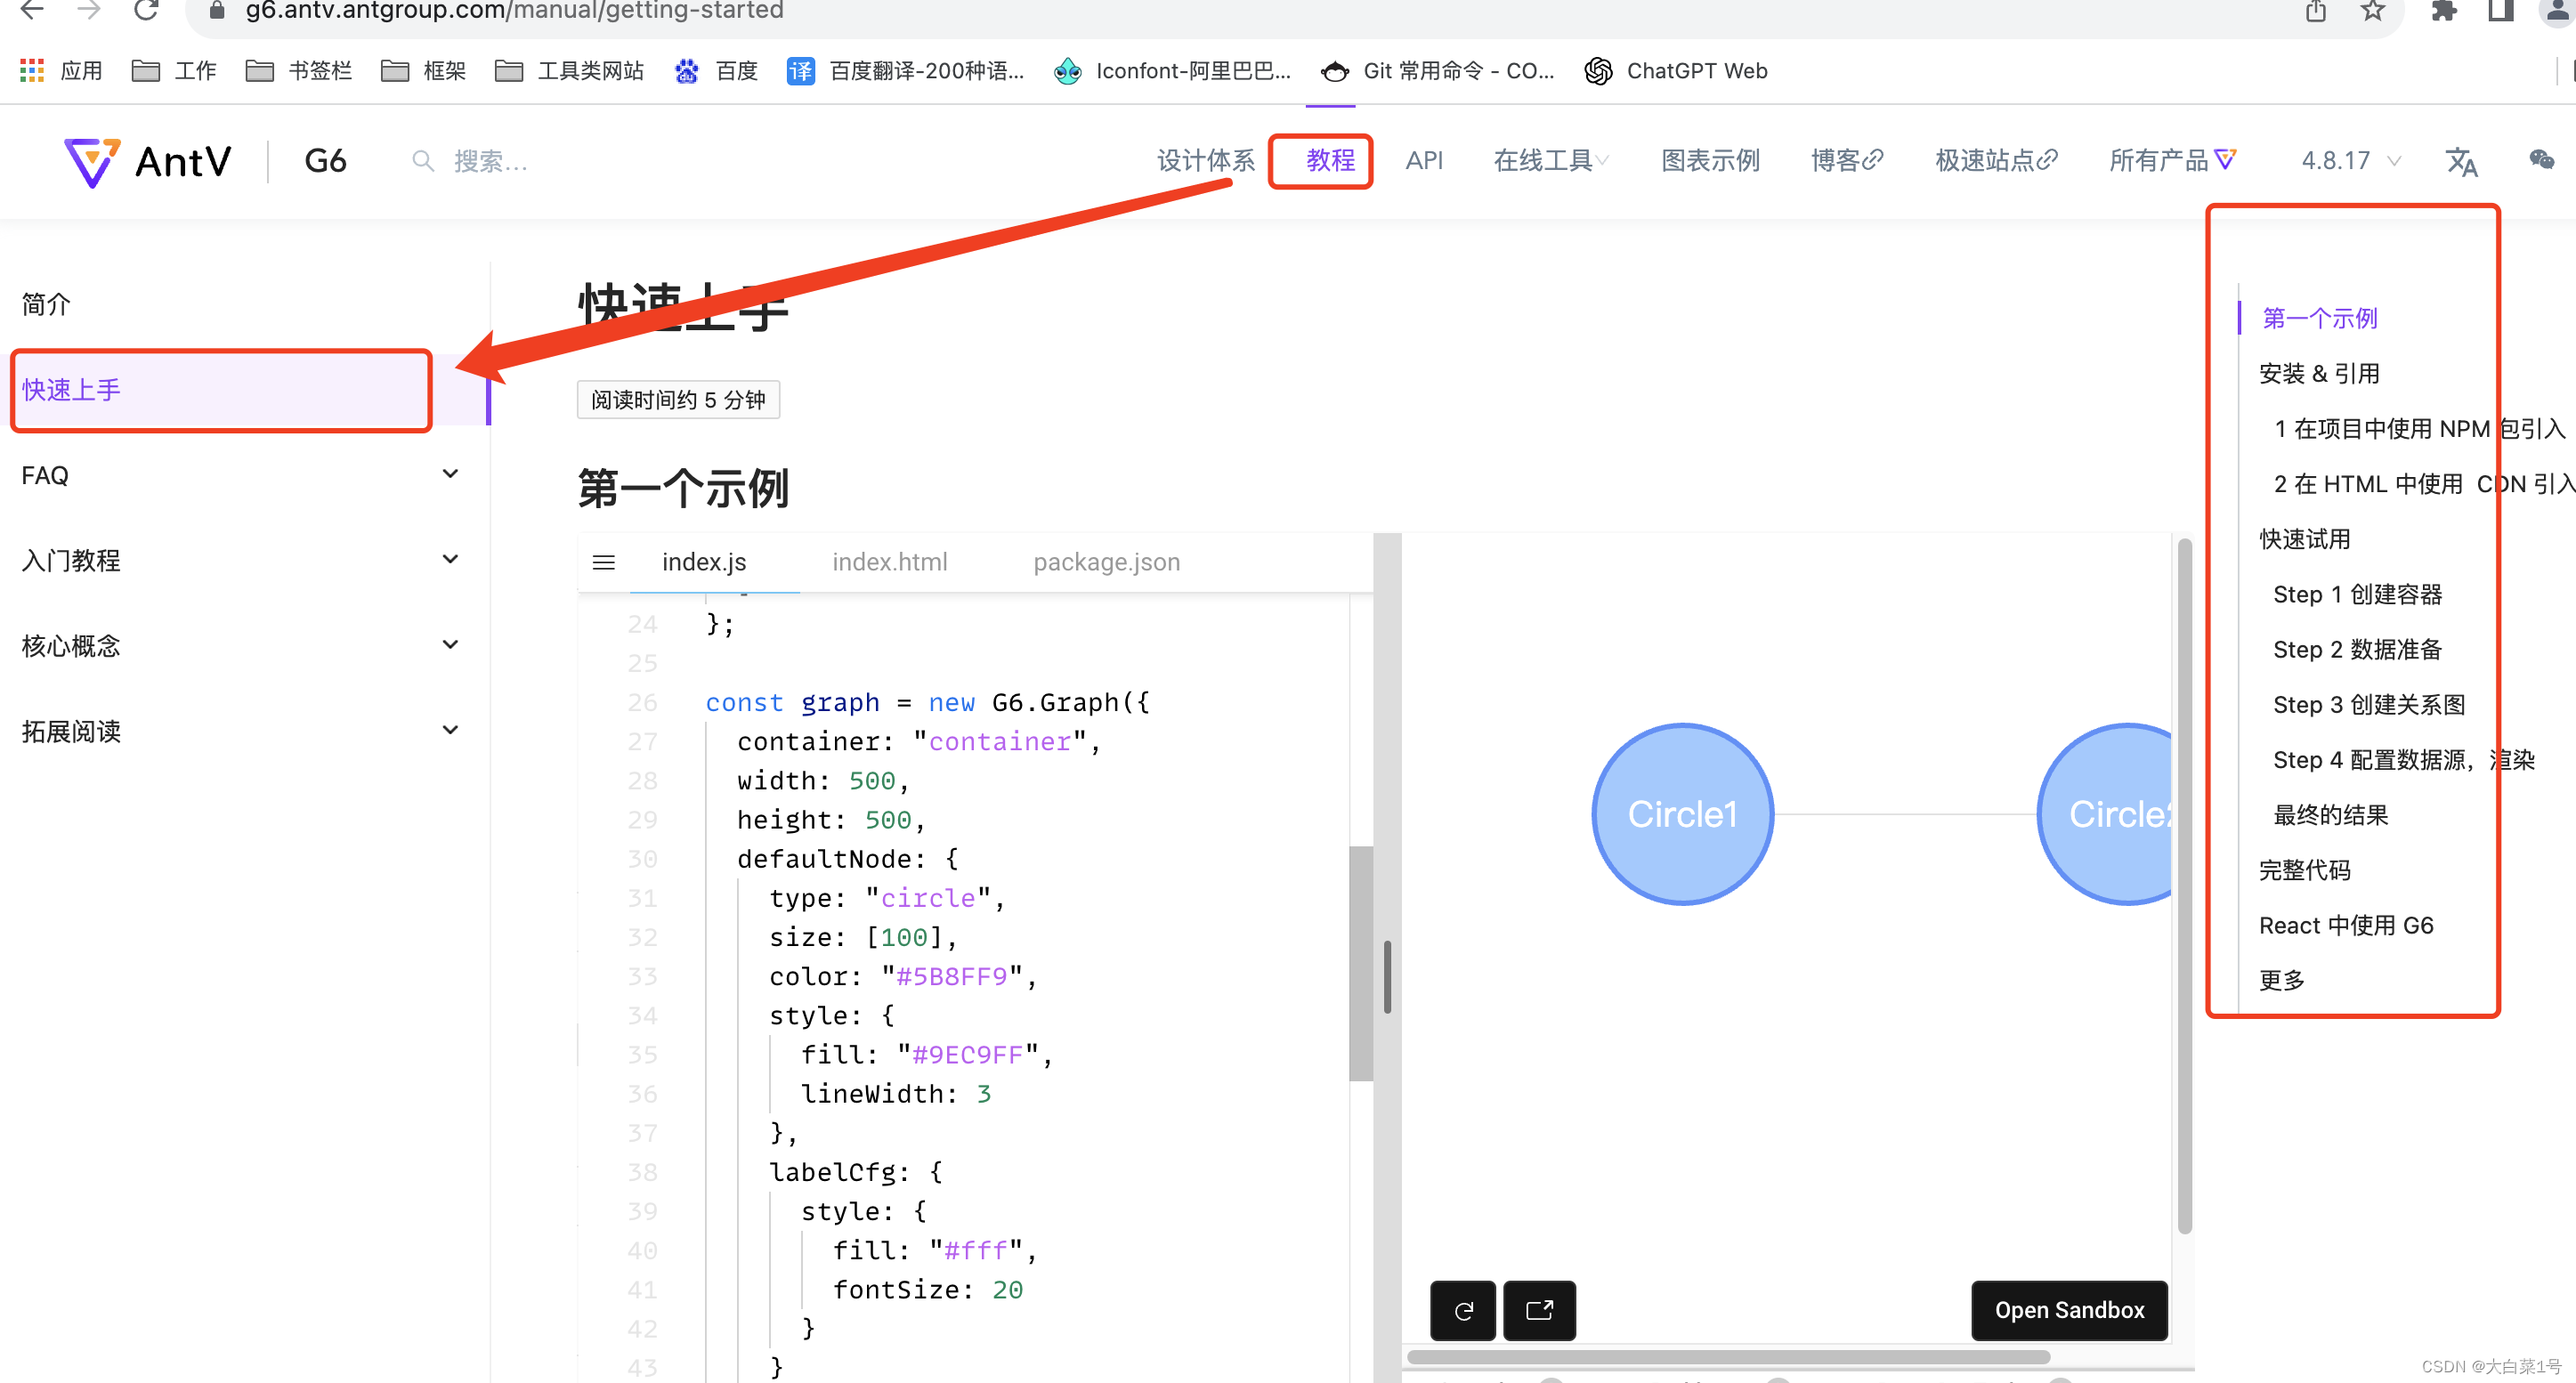
2. 官网指引
按照一下创建一个项目之后,大概知道了图谱绘制流程,个人觉得和echart使用有点点相似
3. 找一个实例作自定义修改
1. 先择一个dome图谱
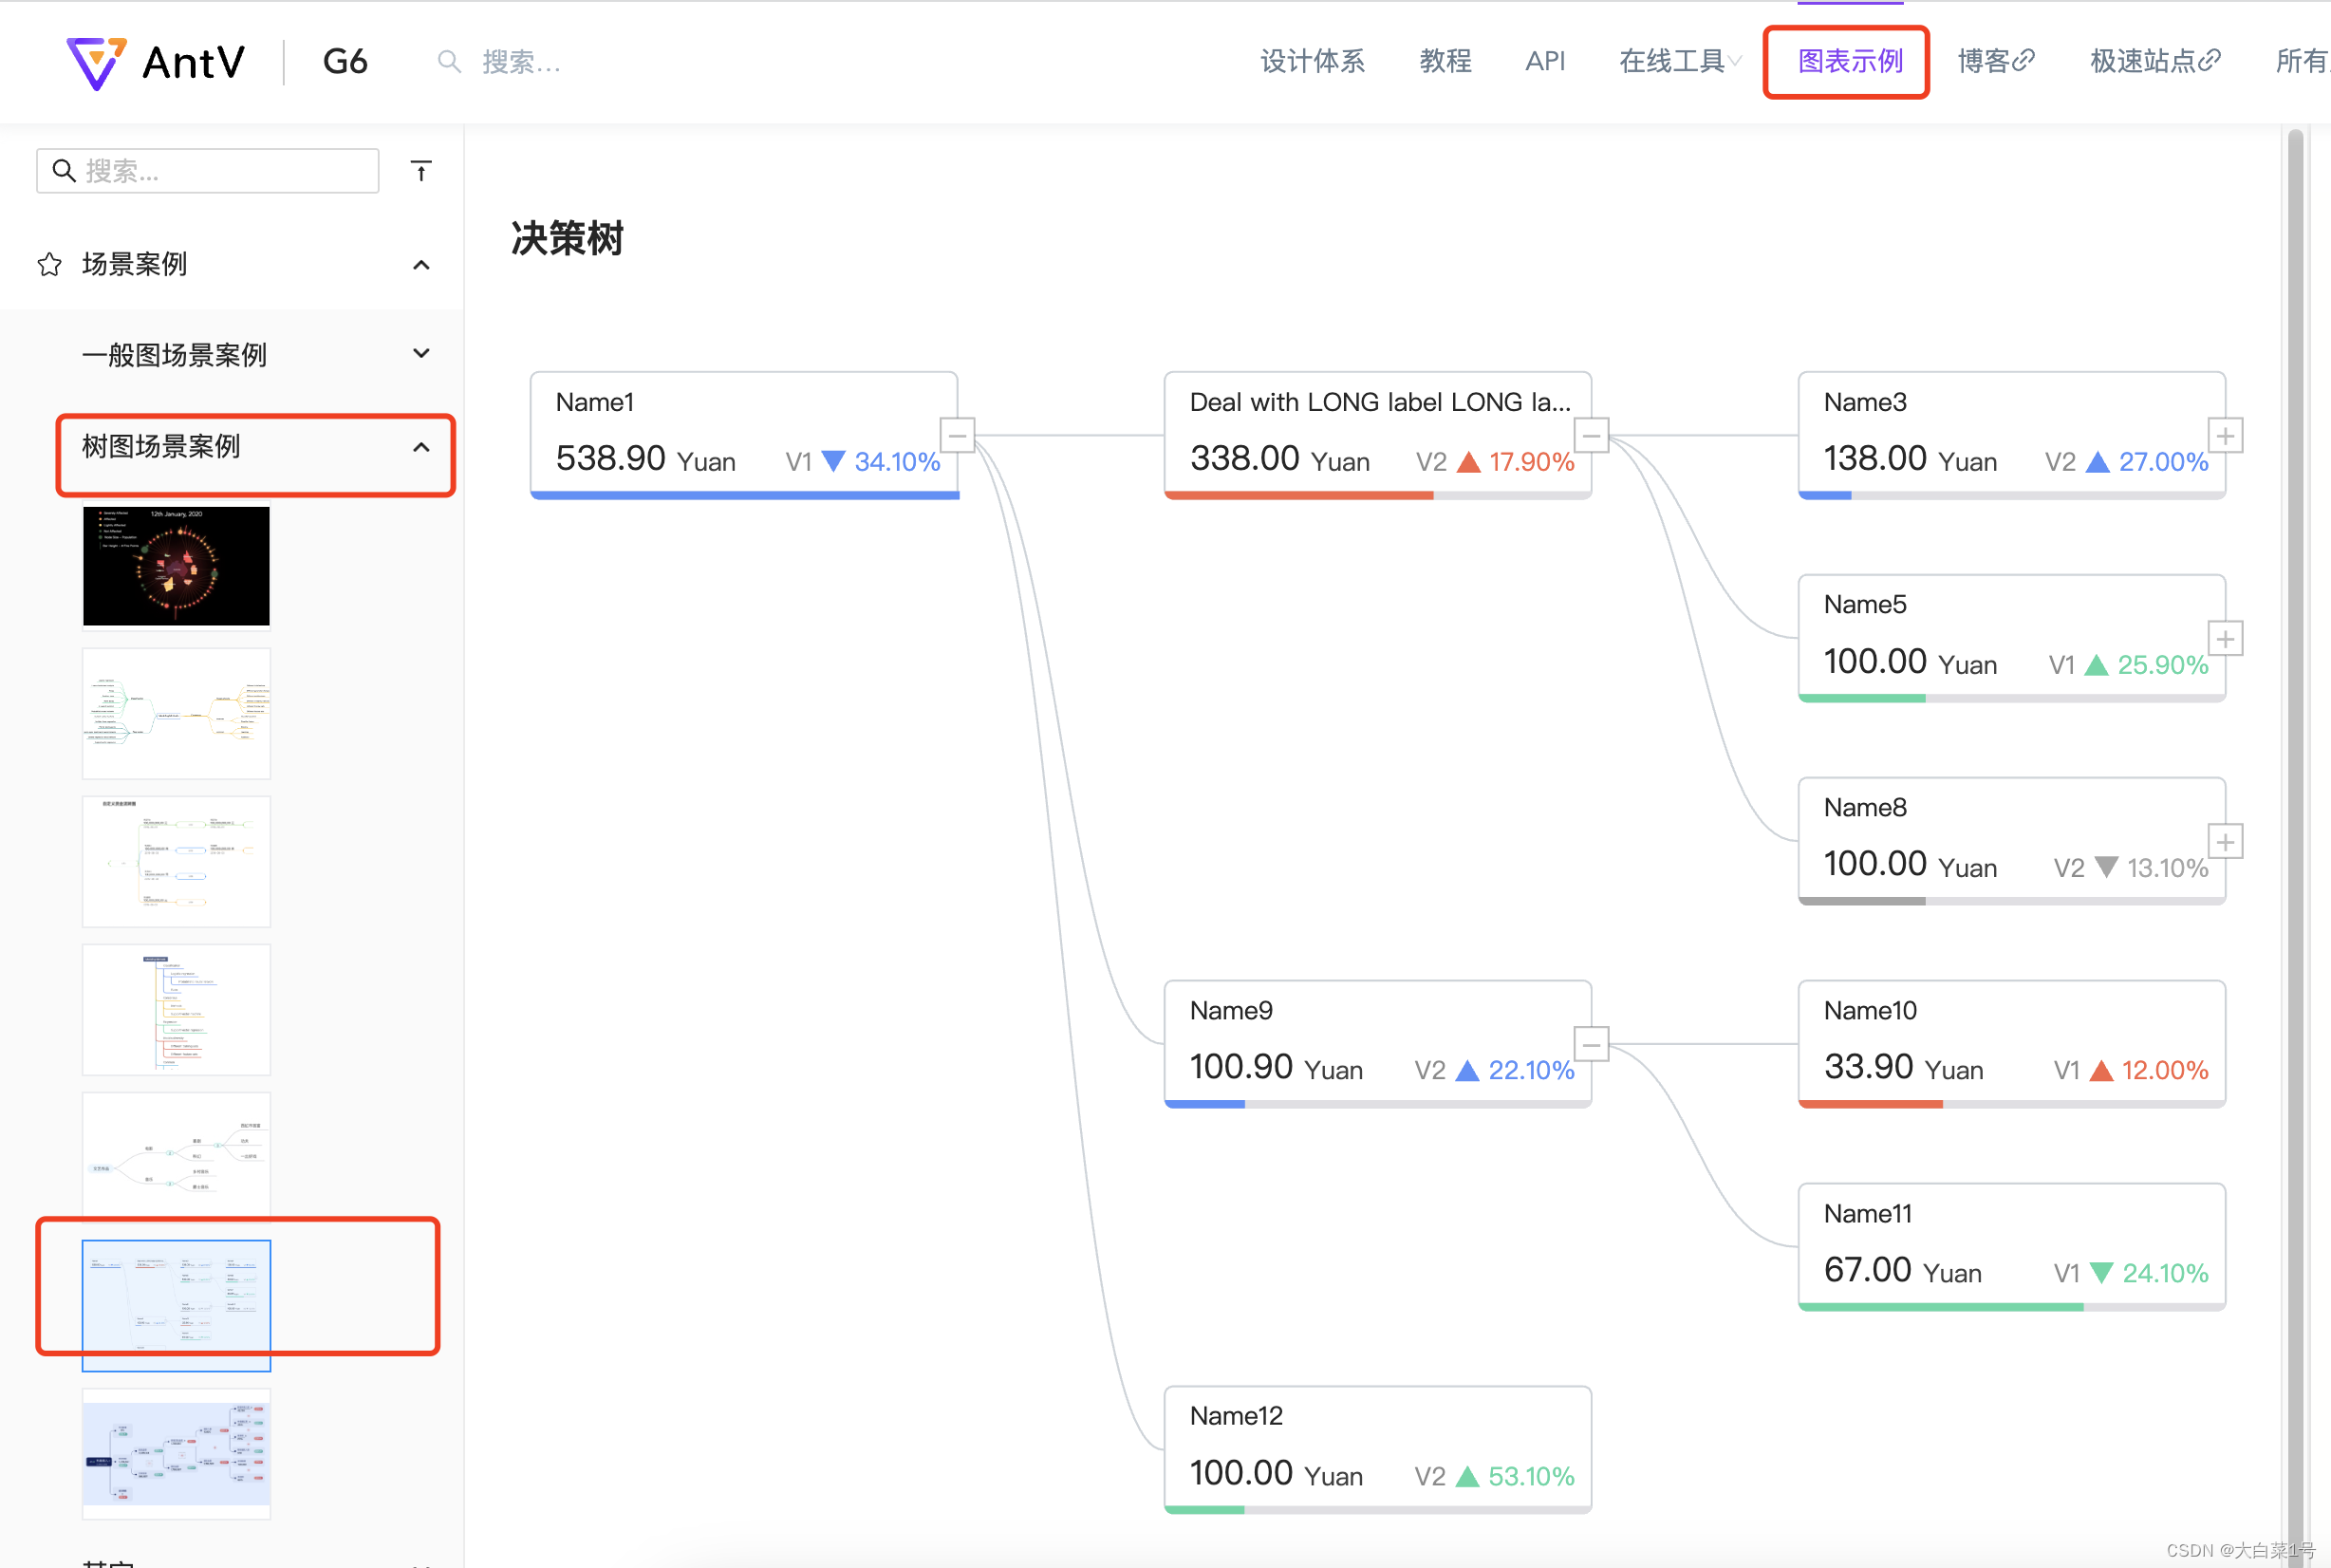
2. 在vue2+js中使用
1. 创建vue文件并引入import G6 from '@antv/g6';
2. 复制官网图谱实例(附上代码)
我不需要缩小图谱后更换样式,就删除了。
<template>
<div class="atlasDome">
<div id="container" class="container">
</div>
</div>
</template>
<script>
import G6 from '@antv/g6';
export default {
name: "atlasDome",
components: {
},
data() {
return {
mockData: {
id: 'g1',//id是唯一的不能重复
name: 'Name1',//名字
label: '538.90',//金额
currency: 'Yuan',//单位
rate: 1.0,//百分比进度条
status: 'B',//三角形颜色,可以模拟预警信息
variableName: 'V1',//三角形前边小名称
variableValue: 0.341,//百分比
variableUp: false,//也是控制三角形样式变化的
children: [
{
id: 'g12',
name: 'Deal with LONG label LONG label LONG label LONG label',
label: '338.00',
rate: 0.627,
status: 'R',
currency: 'Yuan',
variableName: 'V2',
variableValue: 0.179,
variableUp: true,
children: [
{
id: 'g121',
name: 'Name3',
collapsed: true,
label: '138.00',
rate: 0.123,
status: 'B',
currency: 'Yuan',
variableName: 'V2',
variableValue: 0.27,
variableUp: true,
children: [
{
id: 'g1211',
name: 'Name4',
label: '138.00',
rate: 1.0,
status: 'B',
currency: 'Yuan',
variableName: 'V1',
variableValue: 0.164,
variableUp: false,
children: [],
},
],
},
{
id: 'g122',
name: 'Name5',
collapsed: true,
label: '100.00',
rate: 0.296,
status: 'G',
currency: 'Yuan',
variableName: 'V1',
variableValue: 0.259,
variableUp: true,
children: [],
},
],
},
{
id: 'g13',
name: 'Name9',
label: '100.90',
rate: 0.187,
status: 'B',
currency: 'Yuan',
variableName: 'V2',
variableValue: 0.221,
variableUp: true,
children: [
{
id: 'g131',
name: 'Name10',
label: '33.90',
rate: 0.336,
status: 'R',
currency: 'Yuan',
variableName: 'V1',
variableValue: 0.12,
variableUp: true,
children: [],
},
{
id: 'g132',
name: 'Name11',
label: '67.00',
rate: 0.664,
status: 'G',
currency: 'Yuan',
variableName: 'V1',
variableValue: 0.241,
variableUp: false,
children: [],
},
],
},
{
id: 'g14',
name: 'Name12',
label: '100.00',
rate: 0.186,
status: 'G',
currency: 'Yuan',
variableName: 'V2',
variableValue: 0.531,
variableUp: true,
children: [],
},
],
}
};
},
computed: {},
created() {
this.$nextTick(() => {
this.initAtial()
})
},
mounted() {
},
methods: {
initAtial() {
const colors = {
B: '#5B8FF9',
R: '#F46649',
Y: '#EEBC20',
G: '#5BD8A6',
DI: '#A7A7A7',
};
// 组件props
const props = {
data: this.mockData,
config: {
padding: [20, 50],
defaultLevel: 3,
defaultZoom: 0.8,
modes: { default: ['zoom-canvas', 'drag-canvas'] },
},
};
const container = document.getElementById('container');
const width = container.scrollWidth;
const height = container.scrollHeight || 500;
// 默认配置
const defaultConfig = {
width,
height,
modes: {
default: ['zoom-canvas', 'drag-canvas'],
},
fitView: true,
animate: true,
defaultNode: {
type: 'flow-rect',
},
defaultEdge: {
type: 'extra-shape-edge',
// type: 'cubic-horizontal',
style: {
stroke: '#CED4D9',
},
},
layout: {
type: 'indented',
direction: 'LR',
dropCap: false,
indent: 300,
getHeight: () => {
return 60;
},
},
};
// 自定义节点、边
const registerFn = () => {
/**
* 自定义节点
*/
G6.registerNode(
'flow-rect',
{
shapeType: 'flow-rect',
draw(cfg, group) {
const {
name = '',
variableName,
variableValue,
variableUp,
label,
collapsed,
currency,
status,
rate
} = cfg;
const grey = '#CED4D9';
const rectConfig = {
width: 202,
height: 60,
lineWidth: 1,
fontSize: 12,
fill: '#fff',
radius: 4,
stroke: grey,
opacity: 1,
};
const nodeOrigin = {
x: -rectConfig.width / 2,
y: -rectConfig.height / 2,
};
const textConfig = {
textAlign: 'left',
textBaseline: 'bottom',
};
const rect = group.addShape('rect', {
attrs: {
x: nodeOrigin.x,
y: nodeOrigin.y,
...rectConfig,
},
});
const rectBBox = rect.getBBox();
// 标签标题
group.addShape('text', {
attrs: {
...textConfig,
x: 12 + nodeOrigin.x,
y: 20 + nodeOrigin.y,
text: name.length > 28 ? name.substr(0, 28) + '...' : name,
fontSize: 12,
opacity: 0.85,
fill: '#000',
cursor: 'pointer',
},
// 必须在G6 3.3及更高版本中分配。它可以是你想要的任何字符串,但在自定义项类型中应该是唯一的 name: 'name-shape',
});
// 价格
const price = group.addShape('text', {
attrs: {
...textConfig,
x: 12 + nodeOrigin.x,
y: rectBBox.maxY - 12,
text: label,
fontSize: 16,
fill: '#000',
opacity: 0.85,
},
});
// 标签的货币
group.addShape('text', {
attrs: {
...textConfig,
x: price.getBBox().maxX + 5,
y: rectBBox.maxY - 12,
text: currency,
fontSize: 12,
fill: '#000',
opacity: 0.75,
},
});
// 百分比
const percentText = group.addShape('text', {
attrs: {
...textConfig,
x: rectBBox.maxX - 8,
y: rectBBox.maxY - 12,
text: `${((variableValue || 0) * 100).toFixed(2)}%`,
fontSize: 12,
textAlign: 'right',
fill: colors[status],
},
});
// 三角形比例
const symbol = variableUp ? 'triangle' : 'triangle-down';
const triangle = group.addShape('marker', {
attrs: {
...textConfig,
x: percentText.getBBox().minX - 10,
y: rectBBox.maxY - 12 - 6,
symbol,
r: 6,
fill: colors[status],
},
});
// 变量名
group.addShape('text', {
attrs: {
...textConfig,
x: triangle.getBBox().minX - 4,
y: rectBBox.maxY - 12,
text: variableName,
fontSize: 12,
textAlign: 'right',
fill: '#000',
opacity: 0.45,
},
});
// bottom line background
const bottomBackRect = group.addShape('rect', {
attrs: {
x: nodeOrigin.x,
y: rectBBox.maxY - 4,
width: rectConfig.width,
height: 4,
radius: [0, 0, rectConfig.radius, rectConfig.radius],
fill: '#E0DFE3',
},
});
bottomBackRect.set('capture', false);
// bottom percent
const bottomRect = group.addShape('rect', {
attrs: {
x: nodeOrigin.x,
y: rectBBox.maxY - 4,
width: rate * rectBBox.width,
height: 4,
radius: [0, 0, 0, rectConfig.radius],
fill: colors[status],
},
});
bottomRect.set('capture', false);
// 矩形
if (cfg.children && cfg.children.length) {
group.addShape('rect', {
attrs: {
x: rectConfig.width / 2 - 8,
y: -8,
width: 16,
height: 16,
stroke: 'rgba(0, 0, 0, 0.25)',
cursor: 'pointer',
fill: '#fff',
},
// must be assigned in G6 3.3 and later versions. it can be any string you want, but should be unique in a custom item type
name: 'collapse-back',
modelId: cfg.id,
});
// collpase text
group.addShape('text', {
attrs: {
x: rectConfig.width / 2,
y: -1,
textAlign: 'center',
textBaseline: 'middle',
text: collapsed ? '+' : '-',
fontSize: 16,
cursor: 'pointer',
fill: 'rgba(0, 0, 0, 0.25)',
},
// must be assigned in G6 3.3 and later versions. it can be any string you want, but should be unique in a custom item type
name: 'collapse-text',
modelId: cfg.id,
});
}
this.drawLinkPoints(cfg, group);
return rect;
},
update(cfg, item) {
const { level, status, name } = cfg;
const group = item.getContainer();
let mask = group.find(ele => ele.get('name') === 'mask-shape');
let maskLabel = group.find(ele => ele.get('name') === 'mask-label-shape');
if (level === 0) {
group.get('children').forEach(child => {
if (child.get('name')?.includes('collapse')) return;
child.hide();
})
if (!mask) {
mask = group.addShape('rect', {
attrs: {
x: -101,
y: -30,
width: 202,
height: 60,
opacity: 0,
fill: colors[status]
},
// must be assigned in G6 3.3 and later versions. it can be any string you want, but should be unique in a custom item type
name: 'mask-shape',
});
maskLabel = group.addShape('text', {
attrs: {
fill: '#fff',
fontSize: 20,
x: 0,
y: 10,
text: name.length > 28 ? name.substr(0, 16) + '...' : name,
textAlign: 'center',
opacity: 0,
},
// must be assigned in G6 3.3 and later versions. it can be any string you want, but should be unique in a custom item type
name: 'mask-label-shape',
});
const collapseRect = group.find(ele => ele.get('name') === 'collapse-back');
const collapseText = group.find(ele => ele.get('name') === 'collapse-text');
collapseRect?.toFront();
collapseText?.toFront();
} else {
mask.show();
maskLabel.show();
}
mask.animate({ opacity: 1 }, 200);
maskLabel.animate({ opacity: 1 }, 200);
return mask;
} else {
group.get('children').forEach(child => {
if (child.get('name')?.includes('collapse')) return;
child.show();
})
mask?.animate({ opacity: 0 }, {
duration: 200,
callback: () => mask.hide()
});
maskLabel?.animate({ opacity: 0 }, {
duration: 200,
callback: () => maskLabel.hide()
});
}
this.updateLinkPoints(cfg, group);
},
setState(name, value, item) {
if (name === 'collapse') {
const group = item.getContainer();
const collapseText = group.find((e) => e.get('name') === 'collapse-text');
if (collapseText) {
if (!value) {
collapseText.attr({
text: '-',
});
} else {
collapseText.attr({
text: '+',
});
}
}
}
},
getAnchorPoints() {
return [
[0, 0.5],
[1, 0.5],
];
},
},
'rect',
);
G6.registerEdge(
'flow-cubic',
{
getControlPoints(cfg) {
let controlPoints = cfg.controlPoints; // 指定controlPoints
if (!controlPoints || !controlPoints.length) {
const { startPoint, endPoint, sourceNode, targetNode } = cfg;
const { x: startX, y: startY, coefficientX, coefficientY } = sourceNode
? sourceNode.getModel()
: startPoint;
const { x: endX, y: endY } = targetNode ? targetNode.getModel() : endPoint;
let curveStart = (endX - startX) * coefficientX;
let curveEnd = (endY - startY) * coefficientY;
curveStart = curveStart > 40 ? 40 : curveStart;
curveEnd = curveEnd < -30 ? curveEnd : -30;
controlPoints = [
{ x: startPoint.x + curveStart, y: startPoint.y },
{ x: endPoint.x + curveEnd, y: endPoint.y },
];
}
return controlPoints;
},
getPath(points) {
const path = [];
path.push(['M', points[0].x, points[0].y]);
path.push([
'C',
points[1].x,
points[1].y,
points[2].x,
points[2].y,
points[3].x,
points[3].y,
]);
return path;
},
},
'single-line',
);
};
registerFn();
const { data } = props;
let graph = null;
const initGraph = (data) => {
if (!data) {
return;
}
const { onInit, config } = props;
const tooltip = new G6.Tooltip({
// offsetX和offsetY包含父容器的内边距
offsetX: 20,
offsetY: 30,
// 允许工具提示显示的项目类型
// 允许出现 tooltip 的 item 类型
itemTypes: ['node'],
// 自定义提示条的内容
// 自定义 tooltip 内容
getContent: (e) => {
const outDiv = document.createElement('div');
//outDiv.style.padding = '0px 0px 20px 0px';
const nodeName = e.item.getModel().name;
let formatedNodeName = '';
for (let i = 0; i < nodeName.length; i++) {
formatedNodeName = `${formatedNodeName}${nodeName[i]}`;
if (i !== 0 && i % 20 === 0) formatedNodeName = `${formatedNodeName}<br/>`;
}
outDiv.innerHTML = `${formatedNodeName}`;
return outDiv;
},
shouldBegin: (e) => {
if (e.target.get('name') === 'name-shape' || e.target.get('name') === 'mask-label-shape') return true;
return false;
},
});
graph = new G6.TreeGraph({
container: 'container',
...defaultConfig,
...config,
plugins: [tooltip],
});
if (typeof onInit === 'function') {
onInit(graph);
}
graph.data(data);
graph.render();
const handleCollapse = (e) => {
const target = e.target;
const id = target.get('modelId');
const item = graph.findById(id);
const nodeModel = item.getModel();
nodeModel.collapsed = !nodeModel.collapsed;
graph.layout();
graph.setItemState(item, 'collapse', nodeModel.collapsed);
};
graph.on('collapse-text:click', (e) => {
handleCollapse(e);
});
graph.on('collapse-back:click', (e) => {
handleCollapse(e);
});
};
initGraph(data);
if (typeof window !== 'undefined')
window.onresize = () => {
console.log(container.scrollWidth, container.scrollHeight)
if (!graph || graph.get('destroyed')) return;
if (!container || !container.scrollWidth || !container.scrollHeight) return;
graph.changeSize(container.scrollWidth, container.scrollHeight);
};
}
}
};
</script>
<style lang="scss" scoped>
.atlasDome {
width: 1920px;
height: 1080px;
display: flex;
align-items: center;
justify-content: center;
background-color: #03132F;
}
.container {
width: 1000px;
height: 800px;
background-color: #ffffff;
}
</style>
3. 设置流动线,链接线上自定义一个运动的小球
1. 官网dome地址
https://g6.antv.antgroup.com/zh/examples/scatter/edge/#edge
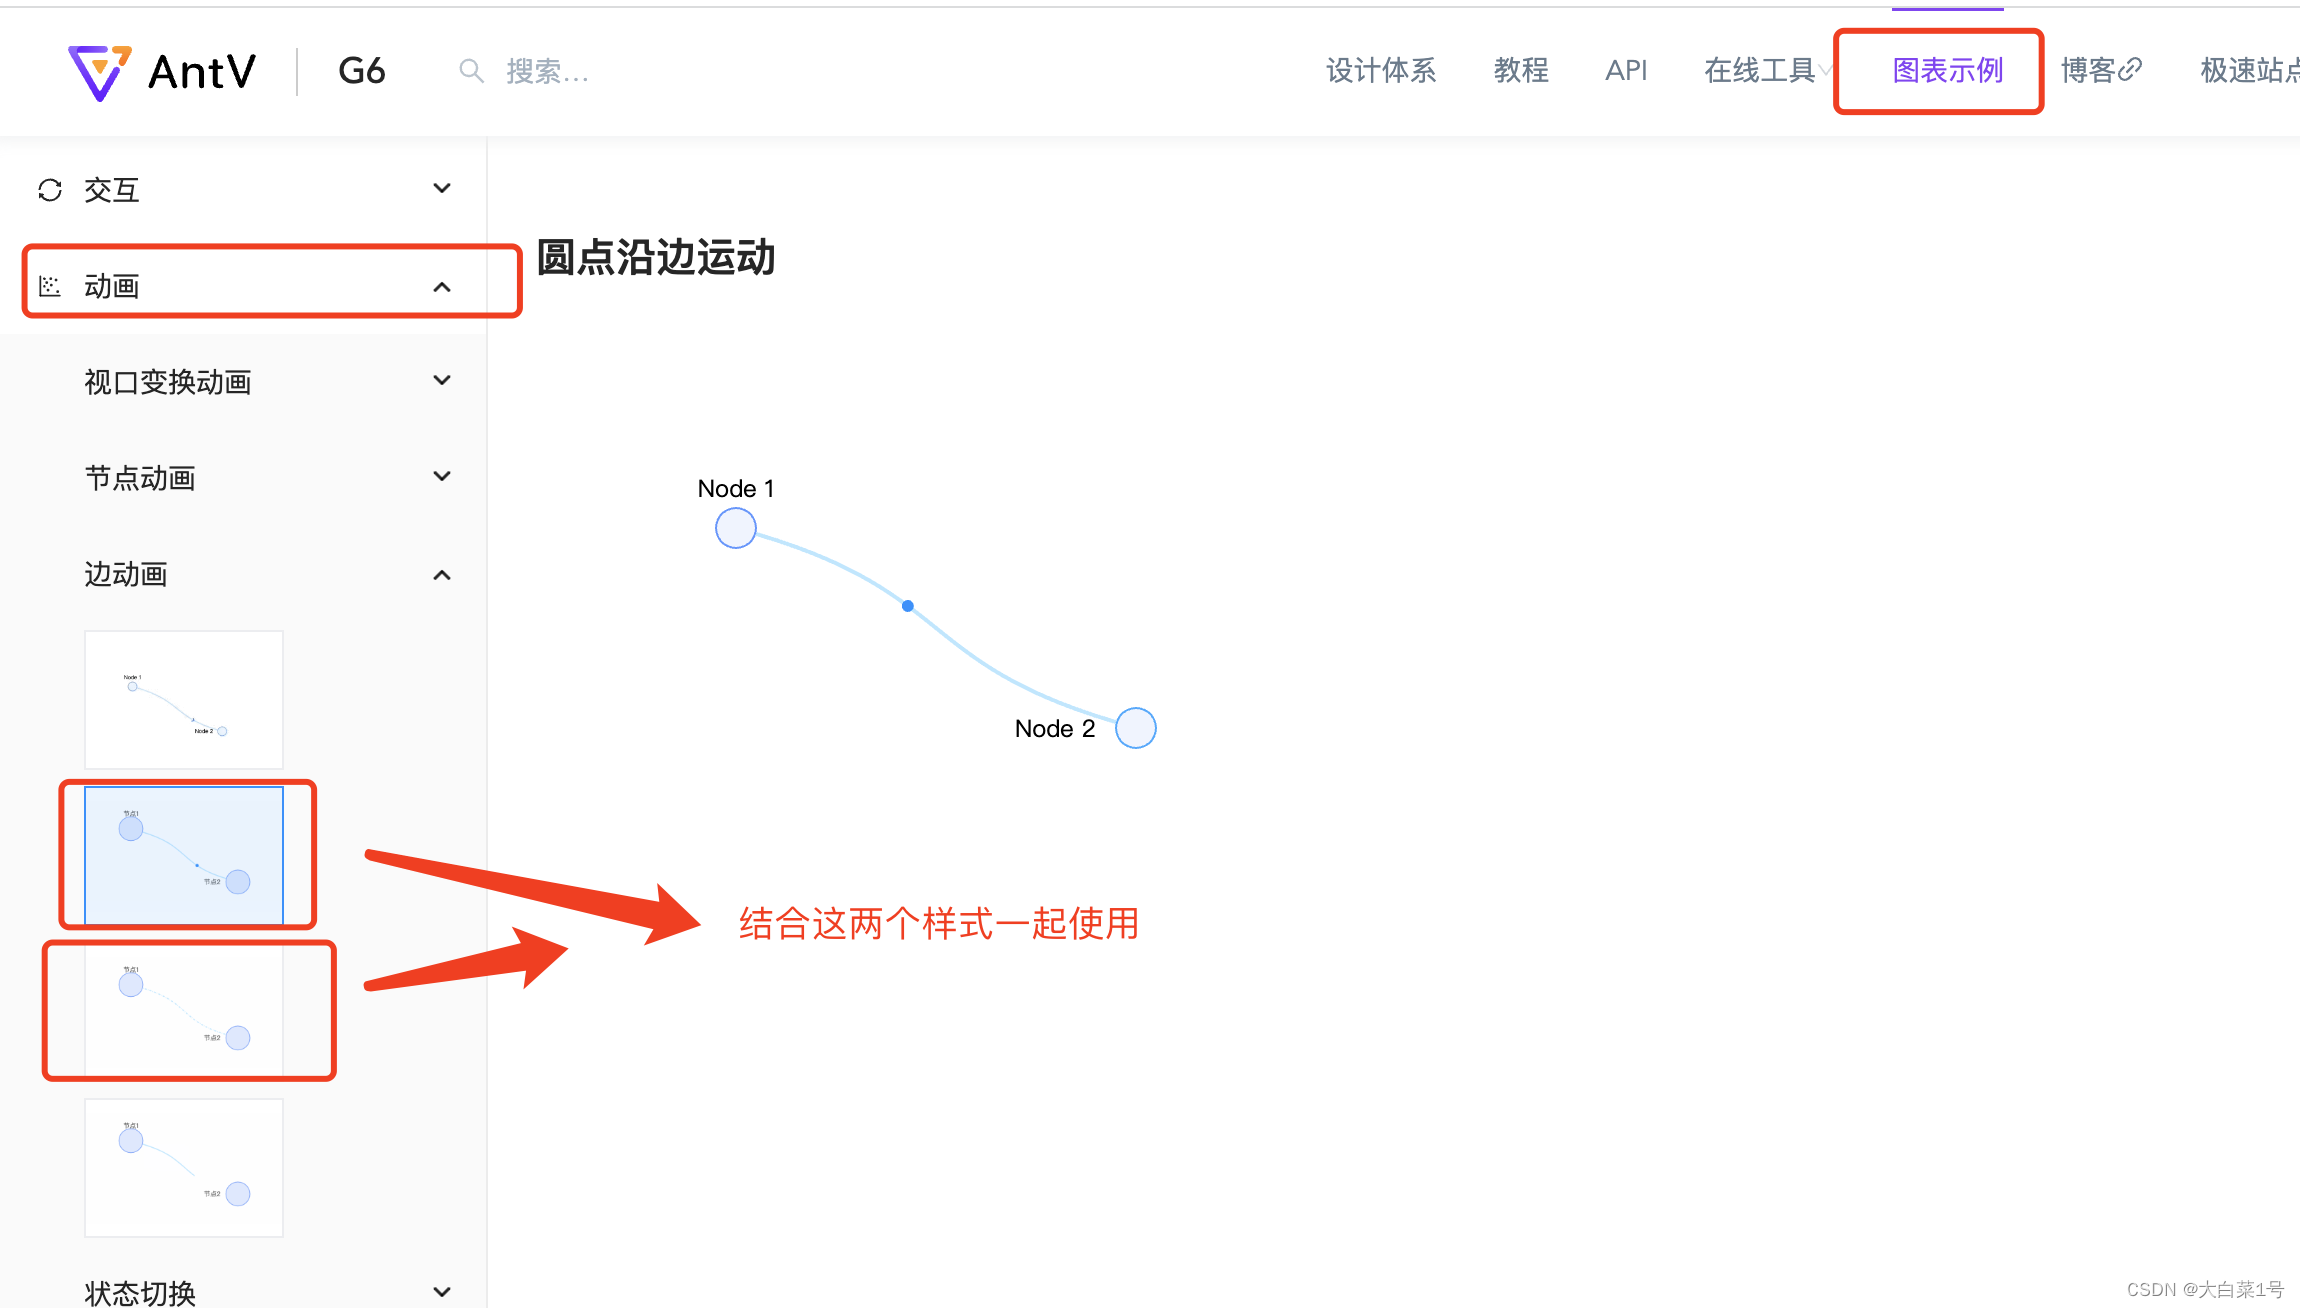
2. 结合官网修改代码
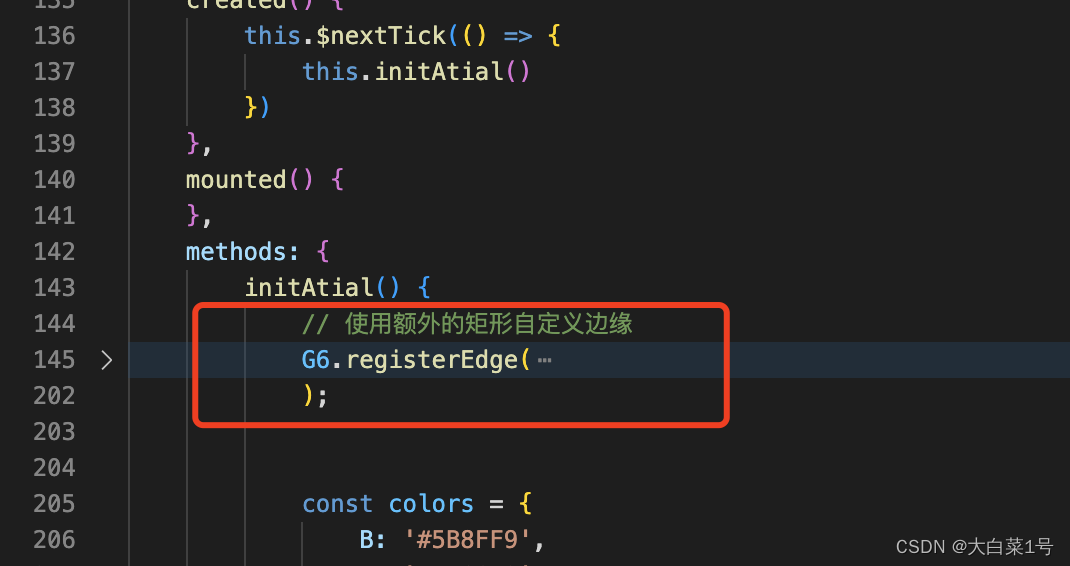
     // 使用额外的矩形自定义边缘
            G6.registerEdge(
                'extra-shape-edge',
                {
                    afterDraw(cfg, group) {
                        // 获取图形组中的第一个图形,在这里就是边的路径图形
                        const shape = group.get('children')[0];
                        // 获取路径上的0.25位点坐标 // 在该点上放置一个圆形
                        const quatile = shape.getPoint(0.25);
                        const quatileColor = cfg.quatileColor || '#9cdff1';//这里可以在数据中设置,来动态更新颜色

                        const circle = group.addShape('circle', {
                            attrs: {
                                r: 3,
                                fill: quatileColor || '#9cdff1',
                                x: quatile.x,
                                y: quatile.y,
                            },
                        });
                        circle.animate(
                            (ratio) => {
                                ratio ;
                                const tmpPoint = shape.getPoint(ratio);
                                return {
                                    x: tmpPoint.x,
                                    y: tmpPoint.y,
                                };
                            },
                            {
                                repeat: true, // 是否重复执行动画
                                duration: 2000, // the duration for executing once
                            },
                        );
                        let index = 0;
                        // 定义动画逻辑
                        shape.animate(
                            () => {
                                index -= 0.8;
                                if (index > 55) {
                                    index = 0;
                                }
                                // 设置线型和线型偏移量
                                const res = {
                                    lineDash:[4, 2, 1, 2], // 设置虚线的实际线段长度和间隔长度
                                    lineDashOffset: -index, // 设置虚线的偏移量
                                };
                                // 返回修改后的配置,包括线型和线型偏移量
                                return res;
                            },
                            {
                                repeat: true, // 是否循环执行动画
                                duration: 5000,// 单次动画执行的时间
                            },
                        );
                    },
                    update: undefined,
                },
                'cubic',
            );
3. 运行后样式
屏幕录制2023-09-11 14.03.38
4 . 更新图谱
要把graph设置成全局变量或者放在this上
       <button @click="update"> 更新图谱</button>
        // 更新图谱
        update() {
            // graph是Graph的实例
            graph.changeData(this.mockData);
            // 若不指定该参数,则使用当前图上的数据重新渲染
            graph.changeData();
            // 根据提供的数据渲染视图。
            graph.render();
        }
5. 支点跟随–聚焦一个节点
1. 官网地址
https://g6.antv.antgroup.com/zh/examples/interaction/position/#moveAnimate
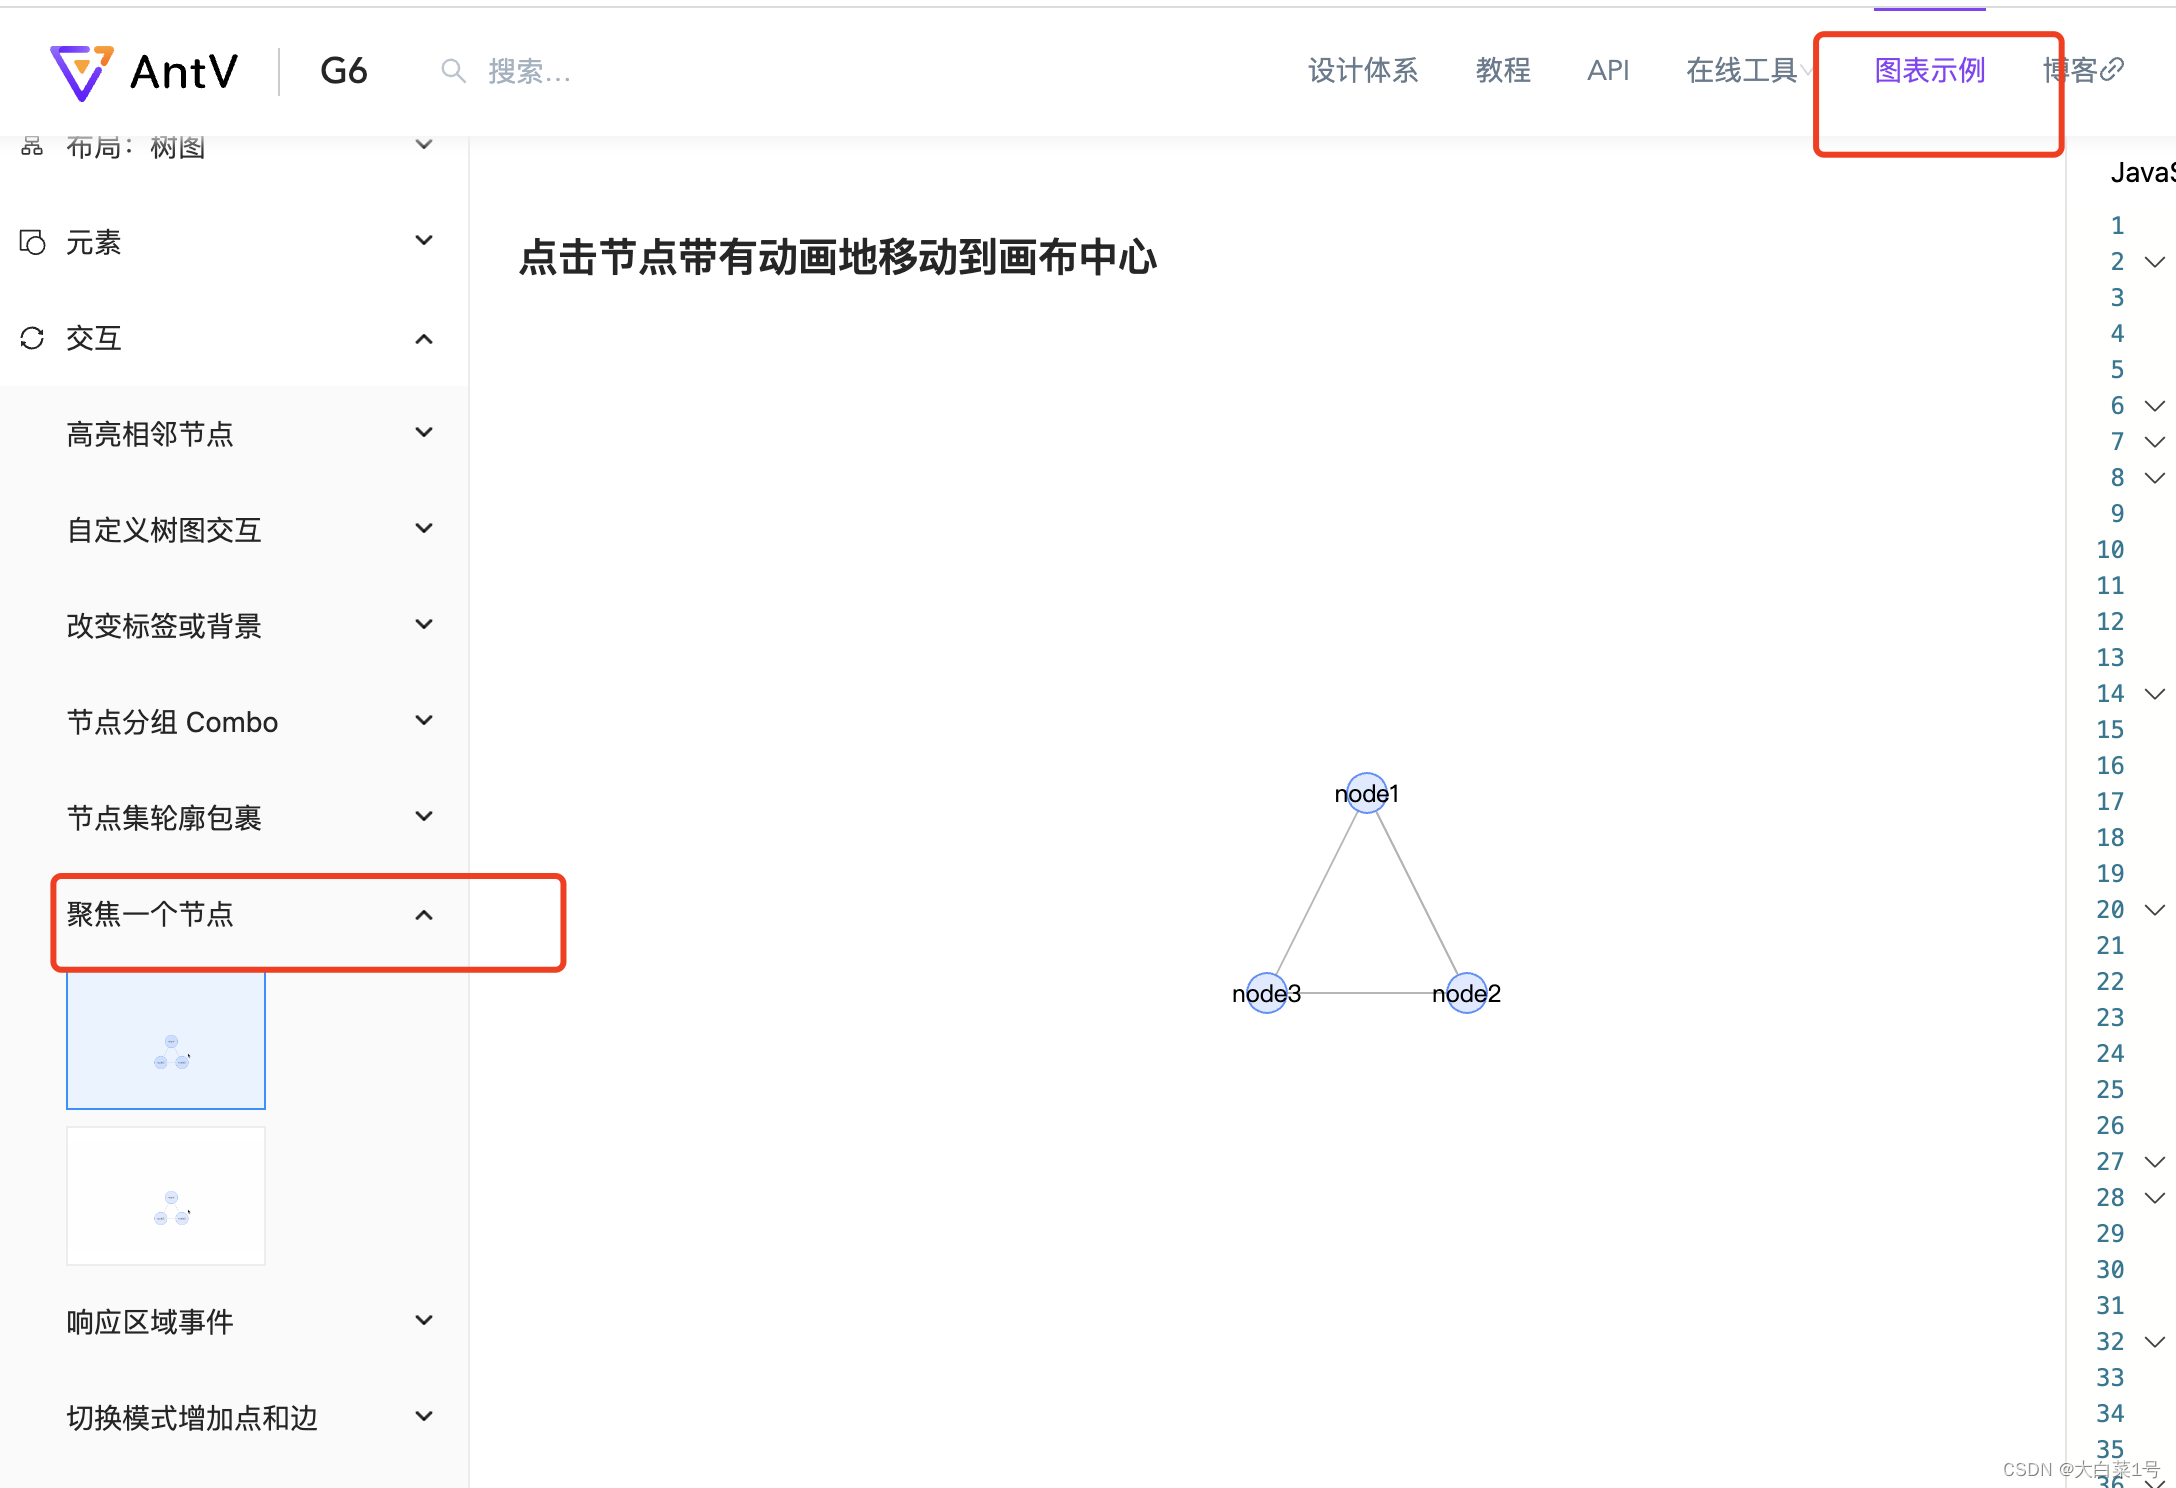
2. graph.render();后添加聚焦节点代码
    function handleNodeClick(event) {
                    const item = event.item;
                    // animately move the graph to focus on the item.
                    // the second parameter controlls whether move with animation, the third parameter is the animate configuration
                    graph.focusItem(item, true, {
                        easing: 'easeCubic',
                        duration: 500,
                    });
                }

                // listen to the node click event
                graph.on('node:click', handleNodeClick);
3. 运行后效果
聚焦节点
